. 2021 Mar 20;24(4):102339.
doi: 10.1016/j.isci.2021.102339. eCollection 2021 Apr 23.

Streptococcal protein SIC activates monocytes and induces inflammation

Affiliations

Streptococcal protein SIC activates monocytes and induces inflammation

Ariane Neumann et al. iScience. .

Abstract

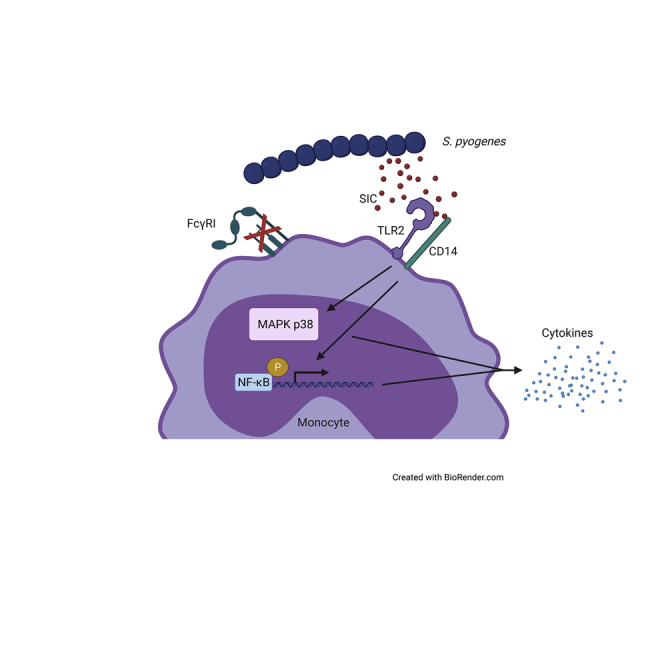
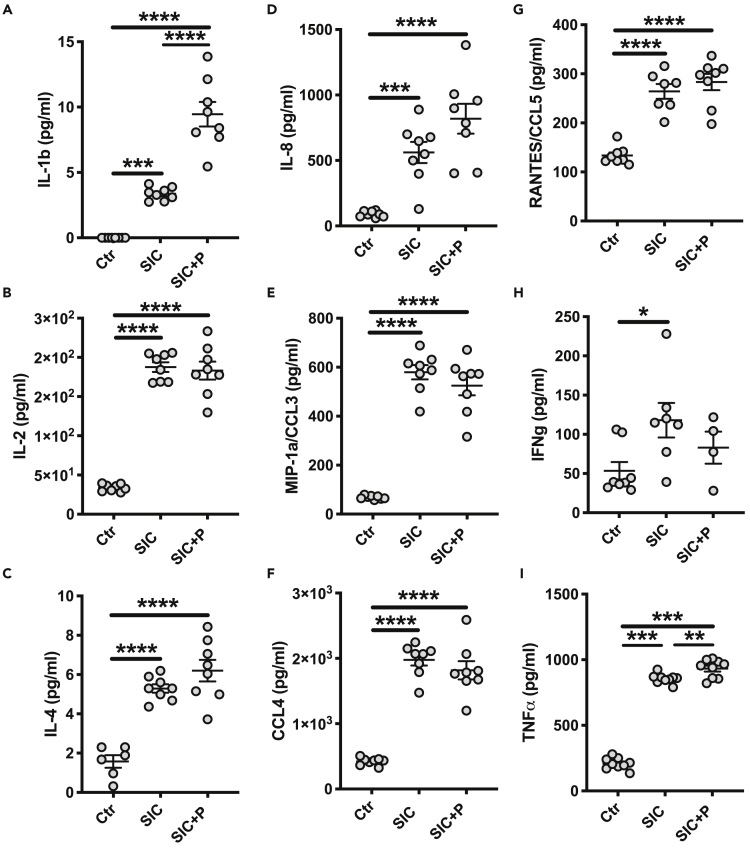
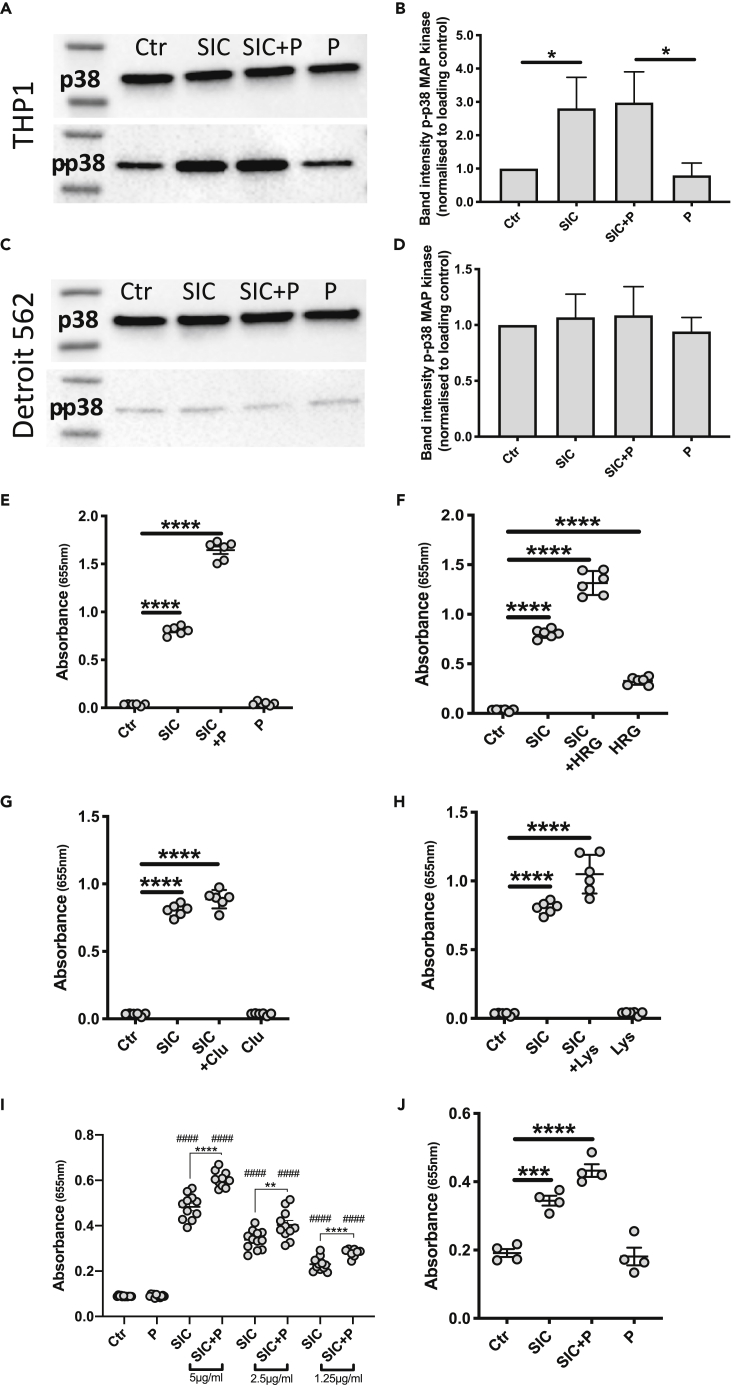
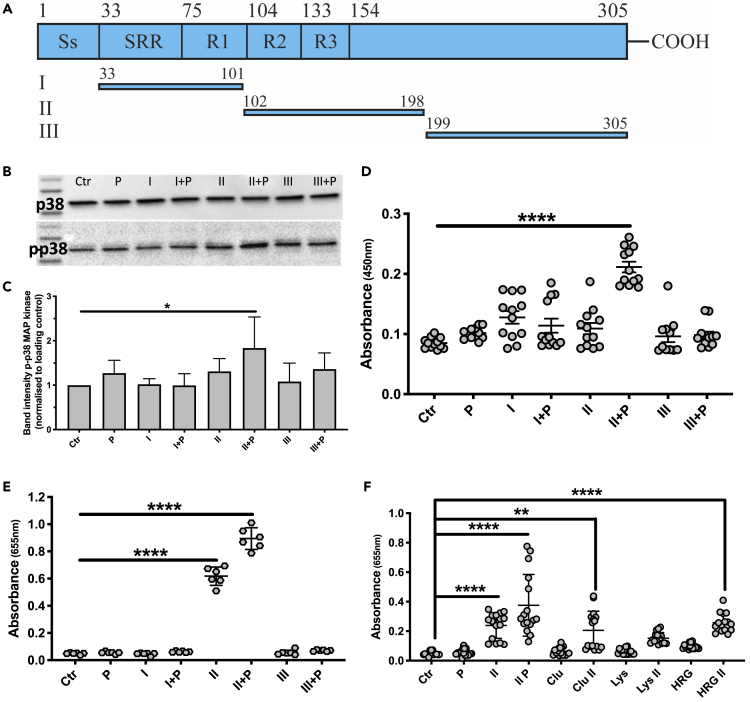
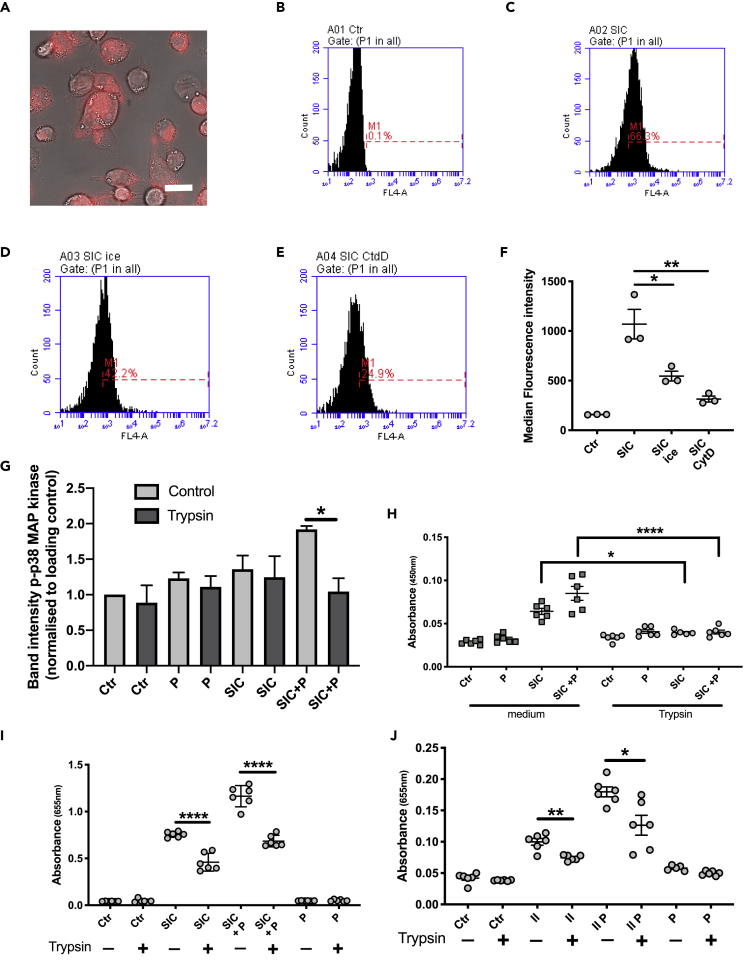
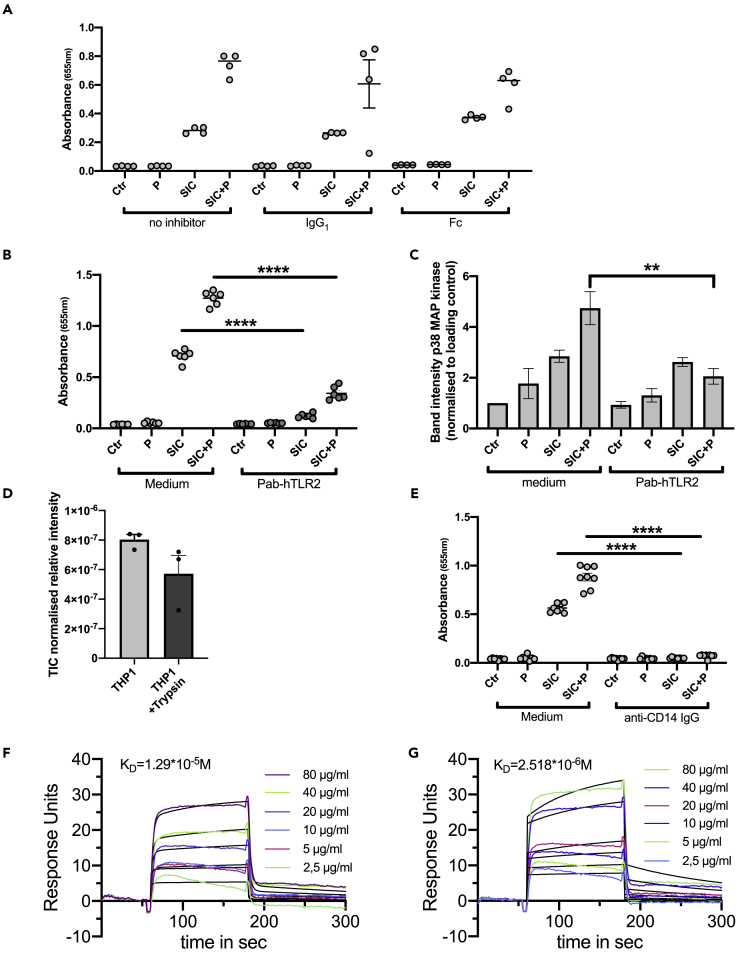
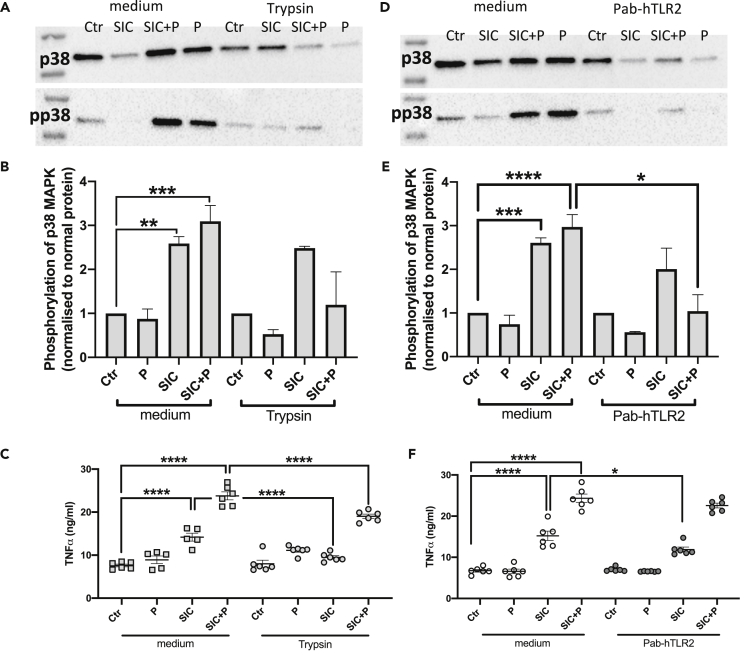
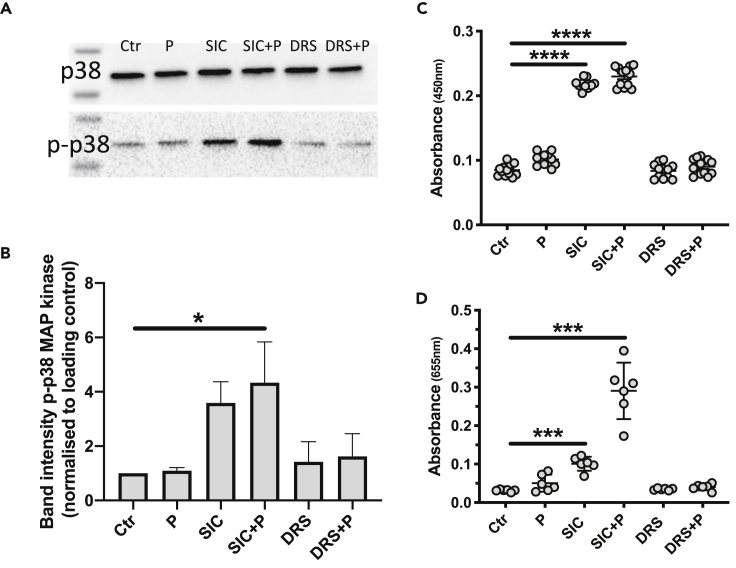
Streptococcus pyogenes is a major bacterial pathogen in the human population and isolates of the clinically important M1 serotype secrete protein Streptococcal inhibitor of complement (SIC) known to interfere with human innate immunity. Here we find that SIC from M1 bacteria interacts with TLR2 and CD14 on monocytes leading to the activation of the NF-κB and p38 MAPK pathways and the release of several pro-inflammatory cytokines (e.g. TNFα and INFγ). In human plasma, SIC binds clusterin and histidine-rich glycoprotein, and whole plasma, and these two purified plasma proteins enhanced the activation of monocytes by SIC. Isolates of the M55 serotype secrete an SIC homolog, but this protein did not activate monocytes. M1 isolates are common in cases of invasive S. pyogenes infections characterized by massive inflammation, and the results of this study indicate that the pro-inflammatory property of SIC contributes to the pathology of these severe clinical conditions.

Keywords: Clinical Microbiology; Immunology; Microbiology.


Conflict of interest statement

The authors declare no competing interest.

Figures

None
Graphical abstract
Figure 1
Figure 1
Growth medium from S. pyogenes secreting SIC activates THP1 cells (A) Lysates of THP1 cells after incubation with AP1 or ΔSIC growth medium (GM) were subjected to SDS-PAGE and Western blot. The membranes were probed with antibodies against p38 MAP kinase (p38) and phospho-p38 MAP kinase (p-p38). Ctr: medium. Med: concentrated medium. (B) Band intensity analysis of the Western blot depicted in A. The band intensity of phosphorylated p38 was normalized to the band intensity of p38 MAPK. (C) TNFα release from THP1 cells incubated with GM from AP1 or ΔSIC was measured by ELISA. (D) The SIC concentration in AP1 GM was determined by direct ELISA and compared to purified protein. (E) THP1 cells were incubated for 18 hr with GM from AP1, ΔSIC or ΔSIC +3 μg/mL purified SIC. Absorbance of QuantiBlue color change as indicator for NF-κB activation was measured at 655 nm. (F) Quantitative MS analysis of purified SIC. Three fractions of purified SIC were digested with trypsin and analyzed with mass spectrometry. The resulting data was searched against the S. pyogenes AP1 proteome and the identified peptides were further analyzed with MS1 precursor intensity-based quantification. The figure shows the top 4 most abundant streptococcal proteins identified in the fractions. The y axis is relative percentage of top4 protein intensity. All data represent mean ± SEM of 3 independent experiments, one-way ANOVA, Dunnett's multiple comparison test, with single pooled variance. ∗p < 0.05, ∗∗p < 0.01, ∗∗∗p < 0.001, ∗∗∗∗p < 0.0001.
Figure 2
Figure 2
SIC changes the cytokine profile of THP1 cells (A–I) Cells were incubated for 2 hr with 5 μg/mL SIC +/− 2.5% plasma. Supernatants were collected and analyzed using a 27-plex cytokine assay. All data represent mean ± SEM of 3 independent experiments, one-way ANOVA, Dunnett's multiple comparison test, with single pooled variance. ∗p < 0.05, ∗∗∗p < 0.001, ∗∗∗∗p < 0.0001.
Figure 3
Figure 3
SIC phosphorylates p38 MAP kinase in THP1 cells and activates NF-κB (A and C) Representative images of Western blot analysis of cell extracts from THP1 and Detroit 562 cells incubated with 5 μg/mL SIC +/− 2.5% plasma (P). Membranes were incubated with anti-p38 MAPK (p38) and anti-phospho-p38 MAPK (p-p38) antibodies. (B and D) Band intensity analysis of Western blots displayed in A and C. The band intensity of phosphorylated p38 was normalized to the band intensity of p38 MAPK. (E–H) Cells were incubated with 5 μg/mL SIC alone or in combination with E: 2.5% plasma F: 200 ng/mL HRG G: 5 μg/mL clusterin H: 5 μg/mL lysozyme for 18 hr. Cells were also incubated with plasma and the plasma proteins alone. (I) THP1 cells were incubated with 5 μg/mL, 2.5 μg/mL or 1.25 μg/mL SIC in the presence or absence of 2.5% plasma (P) for 18 hr. (J) THP1 cells were differentiated into macrophages with 100 nM PMA and the activation of NF-κB was analyzed after incubation with 5 μg/mL SIC +/− 2.5% plasma (P). NF-κB activation was detected as color changes of QuantiBlue solution, absorbance was measured at 655 nm. All data represent mean ± SEM of 3-5 independent experiments, one-way ANOVA, Dunnett's multiple comparison test, with single pooled variance. ∗p < 0.05, ∗∗∗p < 0.001, ∗∗∗∗p < 0.0001. ####p < 0.0001 compared to untreated control.
Figure 4
Figure 4
Fragment II of SIC (aa 102–198) is responsible for the activation of THP1 cells (A) Schematic structure of SIC from strain AP1 and zlocalization of the three fragments used. The signal sequence (Ss) is cleaved off during maturation. The mature secreted protein contains a short repeat region (SRR), as well as three tandem repeats (R1-R3). The numbers indicate amino acid positions, and also refer to the length of each of the SIC fragments (I-III), which are recombinantly expressed in E. coli. Based on previous publications (Fernie-King et al., 2004; Binks et al., 2005), the sizes of the fragments were chosen. (B) Western blot analyses of THP1 cell lysates after stimulation with 5 μg/mL SIC fragments (I, II, III) +/− 2.5% plasma (P). Membranes were incubated with antibodies against p38 MAPK (p38) and phosphorylated p38 MAPK (p-p38). (C) Quantification of phosphorylation of Western blots depicted in B. The band intensities of p-p38 samples were normalized to loading control (p38 band) and values analyzed. (D) THP1 cells were incubated with 5 μg/mL SIC fragments +/− 2.5% plasma (P) and the release of TNFα was measured by ELISA. (E) Activation of NF-κB by SIC fragments +/− plasma was analyzed by detecting QuantiBlue color change at 655 nm. (F) Absorbance of QuantiBlue color change at 655 nm, as indicator of NF-κB activation after THP1 cell incubation with 5 μg/mL SIC fragment II alone and in combination with 2.5% whole plasma (P), 5 μg/mL clusterin (Clu), 5 μg/mL lysozyme (Lys) or 200 ng/mL HRG. All data represent mean ± SEM of 4-6 independent experiments, one-way ANOVA, Dunnett's multiple comparison test, with single pooled variance. ∗p < 0.05, ∗∗p < 0.01, ∗∗∗∗p < 0.0001.
Figure 5
Figure 5
Analysis of the interaction between SIC and THP1 cells (A) THP1 cells were incubated for 45 min with 5 μg/mL AlexaFluor 633-labeled SIC protein (red). Live imaging of the cells was used to observe the interaction of SIC with the THP1 cells. Scale bar represents 20 μm. (B–E) Flow cytometry analysis of SIC-monocyte interaction. B: THP1 cells incubated with medium (Ctr) C: THP1 cells incubated with 5 μg/mL SIC (SIC) D: THP1 cells incubated with 5 μg/mL SIC on ice (SIC ice) E: THP1 cells pre-incubated with 20 μM CytD for 30 min, then incubated with 5 μg/mL SIC (SIC CtdD). (F) Median fluorescent intensity analysis of SIC interaction with the cells in B-E. Data shown from 3 independent experiments, ∗p < 0.05, ∗∗p < 0.01. (G) THP1 cells, untreated or trypsinized, were incubated with 5 μg/mL SIC +/− 2.5% plasma (P). Lysates of the cells were subjected to SDS-PAGE analysis and Western blot. Membranes were probed with antibodies against p38 MAPK (p38) and phosphorylated p38 MAPK (p-p38). Band intensities were analyzed. (H) TNFα secretion by untreated and trypsinized THP1 cells, incubated with 5 μg/mL by SIC +/− 2.5% plasma (P) was measured by ELISA at 450 nm. (I) Untreated and trypsinized THP1 cells were incubated with 5 μg/mL SIC +/− 2.5% plasma (P) and activation of NF-κB was measured at 655 nm. (J) Untreated and trypsinized THP1 cells were incubated with 5 μg/mL SIC fragment II +/− 2.5% plasma (P) and activation of NF-κB was measured. All data represent mean ± SEM of 3-5 independent experiments, one-way ANOVA, Dunnett's multiple comparison test, with single pooled variance ∗p < 0.05, ∗∗p < 0.01, ∗∗∗∗p < 0.0001.
Figure 6
Figure 6
SIC interacts with TLR2 and CD14 to activate THP1 cells (A) THP1 cells were pre-incubated for 30 min with IgG1 and Fc fragment and then incubated with 5 μg/mL SIC +/− 2.5% plasma (P). NF-κB activation was analyzed at 655 nm. (B) Cells were pre-incubated with a neutralizing antibody against TLR2 and then incubated with 5 μg/mL SIC +/− 2.5% plasma (P). Activation of NF-κB was measured at 655 nm. (C) Quantification of phosphorylation of Western blots of THP1 cells treated with a neutralizing antibody against TLR2. The band intensities of p-p38 samples were normalized to loading control (p38 band) and values analyzed. (D) Quantitative DIA-MS analysis of THP1 cells before and after trypsin treatment. (E) THP1 cells were pre-incubated with antibodies against CD14 and then incubated with 5 μg/mL SIC +/− 2.5% plasma (P). NF-κB activation was analyzed. (F) Surface plasmon resonance data show interaction of different SIC concentrations to immobilized TLR2. Representative original data are displayed in colors, 1:1 Langmuir fitted curves are presented in black. (G) Surface plasmon resonance data show interaction of different SIC concentrations to immobilized CD14. Representative original data are displayed in colors, 1:1 Langmuir fitted curves are presented in black. All data represent mean ± SEM of 3 independent experiments, one-way ANOVA, Dunnett's multiple comparison test, with single pooled variance. ∗∗p < 0.01, ∗∗∗∗p < 0.0001.
Figure 7
Figure 7
SIC triggers p38 MAPK activation and TNFα release from primary CD14 + monocytes (A) Western blot analyses of CD14+ cell lysates before and after trypsin treatment (100 μg/mL); cells were stimulated with 5 μg/mL SIC +/− 2.5% plasma (P). Membranes were incubated with antibodies against p38 MAPK (p38) and phosphorylated p38 MAPK (p-p38). (B) Quantification of phosphorylation of Western blots of CD14+ monocytes treated with 100 μg/mL trypsin for 30 min. The band intensities of p-p38 samples were normalized to loading control (p38 band) and values analyzed. (C) CD14+ cells were pre-incubated with 100 μg/mL trypsin, and then incubated with 5 μg/mL by SIC +/− 2.5% plasma (P). Absorbance was measured by ELISA at 450 nm. (D) Western blot analyses of CD14+ cell lysates after stimulation with 5 μg/mL SIC +/− 2.5% plasma (P). Cells were pre-incubated with Pab-hTLR2 for 20 min. Membranes were incubated with antibodies against p38 MAPK (p38) and phosphorylated p38 MAPK (p-p38). (E) Quantification of phosphorylation of Western blots of CD14+ cells treated with a neutralizing antibody against TLR2. The band intensities of p-p38 samples were normalized to loading control (p38 band) and values analyzed. (F) CD14+ cells were pre-incubated with a neutralizing antibody against TLR2, and then incubated with 5 μg/mL SIC +/− 2.5% plasma (P). Release of TNF α was measured at 450 nm. All data represent mean ± SEM of 3-5 independent experiments, one-way ANOVA, Dunnett's multiple comparison test, with single pooled variance. ∗p < 0.05, ∗∗p < 0.01, ∗∗∗p < 0.001 ∗∗∗∗p < 0.0001.
Figure 8
Figure 8
An M55-SIC homolog shows no affinity for clusterin and HRG and does not activate THP1 cells (A) Lysates of THP1 cells incubated with 5 μg SIC/ml or DRS +/− 2.5% plasma (P) were subjected to SDS-PAGE analysis and Western blotting. Membranes were probed with antibodies against p38 MAPK (p38) and phosphorylated p38 MAPK (p-p38). (B) Band intensities of the Western blot in B were analyzed. (C) Release of TNFα from THP1 cells incubated with SIC or DRS in presence and absence of plasma (P). Absorbance detected at 450 nm. (D) Activation of NF-κB in cells incubated with 5 μg SIC/ml or DRS in presence and absence of 2.5% plasma (P). Absorbance was detected at 655 nm. All data represent mean ± SEM of 3-4 independent experiments, one-way ANOVA, Dunnett's multiple comparison test, with single pooled variance. ∗p < 0.05, ∗∗∗p < 0.001, ∗∗∗∗p < 0.0001.

Similar articles

Cited by

References

    1. Åkesson P., Schmidt K.H., Cooney J., Björck L. M1 protein and protein H: IgGFc- and albumin-binding streptococcal surface proteins encoded by adjacent genes. Biochem. J. 1994;300:877. doi: 10.1042/bj3000877. - DOI - PMC - PubMed
    1. Åkesson P., Herwald H., Rasmussen M., HÅkansson K., Abrahamson M., Hasan A.A.K., Schmaier A.H., Müller-Esterl W., Björck L. Streptococcal inhibitor of complement-mediated lysis (SIC): an anti-inflammatory virulence determinant. Microbiology. 2010;156:3660–3668. doi: 10.1099/mic.0.039578-0. - DOI - PMC - PubMed
    1. Åkesson P., Sjöholm A.G., Björck L. Protein SIC, a novel extracellular protein of Streptococcus pyogenes interfering with complement function. J. Biol. Chem. 1996;271:1081. doi: 10.1074/jbc.271.2.1081. - DOI - PubMed
    1. Van Amersfoort E.S., Kuiper J. Endotoxins: Pyrogens, LAL Testing and Depyrogenation. Third Edition. 2007. Receptors, mediators, and mechanisms involved in bacterial sepsis and septic shock. - PMC - PubMed
    1. Binks M.J., Fernie-King B.A., Seilly D.J., Lachmann P.J., Sriprakash K.S. Attribution of the various inhibitory actions of the Streptococcal Inhibitor of Complement (SIC) to regions within the molecule. J. Biol. Chem. 2005;280:20120. doi: 10.1074/jbc.M414194200. - DOI - PubMed

LinkOut - more resources