IV and oral fosfomycin pharmacokinetics in neonates with suspected clinical sepsis
- PMID: 33855449
- PMCID: PMC8212774
- DOI: 10.1093/jac/dkab083
IV and oral fosfomycin pharmacokinetics in neonates with suspected clinical sepsis
Abstract
Background: Fosfomycin has the potential to be re-purposed as part of a combination therapy to treat neonatal sepsis where resistance to current standard of care (SOC) is common. Limited data exist on neonatal fosfomycin pharmacokinetics and estimates of bioavailability and CSF/plasma ratio in this vulnerable population are lacking.
Objectives: To generate data informing the appropriate dosing of IV and oral fosfomycin in neonates using a population pharmacokinetic analysis of plasma and CSF data.
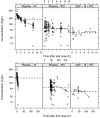
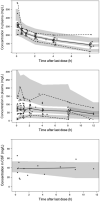
Methods: The NeoFosfo study (NCT03453177) was a randomized trial that examined the safety and pharmacokinetics of fosfomycin comparing SOC versus SOC plus fosfomycin. Sixty-one neonates received fosfomycin (100 mg/kg IV q12h for 48 h) and then they converted to oral therapy at the same dose. Two plasma pharmacokinetic samples were taken following the first IV and oral doses, sample times were randomized to cover the whole pharmacokinetic profile and opportunistic CSF pharmacokinetic samples were collected. A population pharmacokinetic model was developed in NONMEM and simulations were performed.
Results: In total, 238 plasma and 15 CSF concentrations were collected. A two-compartment disposition model, with an additional CSF compartment and first-order absorption, best described the data. Bioavailability was estimated as 0.48 (95% CI = 0.347-0.775) and the CSF/plasma ratio as 0.32 (95% CI = 0.272-0.409). Allometric weight and postmenstrual age (PMA) scaling was applied; additional covariates included postnatal age (PNA) on clearance and CSF protein on CSF/plasma ratio.
Conclusions: Through this analysis a population pharmacokinetic model has been developed that can be used alongside currently available pharmacodynamic targets to select a neonatal fosfomycin dose based on an infant's PMA, PNA and weight.
© The Author(s) 2021. Published by Oxford University Press on behalf of the British Society for Antimicrobial Chemotherapy.
Figures


References
-
- Laxminarayan R, Matsoso P, Pant S. et al. Access to effective antimicrobials: a worldwide challenge. Lancet 2016; 387: 168–75. - PubMed
-
- Hendlin D, Stapley EO, Jackson M. et al. Phosphonomycin, a new antibiotic produced by strains of streptomyces. Science 1969; 166: 122–3. - PubMed
-
- Li G, Standing JF, Bielicki J. et al. The potential role of fosfomycin in neonatal sepsis caused by multidrug-resistant bacteria. Drugs 2017; 77: 941–50. - PubMed
Publication types
MeSH terms
Substances
Associated data
Grants and funding
LinkOut - more resources
Full Text Sources
Other Literature Sources
Medical

