The DnaJ proteins DJA6 and DJA5 are essential for chloroplast iron-sulfur cluster biogenesis
- PMID: 33855718
- PMCID: PMC8246258
- DOI: 10.15252/embj.2020106742
The DnaJ proteins DJA6 and DJA5 are essential for chloroplast iron-sulfur cluster biogenesis
Abstract
Fe-S clusters are ancient, ubiquitous and highly essential prosthetic groups for numerous fundamental processes of life. The biogenesis of Fe-S clusters is a multistep process including iron acquisition, sulfur mobilization, and cluster formation. Extensive studies have provided deep insights into the mechanism of the latter two assembly steps. However, the mechanism of iron utilization during chloroplast Fe-S cluster biogenesis is still unknown. Here we identified two Arabidopsis DnaJ proteins, DJA6 and DJA5, that can bind iron through their conserved cysteine residues and facilitate iron incorporation into Fe-S clusters by interactions with the SUF (sulfur utilization factor) apparatus through their J domain. Loss of these two proteins causes severe defects in the accumulation of chloroplast Fe-S proteins, a dysfunction of photosynthesis, and a significant intracellular iron overload. Evolutionary analyses revealed that DJA6 and DJA5 are highly conserved in photosynthetic organisms ranging from cyanobacteria to higher plants and share a strong evolutionary relationship with SUFE1, SUFC, and SUFD throughout the green lineage. Thus, our work uncovers a conserved mechanism of iron utilization for chloroplast Fe-S cluster biogenesis.
Keywords: assembly; chloroplast; evolution; iron donor; iron-sulfur cluster.
© 2021 The Authors.
Conflict of interest statement
The authors declare that they have no conflict of interest.
Figures

- A
Phenotypes of WT, dja6, dja5, dja6 dja5, and RNAi seedlings on MS medium with 2% sucrose. Scale bars = 0.5 cm.
- B, C
Phenotypes and chlorophyll fluorescence images of 6‐week‐old WT, dja6 dja5 and complemented plants (B) on MS medium with 2% sucrose, scale bars = 0.5 cm; WT, dja6, dja5, and RNAi mutants (C) grown on soil, scale bars = 1 cm. Fluorescences in (B) and (C) were measured with the FluorCam700MF and visualized using a pseudocolor index as indicated on the right.
- D
Chlorophyll content of total leaves in 6‐week‐old WT, dja6, dja5, dja6 dja5, and RNAi seedlings. FW, fresh weight. Data are the means ± SEM (n = 7 biological replicates).
- E
The ultrastructure of plastids from WT, dja6, dja5, dja6 dja5, and RNAi mutants. T, thylakoids. Scale bars = 0.2 μm.
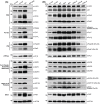
- A, B
Total protein was extracted from 4‐week‐old WT, dja6, dja5, dja6 dja5, and RNAi seedlings, respectively. WT and dja6 dja5 used in (A) were grown on MS medium with 2% sucrose, while WT, dja6, dja5, and RNAi mutants were used in (B) were grown on soil. 10 μg protein was loaded, except for detection with anti‐SUFE1 and anti‐SUFA antiserum, for which 25 μg was loaded. Specific bands were identified by immunoblotting and by their molecular weight, and are indicated by asterisks. Designations of photosynthetic protein complexes and their diagnostic components are labeled on the left and right, respectively. The Fe–S types of Fe–S proteins are shown in parentheses. Actin served as controls to normalize protein levels. For each protein, three independent biological replicates were performed and a representative one is shown.

- A–C
Metal concentrations in the WT, dja6 dja5, and RNAi mutants. Fe concentrations in total leaves (A and B) and total chloroplast (C) from 4‐week‐old WT, dja6 dja5, and RNAi mutants were quantified by inductively coupled plasma mass spectrometry and are shown as means ± SEM (n = 3 biological replicates) of μg g−1 dry weight (DW). WT and RNAi mutants used in (A and C) were grown on soil, while WT and dja6 dja5 seedlings used in (B) were grown on MS medium with 2% sucrose. Similar results were obtained in two additional independent biological experiments. Asterisks indicate significant differences from the value of WT (two‐sample Student’s t‐test; *P < 0.05; **P < 0.01; ***P < 0.001).
- D
Volcano plot of the result from quantitative transcriptome profiling in WT and dja6 dja5 mutant. Statistical analysis was performed using Student’s t‐test. Data on the X‐axis represent the Log2‐ratio of FC (fold change) between the absolute abundances of transcripts identified from dja6 dja5 against WT. The Y‐axis represents the Log10 of FDR (false discovery rate). All DEGs (differentially expressed genes) with FDR < 0.01 and FC > 2 are marked in gray, while all iron‐related DEGs with FDR < 0.01 and FC > 2 are marked in red. The iron‐related DEGs labeled with red dots within the black boxes are referred to in the text. All data are based on three biological replicates.
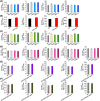
- A–F
Metal concentrations in total leaves (A, B, and E), total chloroplasts (C and F), and total mitochondria (D) from 4‐week‐old WT, dja6 dja5, RNAi mutants, and 35Spro:SynDJA6‐FLAG/dja6 dja5 #24 transgenic plants were quantified by inductively coupled plasma mass spectrometry and are shown as means ± SEM (n = 3 biological replicates) of μg g−1 dry weight (DW). WT, RNAi mutants, and SynDJA6‐FLAG/dja6 dja5 #24 transgenic plants used in (A, C, D, E, and F) were grown on soil, while WT and dja6 dja5 seedlings used in (B) were grown on MS medium with 2% sucrose. Similar results were obtained in two additional independent biological experiments. Asterisks indicate significant differences from the value of WT (two‐sample Student’s t‐test; *P < 0.05).
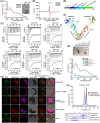
UV‐visible absorption spectra of recombinant DJA6 and DJA5. Recombinant DJA6 after elution from Ni‐NTA Sepharose beads followed by concentration is shown on the right.
Electron paramagnetic resonance spectra of recombinant DJAs. The observed resonance is marked for the g value.
Analysis of the ferrous iron‐binding activity of DJA6. Isothermal titration calorimetry measurements of ferrous iron binding to apo DJA6 were carried out on a MicroCal iTC200. Fe2+ was titrated into a solution of 50 μM DJA6 or DJA6 variants. For the background titrations, the ferrous iron was titrated into the corresponding buffer.
DJA6 can bind Fe2+ in chloroplast. Arabidopsis mesophyll protoplasts were transformed with plasmids that express the indicated gene constructs, respectively. The untransformed protoplasts and protoplasts transformed with non‐fused EBFP proteins were used as controls. The protoplasts were further stained by FeRhoNox™‐1 (red) to visualize the cellular distribution of Fe2+. Green, EBFP fluorescence signals; magenta, chloroplast autofluorescence signals; yellow, regions where the EBFP and FeRhoNox™‐1 fluorescence signals merged. The speckles which DJA6‐EBFP co‐localizes with FeRhoNox™‐1 are indicated by white arrows. Scale bars = 5 μm.
Diagram of the domain structure of DJA6. Gray, TP (chloroplast transit peptide); blue, J domain; steel blue, GR domain; cyan, CR domain; green, C‐terminal domain.
Ribbon representation of the quaternary structural model of mature dimeric DJA6 prepared with PyMOL (Lam & Siu, 2017). The α subunit and α’ subunit of DJA6 dimer are colored blue‐to‐green and green‐to‐red, respectively. The relative orientations of the domains differ in the two monomers in the asymmetric unit.
UV‐visible absorption spectra of recombinant DJA6 and DJA6 truncated peptides. Recombinant DJA6 and DJA6 truncated peptides after elution from Ni‐NTA Sepharose beads followed by concentration are shown above.
Size‐exclusion profiles for apo and iron‐loaded forms of DJA6. 1 mM EDTA, purified DJA6 after incubated with EDTA at a final concentration of 1 mM; 20 μM, or 100 μM ferrous, apo‐DJA6 after incubated with Fe(NH4)2(SO4)2 at a final concentration of 20 μM or 100 μM, respectively. Positions of theoretical tetramer and dimer are indicated by dotted lines. Images of the Coomassie Brilliant Blue‐stained gel after SEC elution are shown.
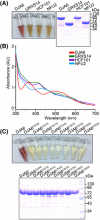
Purified MBP‐His‐tagged DJA6 is red‐colored; and purified MBP‐His‐tagged GRXS14, HCF101, and NFU2 are brown‐colored. Tricine‐PAGE analysis of recombinant DJA6 and Fe–S proteins is shown on the right.
UV‐visible absorption spectra of purified MBP‐His‐tagged mature DJA6, GRXS14, HCF101, and NFU2. Recombinant DJA6 has a main peak at 365 nm. Recombinant GRXS14, HCF101, and NFU2 have a main peak at 420 nm, respectively.
Image and Tricine‐PAGE analysis of purified MBP‐His‐tagged DJA6 and DJA6 variants after elution from Ni‐NTA Sepharose beads.

- A–C
Isothermal titration calorimetry measurements of ferric iron, ferrous iron, or zinc ion binding to apo DJA6 were carried out on a MicroCal iTC200. Fe3+, Fe2+, or Zn2+ was titrated into a solution of 50 μM DJA6 or DJA6 variants. For the background titrations, the corresponding metal ion was titrated into the buffer, respectively. K d, dissociation constant.
- A
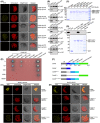
BiFC analyses for the interactions between DJA6 and SUFE1 or SUFC in Arabidopsis mesophyll protoplasts. Yellow, YFP fluorescence signals; red, chloroplast autofluorescence signals. Scale bars = 10 μm.
- B
Co‐IP assays for the interactions of DJA6 with SUFE1 and SUFC. Total protein extracts of protoplasts co‐transfected with designated constructs were subjected to immunoprecipitation and then analyzed by immunoblotting with antibodies indicated on the right. Input (left lane) indicates that 100 μg total protein was loaded on the gel.
- C
Pull‐down assays of the interactions between DJA6 and chloroplast SUF components. GST‐tagged mature DJA6 was used as the bait, MBP‐tagged mature NFS2, SUFE1, SUFB, SUFC, SUFD, and MBP were used as the prey. The recombinant proteins were incubated with glutathione‐agarose beads, and the bound proteins were eluted and analyzed by staining.
- D
Pull‐down assay of the interactions between SUFC and apo‐ or iron‐bound form of DJA6. GST‐tagged mature iron‐bound or apo‐DJA6 was used as the bait, MBP and MBP‐tagged mature SUFC were used as the prey. The bound proteins were eluted and analyzed by staining and immunoblotting.
- E
Yeast two‐hybrid analyses of the interactions between DJA6 and chloroplast SUF components. Positive control, the interaction between murine p53 fused with GAL4 BD and SV40 large T‐antigen fused with GAL4 AD; negative control, the co‐expression of Human Lamin C fused with GAL4 BD and SV40 large T‐antigen fused with GAL4 AD. The dilution ratios are indicated on the left.
- F
Schematic diagram of DJA6 with five different constructs: gray, TP (chloroplast transit peptide, residues 1–85); blue, J domain (residues 86–147); steel blue, GR domain (residues 148–223); cyan, CR domain (residues 224–287); green, C‐terminal domain (residues 288–442). The different truncations of DJA6 are shown in detail below.
- G, H
BiFC analyses for the interactions between truncated forms of DJA6 and SUFE1 or SUFC in Arabidopsis mesophyll protoplasts. Scale bars = 10 μm.

10% SDS–PAGE analysis of recombinant proteins used in the in vitro Fe–S cluster assembly assay.
Size‐exclusion profiles of the recombinant SUFBC2D complex.
Images of the Coomassie Brilliant Blue‐stained gel after SEC elution in (B).
Boxplot of the absorbance of the re‐purified SUFBC2D complex at 280 nm from the in vitro Fe–S cluster assembly assays shown in (Fig 6A–L). For each reaction, the absorbance was monitored at the indicated time points and is marked with colored shapes. Black dot, 0 min; blue triangle, 10 min; brown rhombus, 20 min; cyan box, 30 min; green triangle, 40 min; magenta hexagon, 50 min. A representative result is shown, and similar results were obtained in two additional independent biological experiments.

- A–L
Only buffer (A), ferric iron (B), ferrous iron (C), ferrous iron‐loaded DJA6 (D), DJA6J deletion (H), DJA6C224S (I), DJA6C241S (J), DJA6C267S (K), or DJA6C280S (L) was added to the reaction mixture (SUFBC2D complex, NFS2, SUFE1, MgCl2, NADPH and ATP). DMSO was added to the reaction mixture as a control to the iron chelator deferiprone (DFP) treatment (E). The reaction mixture containing ferrous iron‐loaded DJA6 was treated with the iron chelator DFP (F). The reaction mixture containing ferrous iron was treated with the iron chelator DFP (G). UV‐visible absorption spectra of the re‐purified SUFBC2D complex from the reaction mixture were taken every 10 min for 50 min under anaerobic condition after addition of L‐cysteine to initiate the reaction. A peak at 420 nm represents the iron–sulfur cluster in SUFBC2D complex. All data were based on three biological replicates, and similar results were observed.

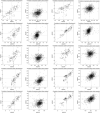
Evaluation of the evolutionary relationships using the Tol‐MirrorTree analyses. Pairwise genetic distances (GD) among designated proteins in representative photosynthetic organisms (Dataset EV2) are indicated by green spots. R, Pearson correlation coefficient; P, significant differences between the Maximum Likelihood trees (one‐sided t‐test).
UV‐visible absorption spectra of purified AtDJA6 and SynDJA6. Recombinant SynDJA6 after elution from Ni‐NTA Sepharose beads followed by concentration is shown on the right.
Phenotypes and chlorophyll fluorescence images of 6‐week‐old WT and 35Spro:SynDJA6‐FLAG/dja6 dja5 transgenic plants grown on soil. Scale bars = 1 cm.
Expression of FLAG‐tagged SynDJA6 in 35Spro:SynDJA6‐FLAG/dja6 dja5 transgenic plants. Total leaf extracts (100 μg proteins) from WT and transgenic seedlings were loaded. FLAG‐tagged SynDJA6 is indicated by asterisk.

Similar articles
-
Iron-sulfur cluster biogenesis in chloroplasts. Involvement of the scaffold protein CpIscA.Plant Physiol. 2005 May;138(1):161-72. doi: 10.1104/pp.104.058602. Plant Physiol. 2005. PMID: 15888686 Free PMC article.
-
Expression of a dominant-negative AtNEET-H89C protein disrupts iron-sulfur metabolism and iron homeostasis in Arabidopsis.Plant J. 2020 Mar;101(5):1152-1169. doi: 10.1111/tpj.14581. Epub 2019 Dec 9. Plant J. 2020. PMID: 31642128
-
Hsp90 and metal-binding J-protein family chaperones are not critically involved in cellular iron-sulfur protein assembly and iron regulation in yeast.FEBS Lett. 2023 Jul;597(13):1718-1732. doi: 10.1002/1873-3468.14612. Epub 2023 Mar 30. FEBS Lett. 2023. PMID: 36932975
-
Iron-sulfur cluster biosynthesis in photosynthetic organisms.Photosynth Res. 2005 Dec;86(3):391-407. doi: 10.1007/s11120-005-5913-2. Epub 2005 Nov 12. Photosynth Res. 2005. PMID: 16328784 Review.
-
CpNifS-dependent iron-sulfur cluster biogenesis in chloroplasts.New Phytol. 2006;171(2):285-92. doi: 10.1111/j.1469-8137.2006.01751.x. New Phytol. 2006. PMID: 16866936 Review.
Cited by
-
Research Progress in J-Proteins in the Chloroplast.Genes (Basel). 2022 Aug 17;13(8):1469. doi: 10.3390/genes13081469. Genes (Basel). 2022. PMID: 36011380 Free PMC article. Review.
-
A proteostasis network safeguards the chloroplast proteome.Essays Biochem. 2022 Aug 5;66(2):219-228. doi: 10.1042/EBC20210058. Essays Biochem. 2022. PMID: 35670042 Free PMC article. Review.
-
ORANGE family proteins: multifunctional chaperones shaping plant carotenoid level, plastid development, stress tolerance, and more.Mol Hortic. 2025 May 9;5(1):43. doi: 10.1186/s43897-025-00169-9. Mol Hortic. 2025. PMID: 40341160 Free PMC article. Review.
-
ATH434, a promising iron-targeting compound for treating iron regulation disorders.Metallomics. 2024 Oct 4;16(10):mfae044. doi: 10.1093/mtomcs/mfae044. Metallomics. 2024. PMID: 39317669 Free PMC article.
-
Iron in leaves: chemical forms, signalling, and in-cell distribution.J Exp Bot. 2022 Mar 15;73(6):1717-1734. doi: 10.1093/jxb/erac030. J Exp Bot. 2022. PMID: 35104334 Free PMC article. Review.
References
-
- Arantes GM, Bhattacharjee A, Field MJ (2013) Homolytic cleavage of Fe–S bonds in rubredoxin under mechanical stress. Angew Chem Int Ed Engl 52: 8144–8146 - PubMed
-
- Arosio P, Carmona F, Gozzelino R, Maccarinelli F, Poli M (2015) The importance of eukaryotic ferritins in iron handling and cytoprotection. Biochem J 472: 1–15 - PubMed
-
- Balk J, Lobréaux S (2005) Biogenesis of iron‐sulfur proteins in plants. Trends Plant Sci 10: 324–331 - PubMed
Publication types
MeSH terms
Substances
LinkOut - more resources
Full Text Sources
Other Literature Sources
Medical
Molecular Biology Databases
Miscellaneous

