

Proteogenomic Workflow Reveals Molecular Phenotypes Related to Breast Cancer Mammographic Appearance
- PMID: 33855848
- PMCID: PMC8155562
- DOI: 10.1021/acs.jproteome.1c00243
Proteogenomic Workflow Reveals Molecular Phenotypes Related to Breast Cancer Mammographic Appearance
Abstract
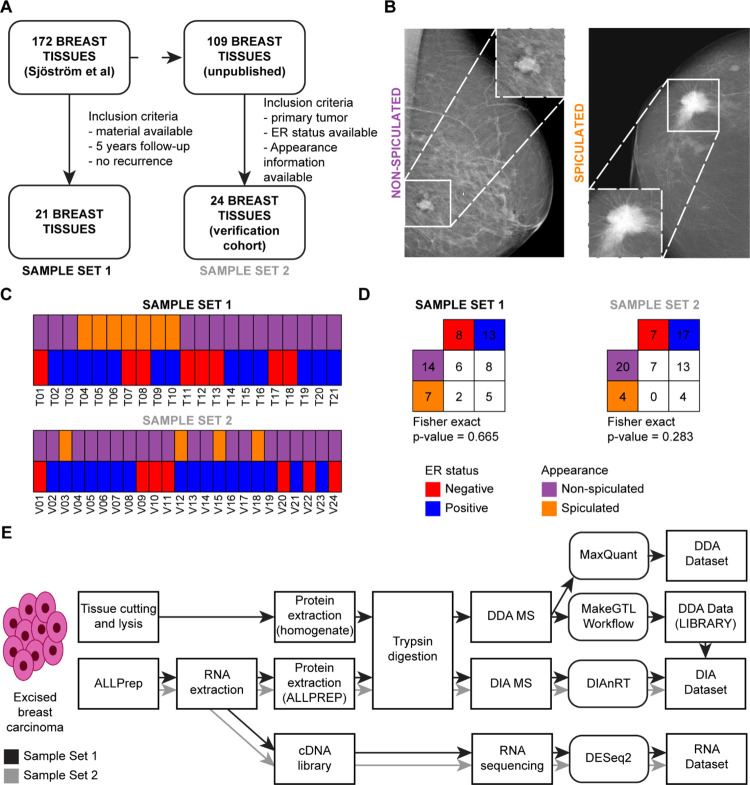
Proteogenomic approaches have enabled the generat̲ion of novel information levels when compared to single omics studies although burdened by extensive experimental efforts. Here, we improved a data-independent acquisition mass spectrometry proteogenomic workflow to reveal distinct molecular features related to mammographic appearances in breast cancer. Our results reveal splicing processes detectable at the protein level and highlight quantitation and pathway complementarity between RNA and protein data. Furthermore, we confirm previously detected enrichments of molecular pathways associated with estrogen receptor-dependent activity and provide novel evidence of epithelial-to-mesenchymal activity in mammography-detected spiculated tumors. Several transcript-protein pairs displayed radically different abundances depending on the overall clinical properties of the tumor. These results demonstrate that there are differentially regulated protein networks in clinically relevant tumor subgroups, which in turn alter both cancer biology and the abundance of biomarker candidates and drug targets.
Keywords: breast cancer; data-independent acquisition; proteogenomics; proteomics; transcriptomics.
Conflict of interest statement
The authors declare no competing financial interest.
Figures


Similar articles
-
Extracting Pathway-level Signatures from Proteogenomic Data in Breast Cancer Using Independent Component Analysis.Mol Cell Proteomics. 2019 Aug 9;18(8 suppl 1):S169-S182. doi: 10.1074/mcp.TIR119.001442. Epub 2019 Jun 18. Mol Cell Proteomics. 2019. PMID: 31213479 Free PMC article.
-
Using tumor phenotype, histological tumor distribution, and mammographic appearance to explain the survival differences between screen-detected and clinically detected breast cancers.APMIS. 2014 Aug;122(8):699-707. doi: 10.1111/apm.12294. APMIS. 2014. PMID: 25046200 Review.
-
"Association of mammographic features with molecular breast tumor profiles".Cancer Treat Res Commun. 2021;28:100387. doi: 10.1016/j.ctarc.2021.100387. Epub 2021 May 9. Cancer Treat Res Commun. 2021. PMID: 34004506
-
Credentialing Individual Samples for Proteogenomic Analysis.Mol Cell Proteomics. 2018 Aug;17(8):1515-1530. doi: 10.1074/mcp.RA118.000645. Epub 2018 May 1. Mol Cell Proteomics. 2018. PMID: 29716986 Free PMC article.
-
Proteogenomic studies on cancer drug resistance: towards biomarker discovery and target identification.Expert Rev Proteomics. 2017 Apr;14(4):351-362. doi: 10.1080/14789450.2017.1299006. Epub 2017 Mar 6. Expert Rev Proteomics. 2017. PMID: 28276747 Review.
Cited by
-
Interpreting biologically informed neural networks for enhanced proteomic biomarker discovery and pathway analysis.Nat Commun. 2023 Sep 2;14(1):5359. doi: 10.1038/s41467-023-41146-4. Nat Commun. 2023. PMID: 37660105 Free PMC article.
-
Generalized precursor prediction boosts identification rates and accuracy in mass spectrometry based proteomics.Commun Biol. 2023 Jun 10;6(1):628. doi: 10.1038/s42003-023-04977-x. Commun Biol. 2023. PMID: 37301900 Free PMC article.
-
Integrated View of Baseline Protein Expression in Human Tissues Using Public Data Independent Acquisition Data Sets.J Proteome Res. 2025 Feb 7;24(2):685-695. doi: 10.1021/acs.jproteome.4c00788. Epub 2025 Jan 7. J Proteome Res. 2025. PMID: 39764611 Free PMC article.
-
MammOnc-DB, an integrative breast cancer data analysis platform for target discovery.NPJ Breast Cancer. 2025 Apr 18;11(1):35. doi: 10.1038/s41523-025-00750-x. NPJ Breast Cancer. 2025. PMID: 40251157 Free PMC article.
-
Identification of Novel Genes and Proteoforms in Angiostrongylus costaricensis through a Proteogenomic Approach.Pathogens. 2022 Oct 31;11(11):1273. doi: 10.3390/pathogens11111273. Pathogens. 2022. PMID: 36365024 Free PMC article.
References
-
- Fachal L.; Aschard H.; Beesley J.; Barnes D. R.; Allen J.; Kar S.; Pooley K. A.; Dennis J.; Michailidou K.; Turman C.; Soucy P.; Lemaçon A.; Lush M.; Tyrer J. P.; Ghoussaini M.; Marjaneh M. M.; Jiang X.; Agata S.; Aittomäki K.; Alonso M. R.; Andrulis I. L.; Anton-Culver H.; Antonenkova N. N.; Arason A.; Arndt V.; Aronson K. J.; Arun B. K.; Auber B.; Auer P. L.; Azzollini J.; Balmaña J.; Barkardottir R. B.; Barrowdale D.; Beeghly-Fadiel A.; Benitez J.; Bermisheva M.; Białkowska K.; Blanco A. M.; Blomqvist C.; Blot W.; Bogdanova N. V.; Bojesen S. E.; Bolla M. K.; Bonanni B.; Borg A.; Bosse K.; Brauch H.; Brenner H.; Briceno I.; Brock I. W.; Brooks-Wilson A.; Brüning T.; Burwinkel B.; Buys S. S.; Cai Q.; Caldés T.; Caligo M. A.; Camp N. J.; Campbell I.; Canzian F.; Carroll J. S.; Carter B. D.; Castelao J. E.; Chiquette J.; Christiansen H.; Chung W. K.; Claes K. B. M.; Clarke C. L.; Collée J. M.; Cornelissen S.; Couch F. J.; Cox A.; Cross S. S.; Cybulski C.; Czene K.; Daly M. B.; de la Hoya M.; Devilee P.; Diez O.; Ding Y. C.; Dite G. S.; Domchek S. M.; Dörk T.; Dos-Santos-Silva I.; Droit A.; Dubois S.; Dumont M.; Duran M.; Durcan L.; Dwek M.; Eccles D. M.; Engel C.; Eriksson M.; Evans D. G.; Fasching P. A.; Fletcher O.; Floris G.; Flyger H.; Foretova L.; Foulkes W. D.; Friedman E.; Fritschi L.; Frost D.; Gabrielson M.; Gago-Dominguez M.; Gambino G.; Ganz P. A.; Gapstur S. M.; Garber J.; García-Sáenz J. A.; Gaudet M. M.; Georgoulias V.; Giles G. G.; Glendon G.; Godwin A. K.; Goldberg M. S.; Goldgar D. E.; González-Neira A.; Tibiletti M. G.; Greene M. H.; Grip M.; Gronwald J.; Grundy A.; Guénel P.; Hahnen E.; Haiman C. A.; Håkansson N.; Hall P.; Hamann U.; Harrington P. A.; Hartikainen J. M.; Hartman M.; He W.; Healey C. S.; Heemskerk-Gerritsen B. A. M.; Heyworth J.; Hillemanns P.; Hogervorst F. B. L.; Hollestelle A.; Hooning M. J.; Hopper J. L.; Howell A.; Huang G.; Hulick P. J.; Imyanitov E. N.; Isaacs C.; Iwasaki M.; Jager A.; Jakimovska M.; Jakubowska A.; James P. A.; Janavicius R.; Jankowitz R. C.; John E. M.; Johnson N.; Jones M. E.; Jukkola-Vuorinen A.; Jung A.; Kaaks R.; Kang D.; Kapoor P. M.; Karlan B. Y.; Keeman R.; Kerin M. J.; Khusnutdinova E.; Kiiski J. I.; Kirk J.; Kitahara C. M.; Ko Y.-D.; Konstantopoulou I.; Kosma V.-M.; Koutros S.; Kubelka-Sabit K.; Kwong A.; Kyriacou K.; Laitman Y.; Lambrechts D.; Lee E.; Leslie G.; Lester J.; Lesueur F.; Lindblom A.; Lo W.-Y.; Long J.; Lophatananon A.; Loud J. T.; Lubiński J.; MacInnis R. J.; Maishman T.; Makalic E.; Mannermaa A.; Manoochehri M.; Manoukian S.; Margolin S.; Martinez M. E.; Matsuo K.; Maurer T.; Mavroudis D.; Mayes R.; McGuffog L.; McLean C.; Mebirouk N.; Meindl A.; Miller A.; Miller N.; Montagna M.; Moreno F.; Muir K.; Mulligan A. M.; Muñoz-Garzon V. M.; Muranen T. A.; Narod S. A.; Nassir R.; Nathanson K. L.; Neuhausen S. L.; Nevanlinna H.; Neven P.; Nielsen F. C.; Nikitina-Zake L.; Norman A.; Offit K.; Olah E.; Olopade O. I.; Olsson H.; Orr N.; Osorio A.; Pankratz V. S.; Papp J.; Park S. K.; Park-Simon T.-W.; Parsons M. T.; Paul J.; Pedersen I. S.; Peissel B.; Peshkin B.; Peterlongo P.; Peto J.; Plaseska-Karanfilska D.; Prajzendanc K.; Prentice R.; Presneau N.; Prokofyeva D.; Pujana M. A.; Pylkäs K.; Radice P.; Ramus S. J.; Rantala J.; Rau-Murthy R.; Rennert G.; Risch H. A.; Robson M.; Romero A.; Rossing M.; Saloustros E.; Sánchez-Herrero E.; Sandler D. P.; Santamariña M.; Saunders C.; Sawyer E. J.; Scheuner M. T.; Schmidt D. F.; Schmutzler R. K.; Schneeweiss A.; Schoemaker M. J.; Schöttker B.; Schürmann P.; Scott C.; Scott R. J.; Senter L.; Seynaeve C. M.; Shah M.; Sharma P.; Shen C.-Y.; Shu X.-O.; Singer C. F.; Slavin T. P.; Smichkoska S.; Southey M. C.; Spinelli J. J.; Spurdle A. B.; Stone J.; Stoppa-Lyonnet D.; Sutter C.; Swerdlow A. J.; Tamimi R. M.; Tan Y. Y.; Tapper W. J.; Taylor J. A.; Teixeira M. R.; Tengström M.; Teo S. H.; Terry M. B.; Teulé A.; Thomassen M.; Thull D. L.; Tischkowitz M.; Toland A. E.; Tollenaar R. A. E. M.; Tomlinson I.; Torres D.; Torres-Mejía G.; Troester M. A.; Truong T.; Tung N.; Tzardi M.; Ulmer H.-U.; Vachon C. M.; van Asperen C. J.; van der Kolk L. E.; van Rensburg E. J.; Vega A.; Viel A.; Vijai J.; Vogel M. J.; Wang Q.; Wappenschmidt B.; Weinberg C. R.; Weitzel J. N.; Wendt C.; Wildiers H.; Winqvist R.; Wolk A.; Wu A. H.; Yannoukakos D.; Zhang Y.; Zheng W.; Hunter D.; Pharoah P. D. P.; Chang-Claude J.; García-Closas M.; Schmidt M. K.; Milne R. L.; Kristensen V. N.; French J. D.; Edwards S. L.; Antoniou A. C.; Chenevix-Trench G.; Simard J.; Easton D. F.; Kraft P.; Dunning A. M. Fine-Mapping of 150 Breast Cancer Risk Regions Identifies 191 Likely Target Genes. Nat. Genet. 2020, 52, 56–73. 10.1038/s41588-019-0537-1. - DOI - PMC - PubMed
-
- Perou C. M.; Sørlie T.; Eisen M. B.; van de Rijn M.; Jeffrey S. S.; Rees C. a.; Pollack J. R.; Ross D. T.; Johnsen H.; Akslen L. A.; Fluge O.; Pergamenschikov A.; Williams C.; Zhu S. X.; Lønning P. E.; Børresen-Dale A. L.; Brown P. O.; Botstein D. Molecular Portraits of Human Breast Tumours. Nature 2000, 406, 747–752. 10.1038/35021093. - DOI - PubMed
-
- Coates A. S.; Winer E. P.; Goldhirsch A.; Gelber R. D.; Gnant M.; Piccart-Gebhart M.; Thürlimann B.; Senn H.-J. Panel Members. Tailoring Therapies--Improving the Management of Early Breast Cancer: St Gallen International Expert Consensus on the Primary Therapy of Early Breast Cancer 2015. Ann. Oncol. Off. J. Eur. Soc. Med. Oncol. 2015, 26, 1533–1546. 10.1093/annonc/mdv221. - DOI - PMC - PubMed
Publication types
MeSH terms
LinkOut - more resources
Full Text Sources
Other Literature Sources
Medical
Molecular Biology Databases
