

Identification of Key Genes and Pathways in Osteoarthritis via Bioinformatic Tools: An Updated Analysis
- PMID: 33855867
- PMCID: PMC8808887
- DOI: 10.1177/19476035211008975
Identification of Key Genes and Pathways in Osteoarthritis via Bioinformatic Tools: An Updated Analysis
Abstract
Objective: Osteoarthritis (OA) is a severe and common degenerative disease; however, the exact pathology of OA is undefined. Our study is designed to investigate the underlying molecular mechanism of OA with bioinformatic tools.
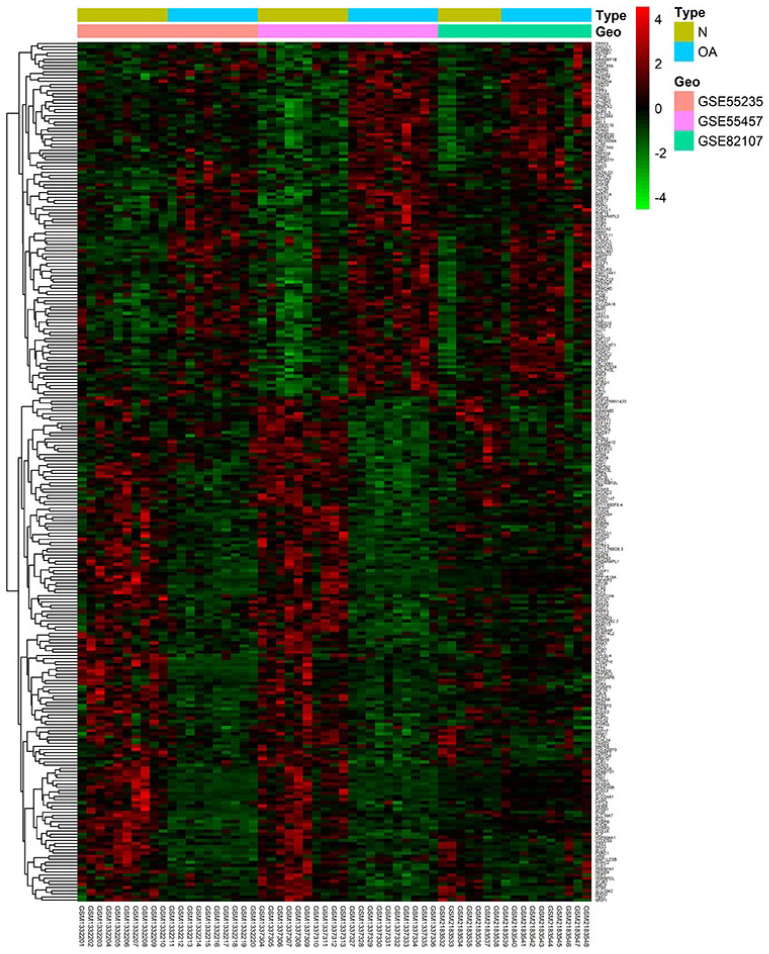
Design: Three updated GEO datasets: GSE55235, GSE55457, and GSE82107 were selected for data analyzing. R software was utilized to screen and confirm the candidate differentially expressed genes in the development of OA. Gene Ontology (GO) and Kyoto Encyclopedia of Genes and Genomes pathway were performed to identify the enriched GO terms and signaling pathways. Protein and protein interaction (PPI) models were built to observe the connected relationship among each potential protein.
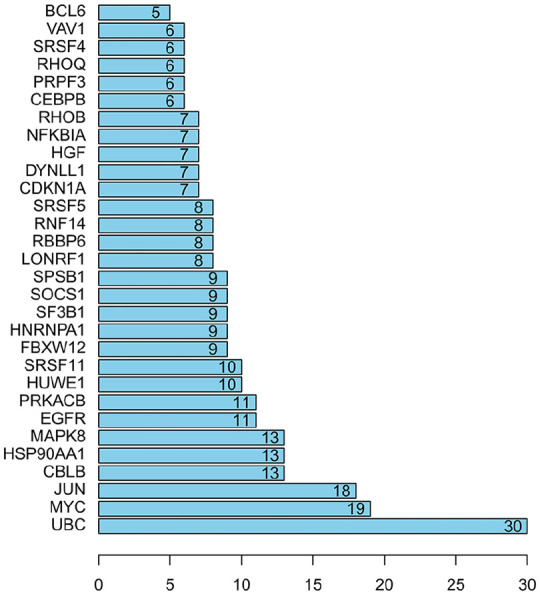
Results: A total of 113 upregulated genes and 161 downregulated genes were found by integrating 3 datasets. GO enrichment indicated that cell differentiation, cellular response to starvation, and negative regulation of phosphorylation were important biological processes. KEGG enrichment indicated that FoxO, IL-17 signaling pathways, and osteoclast differentiation mainly participated in the progression of OA. Combining the molecular function and PPI results, ubiquitylation was identified as a pivotal bioactive reaction involved in OA.
Conclusion: Our study provided updated candidate genes and pathways of OA, which may benefit further research and treatment for OA.
Keywords: bioinformatics; candidate genes; enrichment analysis; osteoarthritis; protein and protein interaction.
Conflict of interest statement
Figures


References
-
- Zhao X, Shah D, Gandhi K, Wei W, Dwibedi N, Webster L, et al. Clinical, humanistic, and economic burden of osteoarthritis among noninstitutionalized adults in the United States. Osteoarthritis Cartilage. 2019;27(11):1618-26. - PubMed
-
- Hunter DJ, Bierma-Zeinstra S. Osteoarthritis. Lancet. 2019;393(10182):1745-59. - PubMed
-
- Emery CA, Whittaker JL, Mahmoudian A, Lohmander LS, Roos EM, Bennell KL, et al. Establishing outcome measures in early knee osteoarthritis. Nat Rev Rheumatol. 2019;15(7):438-48. - PubMed
Publication types
MeSH terms
LinkOut - more resources
Full Text Sources
Other Literature Sources
Medical
