. 2021 Apr 15;131(8):e139434.
doi: 10.1172/JCI139434.

TYRO3 induces anti-PD-1/PD-L1 therapy resistance by limiting innate immunity and tumoral ferroptosis

Affiliations

TYRO3 induces anti-PD-1/PD-L1 therapy resistance by limiting innate immunity and tumoral ferroptosis

Zhou Jiang et al. J Clin Invest. .

Abstract

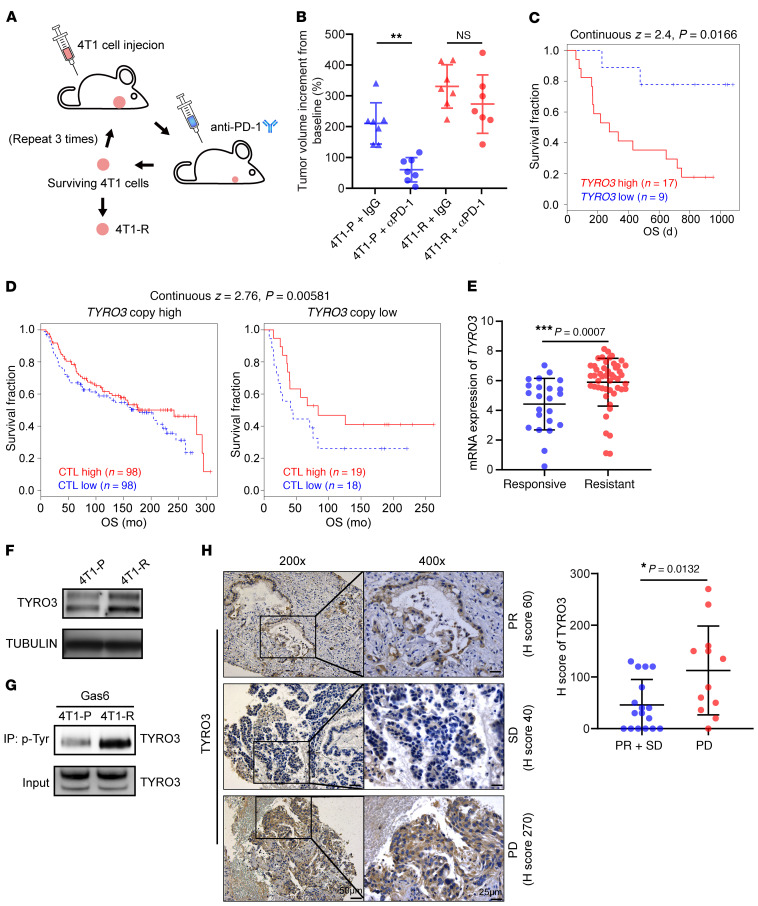
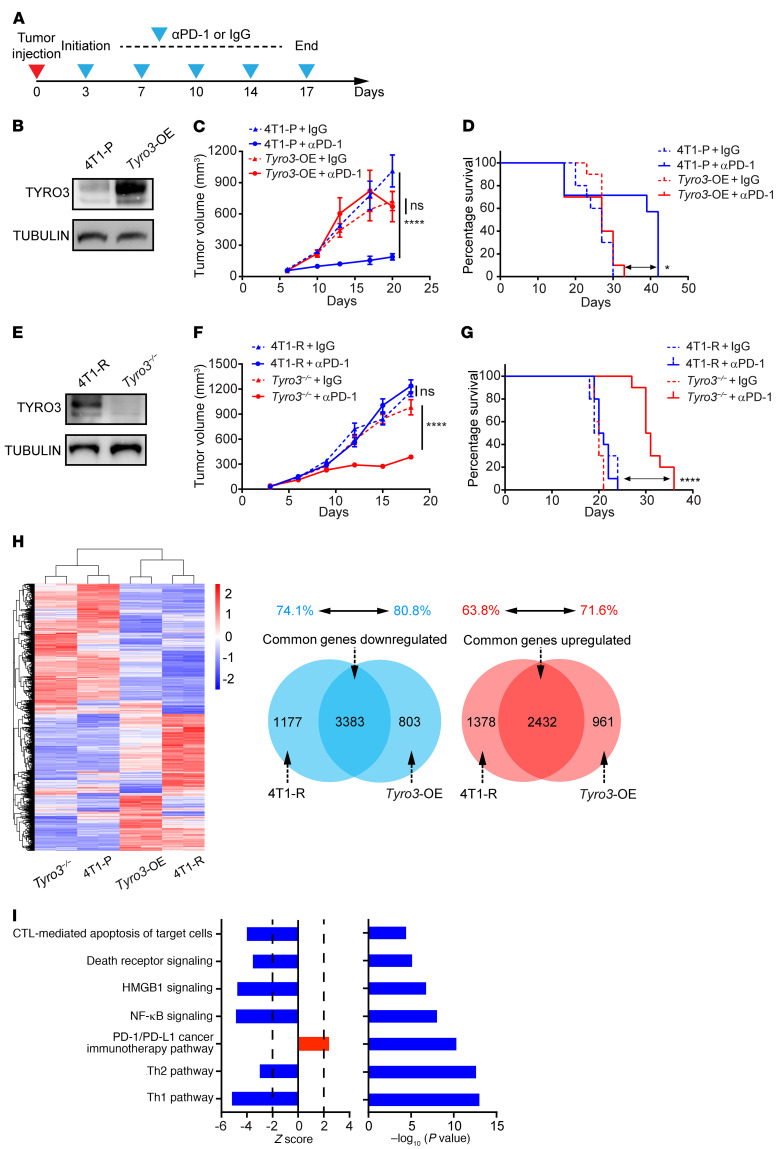
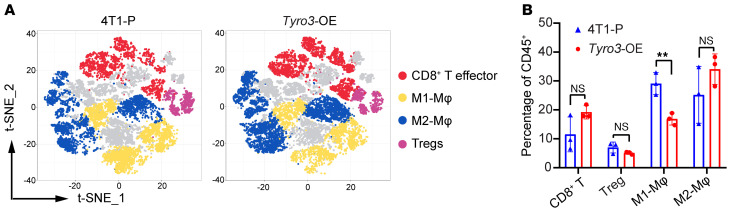
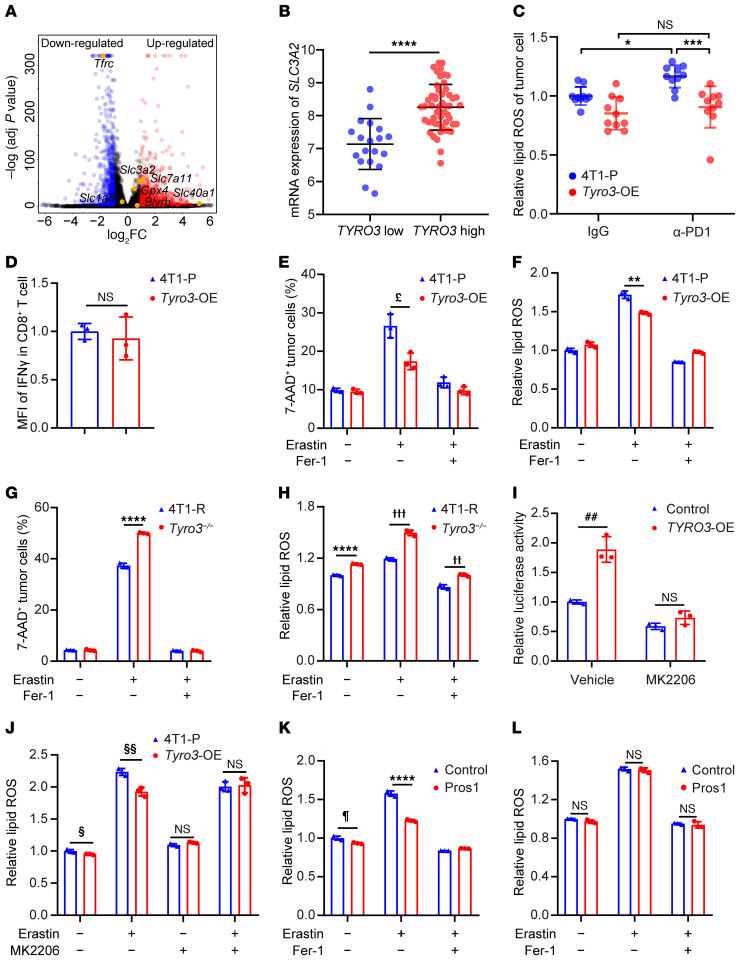
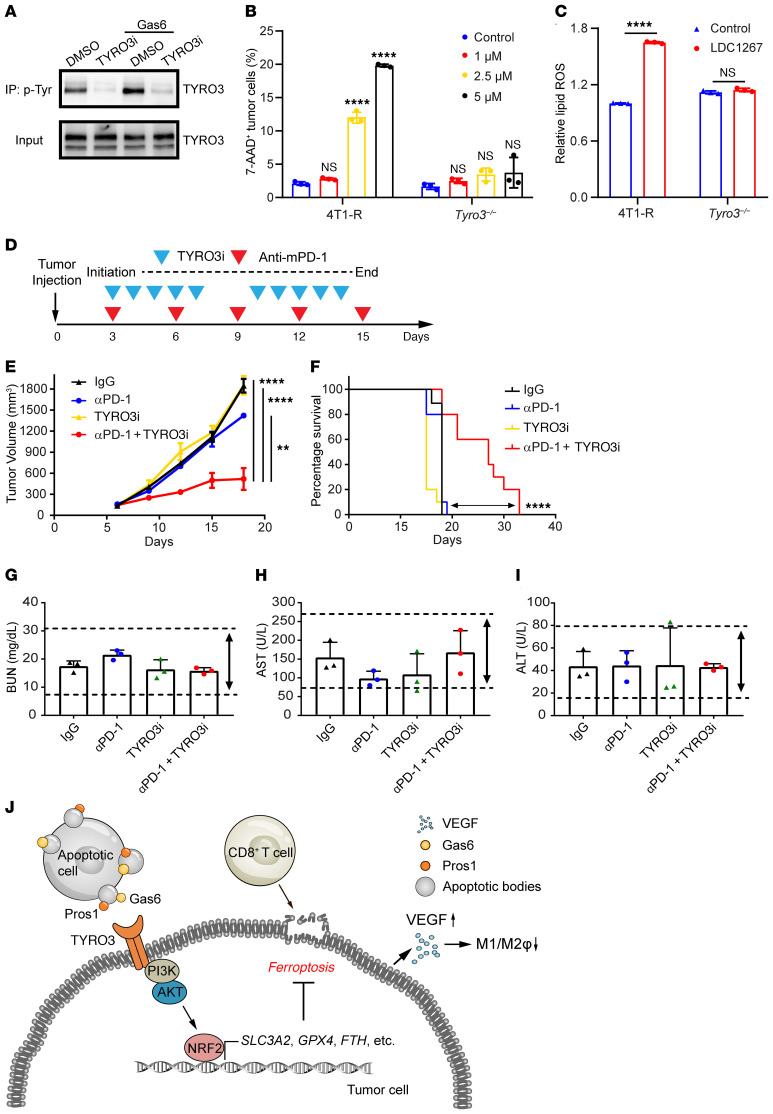
Immune checkpoint blockade therapy has demonstrated promising clinical outcomes for multiple cancer types. However, the emergence of resistance as well as inadequate biomarkers for patient stratification have largely limited the clinical benefits. Here, we showed that tumors with high TYRO3 expression exhibited anti-programmed cell death protein 1/programmed death ligand 1 (anti-PD-1/PD-L1) resistance in a syngeneic mouse model and in patients who received anti-PD-1/PD-L1 therapy. Mechanistically, TYRO3 inhibited tumor cell ferroptosis triggered by anti-PD-1/PD-L1 and facilitated the development of a protumor microenvironment by reducing the M1/M2 macrophage ratio, resulting in resistance to anti-PD-1/PD-L1 therapy. Inhibition of TYRO3 promoted tumor ferroptosis and sensitized resistant tumors to anti-PD-1 therapy. Collectively, our findings suggest that TYRO3 could serve as a predictive biomarker for patient selection and a promising therapeutic target to overcome anti-PD-1/PD-L1 resistance.

Keywords: Cancer; Cancer immunotherapy; Cell Biology; Immunotherapy; Oncology.


Conflict of interest statement

Conflict of interest: The authors have declared that no conflict of interest exists.

Figures

Figure 1
Figure 1. High TYRO3 expression correlates with a poor prognosis for patients receiving anti–PD-1/PD-L1 therapy.
(A) Schematic illustrating the establishment of mouse anti–PD-1–resistant cells. (B) Dot plot showing the change in tumor volume compared with baseline in 4T1-P- and 4T1-R tumor–bearing mice treated with anti–PD-1 (αPD-1) or IgG. n = 7 for each group. **P = 0.002 and NS P = 0.44, by 1-way ANOVA. (C) Overall survival (OS) of patients with melanoma with high and low TYRO3 mRNA expression who received anti–PD-1 antibody therapy. Continuous z = 2.4; P = 0.0166, by 2-sided Wald test. (D) Relationship between overall survival and CTL levels in patients with breast cancer with high and low TYRO3 gene copy numbers. Continuous z = 2.76; P = 0.00581. (E) mRNA expression of TYRO3 in patients with melanoma before and during anti–PD-1 therapy (n = 23 responsive patients; n = 48 resistant patients). ***P = 0.0007, by 2-tailed, unpaired Student’s t test. (F) Western blot analysis of TYRO3 expression in 4T1-P and 4T1-R cells. Tubulin served as a loading control. (G) Immunoprecipitation followed by Western blot analysis of TYRO3 tyrosine phosphorylation levels in 4T1-P and 4T1-R cells in the presence of the TYRO3 ligand Gas6 (100 nM for 30 minutes). TYRO3 served as a loading control. (H) IHC staining of TYRO3 in patients with lung cancer who received anti–PD-1/PD-L1 therapy. H score for TYRO3 expression in patients who were resistant or nonresistant to anti–PD-1/PD-L1 therapy. n = 12 resistant patients; n = 17 nonresistant patients. *P = 0.0132, by 2-tailed, unpaired Student’s t test. Scale bars: 50 μm (left) and 25 μm (right). Data are presented as the mean ± SD.
Figure 2
Figure 2. TYRO3 is sufficient to render tumor cell resistant to anti–PD-1 treatment.
(A) Mice were given anti–mPD-1 antibody starting on the third day after tumor inoculation and treated on the indicated days for a total of 5 treatments. (B) TYRO3 expression in 4T1-P and Tyro3-OE cells. Tubulin was used as a loading control. (C) Tumor growth in mice bearing 4T1-P and Tyro3-OE tumors. Mice were given anti-IgG or anti–mPD-1 antibody. n = 10 mice/group. ****P < 0.0001 and NS P = 0.98, by 2-way ANOVA. Data are presented as the mean ± SEM. (D) Survival of mice in the 4T1-P and Tyro3-OE groups. n = 10 mice per group. *P = 0.0158, by 2-sided log-rank test. (E) Western blot analysis of TYRO3 expression in 4T1-R and Tyro3−/− cells. Tubulin was used as a loading control. (F) Tumor growth in mice bearing 4T1-R and Tyro3−/− tumors. The mice were given anti-IgG or anti–mPD-1 antibody treatment. n = 10 mice per group. ****P < 0.0001 and NS P = 0.65, by 2-way ANOVA. Error bars are present but nominal in some cases. Data are presented as the mean ± SEM. (G) Survival of mice in the 4T1-R and Tyro3−/− groups (n = 10 mice per group). ****P < 0.0001, by 2-sided log-rank test. (H) Hierarchical clustering analysis was performed with the log10 (FPKM+1) of union differentially expressed genes in all comparison groups (4T1-P, Tyro3-OE, 4T1-R, and Tyro3−/−), with the mean value used for each group. Venn diagram highlighting the similarities and differences in significantly downregulated (left) and upregulated (right) genes in 4T1-R and Tyro3-OE cells. (I) IPA of genes correlated with TYRO3 in 287 patients with melanoma. The z score was calculated by Spearman’s correlation and P values using IPA.
Figure 3
Figure 3. TYRO3 favors a protumor TME.
(A) t-distributed stochastic neighbor embedding (t-SNE) plot of tumor-infiltrating leukocytes overlaid with color-coded clusters. Five thousand cells are displayed in each t-SNE plot. (B) Frequency of clusters of the indicated immune cell subsets. Data represent the mean ± SD (n = 3 mice per group). CD8+ T cells, P = 0.11; Tregs, P = 0.16; M1 macrophages (M1-Mφ), **P = 0.008; and M2 macrophages (M2-Mφ), P = 0.24, by 2-tailed, unpaired Student’s t test. Clusters 13, 20, 24, and 29 comprised CD3+CD8+ cytotoxic T cells; clusters 3, 14, and 16 comprised CD3+CD4+CD25+ Tregs; clusters 1, 2, 4, 5, 7, and 12 comprised CD11b+CD68+CD206CD80+ M1-like macrophages; and clusters 8, 15, 17, 23, 26, 28, and 30 comprised CD11b+CD68+CD206+arginase 1+ M2-like macrophages.
Figure 4
Figure 4. TYRO3 suppresses tumor cell ferroptosis.
(A) Volcano plot of 4T1-P and Tyro3-OE differentially expressed genes. adj, adjusted. (B) SLC3A2 expression in patients with melanoma with high (n = 52) and low (n = 19) TYRO3 expression levels who received anti–PD-1 therapy. ****P < 0.0001, by 2-tailed, unpaired Student’s t test. (C) Relative lipid ROS in CD45 tumor cells. 4T1-P plus IgG versus 4T1-P plus anti–PD-1, *P = 0.037; Tyro3-OE plus IgG versus Tyro3-OE plus anti–PD-1, NS P = 0.92; and 4T1-P plus anti–PD-1 versus Tyro3-OE plus anti–PD-1, ***P = 0.0004, by 2-way ANOVA. (D) MFI of IFN-γ expression in CD8+ T cells from anti–PD-1–treated 4T1-P and Tyro3-OE tumors. NS P = 0.626, by 2-tailed, unpaired Student’s t test. (E) Percentage of 7-AAD+ cells in 4T1-P and Tyro3-OE cells treated with 2 μM erastin and/or 5 μM Fer-1 for 48 hours (n = 3). £P = 0.013, by 2-tailed, unpaired Student’s t test. (F) Relative lipid ROS in 4T1-P and Tyro3-OE cells treated with 10 μM erastin and/or 10 μM Fer-1 for 8 hours (n = 3). **P = 0.0013, by 2-tailed, unpaired Student’s t test. (G) Percentage of 7-AAD+ cells in 4T1-R and Tyro3−/− cells treated with 2 μM erastin and/or 5 μM Fer-1 for 24 hours (n = 3). ****P < 0.0001, by 2-tailed, unpaired Student’s t test. (H) Relative lipid ROS in 4T1-R and Tyro3−/− cells treated with 10 μM erastin and/or 10 μM Fer-1 for 8 hours (n = 3). ****P < 0.0001, †††P = 0.000124, and ††P = 0.00125, by 2-tailed, unpaired Student’s t test. (I) A dual-luciferase reporter assay was performed by cotransfecting ARE-reporter-luciferase and pRL-TK with a TYRO3-OE plasmid, and cells were primed with 2 μM MK2206 for 24 hours (n = 3). ##P = 0.002 and NS P = 0.115, by 2-tailed, unpaired Student’s t test. (J) Relative lipid ROS in 4T1-P and Tyro3-OE cells primed with 2 μM MK2206 for 24 hours, and then treated with 10 μM erastin for 8 hours (n = 3). §P = 0.02, §§P = 0.003, NS P = 0.052, and NS P = 0.79, by 2-tailed, unpaired Student’s t test. (K) Relative lipid ROS in 4T1 cells primed with or without 200 nM Pros1 for 24 hours and then treated with 10 μM erastin and/or 10 μM Fer-1 for 8 hours (n = 3). P = 0.013 and ****P < 0.0001, by 2-tailed, unpaired Student’s t test. (L) Relative lipid ROS in 4T1 Tyro3−/− cells primed with or without 200 nM Pros1 for 24 hours and then treated with 10 μM erastin and/or 10 μM Fer-1 for 8 hours (n = 3). NS P = 0.059, NS P = 0.53, and NS P = 0.58, by 2-tailed, unpaired Student’s t test. Data are presented as the mean ± SD.
Figure 5
Figure 5. Inhibition of TYRO3 enhances ferroptosis and sensitizes resistant tumors to anti–mPD-1 therapy.
(A) Immunoprecipitation followed by Western blot analysis of TYRO3 tyrosine phosphorylation (p-Tyr) in 4T1 cells treated with the TYRO3 inhibitor (TYRO3i) LDC1267 (2.5 μM, 2.5 hours) or control (DMSO), and in the presence or absence of Gas6 (100 nM, 30 minutes). TYRO3 served as a loading control.. (B) Percentage of 7-AAD+ cells in 4T1-R or Tyro3−/− cells treated with 0, 1, 2.5, and 5 μM LDC1267 for 24 hours (n = 3). NS P = 0.94, ****P < 0.0001, NS P = 0.87, NS P = 0.19, and NS P = 0.09, by 2-way ANOVA. (C) Relative lipid ROS in 4T1-R or Tyro3−/− cells treated with 5 μM LDC1267 for 12 hours (n = 3). ****P < 0.0001 and NS P = 0.16, by 2-tailed, unpaired Student’s t test. (D) Schematic showing the treatment schedule to evaluate the combination of LDC1267 and anti–mPD-1 treatment in mice. LDC1267 was intraperitoneally injected into mice starting on the third day after tumor inoculation for a total of 2 rounds, with 5 treatments for each round. Anti–mPD-1 was intraperitoneally injected into mice for a total of 5 treatments. (E) Growth of 4T1-R tumors in mice that were given anti–mPD-1, LDC1267, or their combination. IgG treatment served as a control (n = 10 mice per group). ****P < 0.0001 and **P = 0.0039, by 2-way ANOVA. Data are presented as the mean ± SEM. (F) Survival of mice in each group. ****P < 0.0001, by 2-sided log-rank test (TYRO3i plus anti–PD-1 versus anti–PD-1 alone). (G) Indicators of liver and kidney function in mice. The normal range for BUN, (H) AST, and (I) ALT are indicated by the dashed lines (n = 3 mice per group). (J) Schematic of the proposed model showing that TYRO3 inhibits tumor ferroptosis and supports a protumor TME by reducing the ratio of M1/M2 macrophages, thus promoting anti–PD-1 therapy resistance.

Similar articles

Cited by

References

    1. Hamid O, et al. Five-year survival outcomes for patients with advanced melanoma treated with pembrolizumab in KEYNOTE-001. Ann Oncol. 2019;30(4):582–588. doi: 10.1093/annonc/mdz011. - DOI - PMC - PubMed
    1. Garon EB, et al. Pembrolizumab for the treatment of non-small-cell lung cancer. N Engl J Med. 2015;372(21):2018–2028. doi: 10.1056/NEJMoa1501824. - DOI - PubMed
    1. Adams S, et al. Pembrolizumab monotherapy for previously untreated, PD-L1-positive, metastatic triple-negative breast cancer: cohort B of the phase II KEYNOTE-086 study. Ann Oncol. 2019;30(3):405–411. doi: 10.1093/annonc/mdy518. - DOI - PubMed
    1. El-Khoueiry AB, et al. Nivolumab in patients with advanced hepatocellular carcinoma (CheckMate 040): an open-label, non-comparative, phase 1/2 dose escalation and expansion trial. Lancet. 2017;389(10088):2492–2502. doi: 10.1016/S0140-6736(17)31046-2. - DOI - PMC - PubMed
    1. Hirano F, et al. Blockade of B7-H1 and PD-1 by monoclonal antibodies potentiates cancer therapeutic immunity. Cancer Res. 2005;65(3):1089–1096. - PubMed

Publication types

MeSH terms