Review
. 2021 Jun;22(6):970-982.
doi: 10.3348/kjr.2020.0996. Epub 2021 Apr 1.

Clinical Applications of Dual-Energy CT

Affiliations
Review

Clinical Applications of Dual-Energy CT

Saira Hamid et al. Korean J Radiol. 2021 Jun.

Abstract

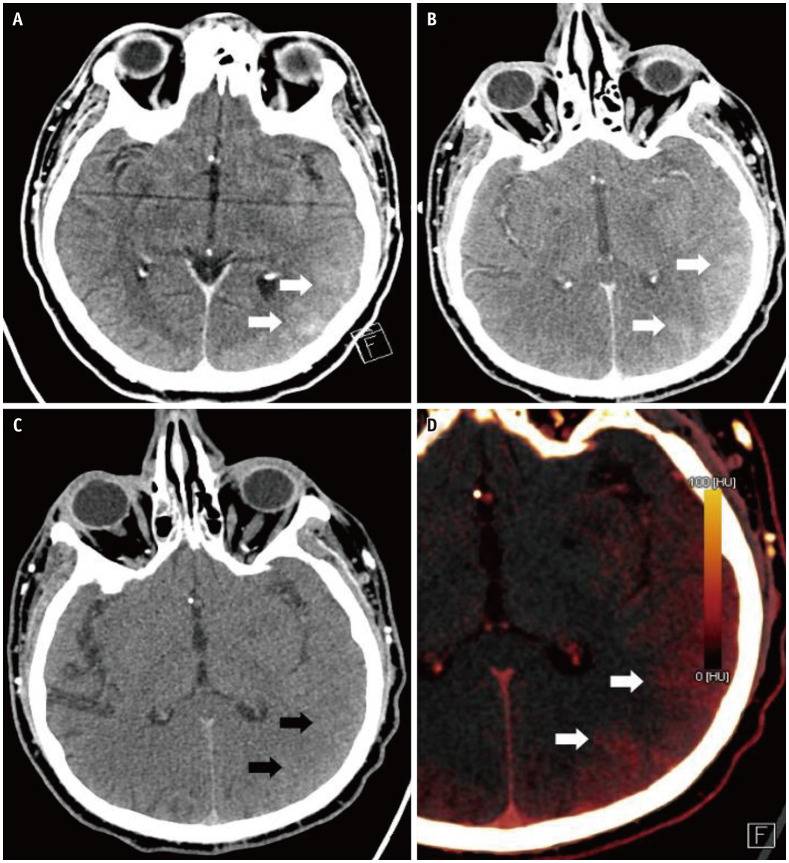
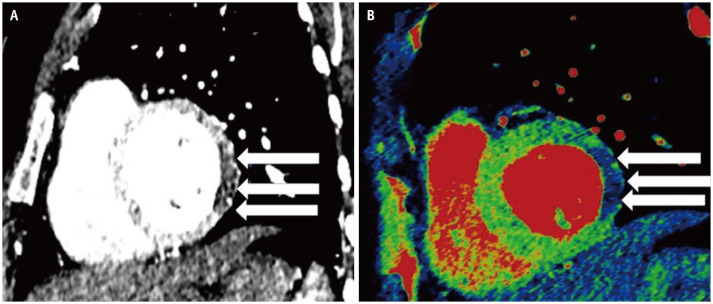
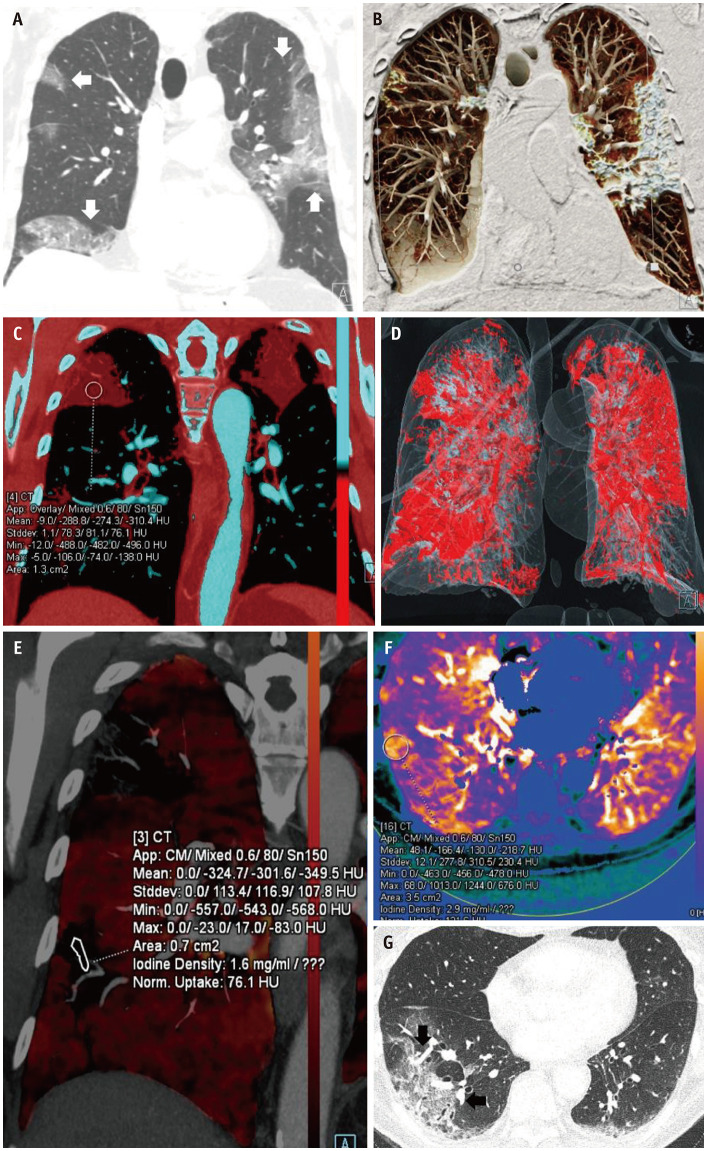
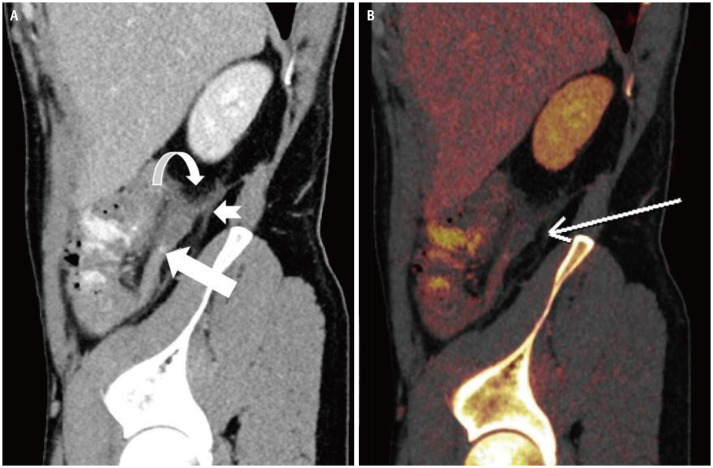
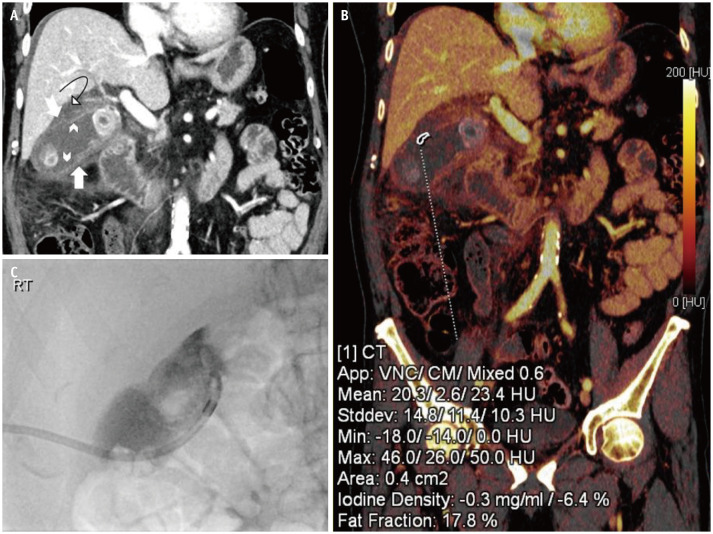
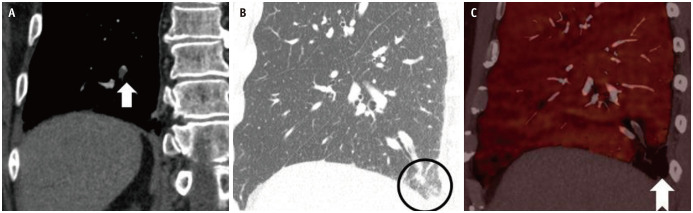
Dual-energy CT (DECT) provides insights into the material properties of tissues and can differentiate between tissues with similar attenuation on conventional single-energy imaging. In the conventional CT scanner, differences in the X-ray attenuation between adjacent structures are dependent on the atomic number of the materials involved, whereas in DECT, the difference in the attenuation is dependent on both the atomic number and electron density. The basic principle of DECT is to obtain two datasets with different X-ray energy levels from the same anatomic region and material decomposition based on attenuation differences at different energy levels. In this article, we discuss the clinical applications of DECT and its potential robust improvements in performance and postprocessing capabilities.

Keywords: Acute hemorrhage; COVID-19; DECT; Metal artifacts.


Conflict of interest statement

The authors have no potential conflicts of interest to disclose.

Figures

Fig. 1
Fig. 1. A 48-year-old male with post-tissue plasminogen activator after left middle cerebral artery infarct.
A. Axial CT head image shows evolving left MCA infarction displaying local mass effect with sulcal effacement in the left temporal and parieto-occipital lobes. High attenuation gyri (arrows) in this region can either be due to petechial hemorrhage or contrast staining. Dual-energy CT head. B. Post-contrast image demonstrates contrast staining in the region of infarction seen as hyperattenuating gyri (arrows). C. Virtual non-contrast image corresponding to normal gyri appearance (arrows) and no corresponding high-density areas, confirming contrast staining rather than hemorrhage. D. Color coded iodine map shows the distribution of iodine in the regions of contrast staining (arrows).
Fig. 2
Fig. 2. A 68-year-old male presented to the emergency department with acute chest pain.
A, B. CT chest sagittal image (A) shows hypoattenuating myocardium, which corresponds to a decreased iodine uptake in the left ventricular free wall suggesting perfusion defect (arrows) depicted as blue color, coded on (B) iodine overlay images (arrows).
Fig. 3
Fig. 3. 76-years-old male with polymerase chain reaction-positive COVID-19 pneumonia.
A. CT chest coronal reformatted image with lung window shows multifocal predominantly peripherally distributed areas of consolidation in both lungs (arrows). B. Coronal clip plane cinematic rendered CT chest image displays similar pattern of the pulmonary involvement with dense consolidation. C. Color coded iodine map with red color highlighting consolidation quantifying the iodine content. D. Volume rendered three-dimensional image analysis reveals the snapshot of total lung volume involvement. E. Dual-energy CT chest with color coded iodine overlay maps displaying peripheral areas of consolidation in the right upper and lower lobe with reduced iodine uptake measured at 1.6 mg/mL. F. Dual-energy CT analysis (dense lung protocol) post processed on Siemens Syngo.via (VB30) shows the areas of increases perfusion around the relatively hypoperfused pulmonary consolidation. G. Axial CT image (lung windows) shows right greater than left lower lobe multifocal bronchial wall thickening and peripheral areas of ground-glass, consolidation and septal thickening with organizing pneumonia pattern. Peripheral dilatation of vessels (arrows) on the lung windows presumably represent pre-stenotic dilation.
Fig. 4
Fig. 4. A 40-year-old male who presented with a 24-hours history of abdominal pain, which was more marked in the right lower quadrant.
A, B. Dual-energy CT (A) source sagittal image shows dilated retrocecal appendix with mural thickening, surrounding inflammatory fat stranding (curved arrow), thickening of peritoneal reflections (notched arrow) and trace free fluid consistent with acute appendicitis. A 5-mm hyperdense appendicolith (arrow) in the mid appendix. (B) Color coded iodine maps reveals an area of reduced iodine uptake along the posterior wall of the appendicular tip with reduced iodine uptake (arrow), concerning for early gangrenous appendicitis with histopathologic confirmation of acute appendicitis with mural necrosis.
Fig. 5
Fig. 5. A 77-years-old male who presented with a 2-day history of abdominal pain and distension with obstipation.
Past medical history revealed treated colon carcinoma. A. Distended gallbladder with pericholecystic edema and mural thickening (arrow). Focal areas of the gallbladder wall display decreased enhancement (chevron arrows). Mural defect in the cranial aspect of the gallbladder body (notched arrow) with perforation and incompletely imaged walled off collection (curved arrow) in the gallbladder fossa. B. Color coded iodine map reveals the lack of iodine uptake in the region of perforated gallbladder wall suggesting mural necrosis. C. Percutaneous cholecystostomy was done to relieve the symptoms.
Fig. 6
Fig. 6. A 68-year-old male with right pleuritic chest pain and ipsilateral flank area pain.
A, B. CT pulmonary angiogram (A) cropped coronal image shows a filling defect (arrow) in the right posterior basal subsegmental branch consistent with pulmonary embolism. (B) Sagittal CT chest lung window shows a focal ground-glass (circle) consistent with an evolving infarct in the posterior basal right lower lobe corresponding to an area of decreased perfusion (notched arrow) evident on (C) iodine overlay maps.

References

    1. Grajo JR, Patino M, Prochowski A, Sahani DV. Dual energy CT in practice: basic principles and applications. Appl Radiol. 2016;45:6–12.
    1. Patel BN, Thomas JV, Lockhart ME, Berland LL, Morgan DE. Single-source dual-energy spectral multidetector CT of pancreatic adenocarcinoma: optimization of energy level viewing significantly increases lesion contrast. Clin Radiol. 2013;68:148–154. - PubMed
    1. Matsumoto K, Jinzaki M, Tanami Y, Ueno A, Yamada M, Kuribayashi S. Virtual monochromatic spectral imaging with fast kilovoltage switching: improved image quality as compared with that obtained with conventional 120-kVp CT. Radiology. 2011;259:257–262. - PubMed
    1. Wichmann JL, Nöske EM, Kraft J, Burck I, Wagenblast J, Eckardt A, et al. Virtual monoenergetic dual-energy computed tomography: optimization of kiloelectron volt settings in head and neck cancer. Invest Radiol. 2014;49:735–741. - PubMed
    1. Bodanapally UK, Dreizin D, Issa G, Archer-Arroyo KL, Sudini K, Fleiter TR. Dual-energy CT in enhancing subdural effusions that masquerade as subdural hematomas: diagnosis with virtual high-monochromatic (190-keV) images. AJNR Am J Neuroradiol. 2017;38:1946–1952. - PMC - PubMed

MeSH terms