. 2021 May 3;220(5):e202007207.
doi: 10.1083/jcb.202007207.

Time-resolved proteomics profiling of the ciliary Hedgehog response

Affiliations

Time-resolved proteomics profiling of the ciliary Hedgehog response

Elena A May et al. J Cell Biol. .

Abstract

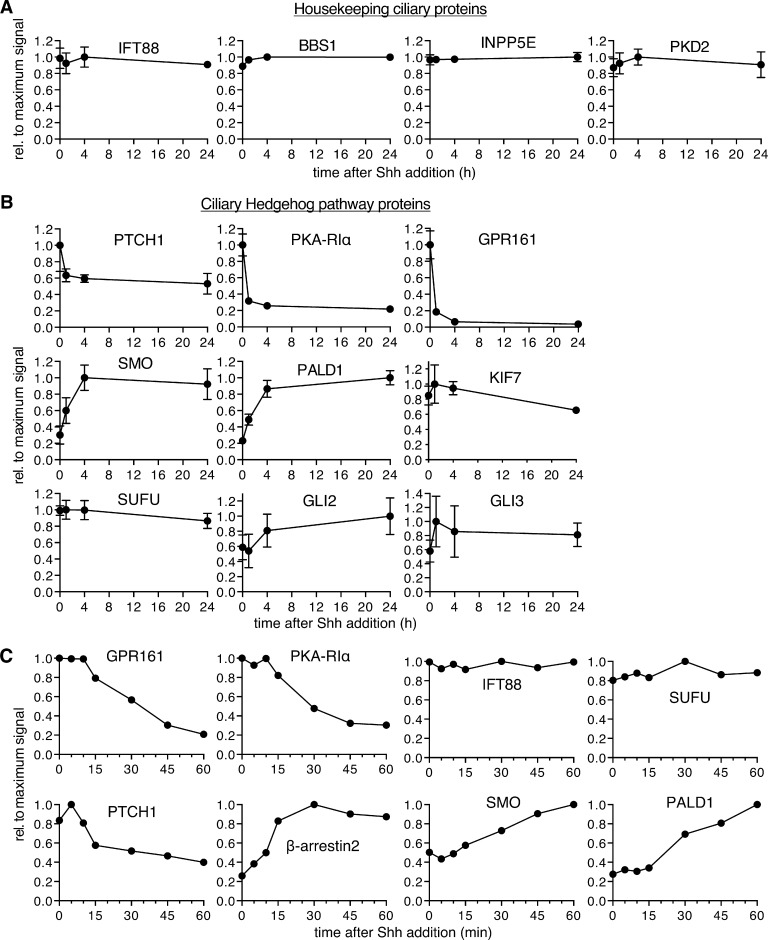
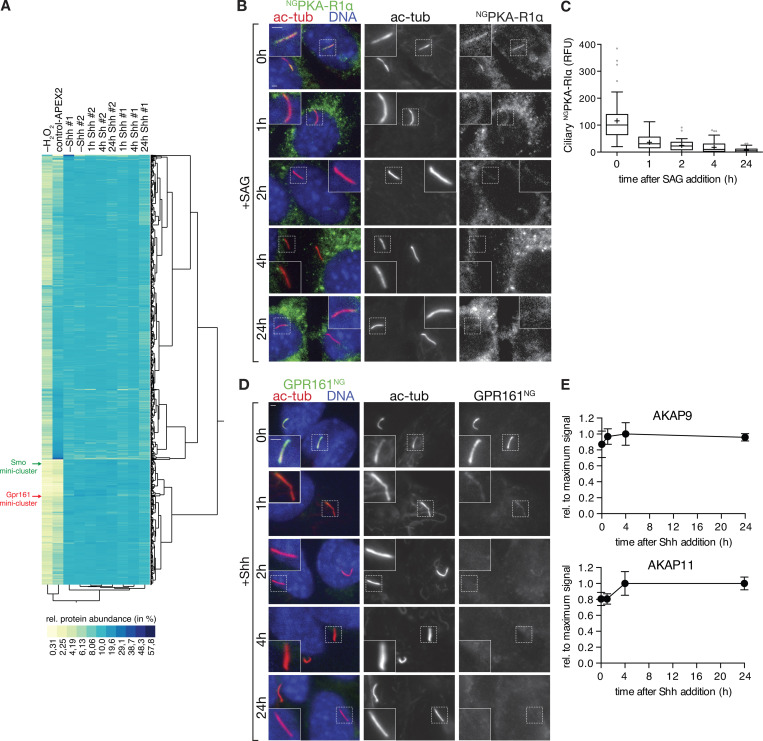
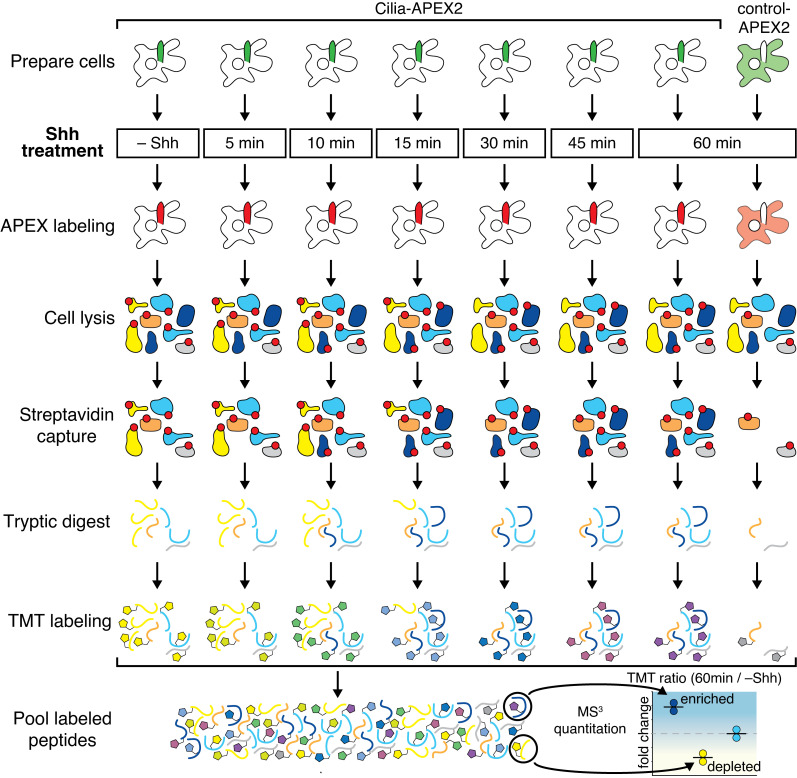
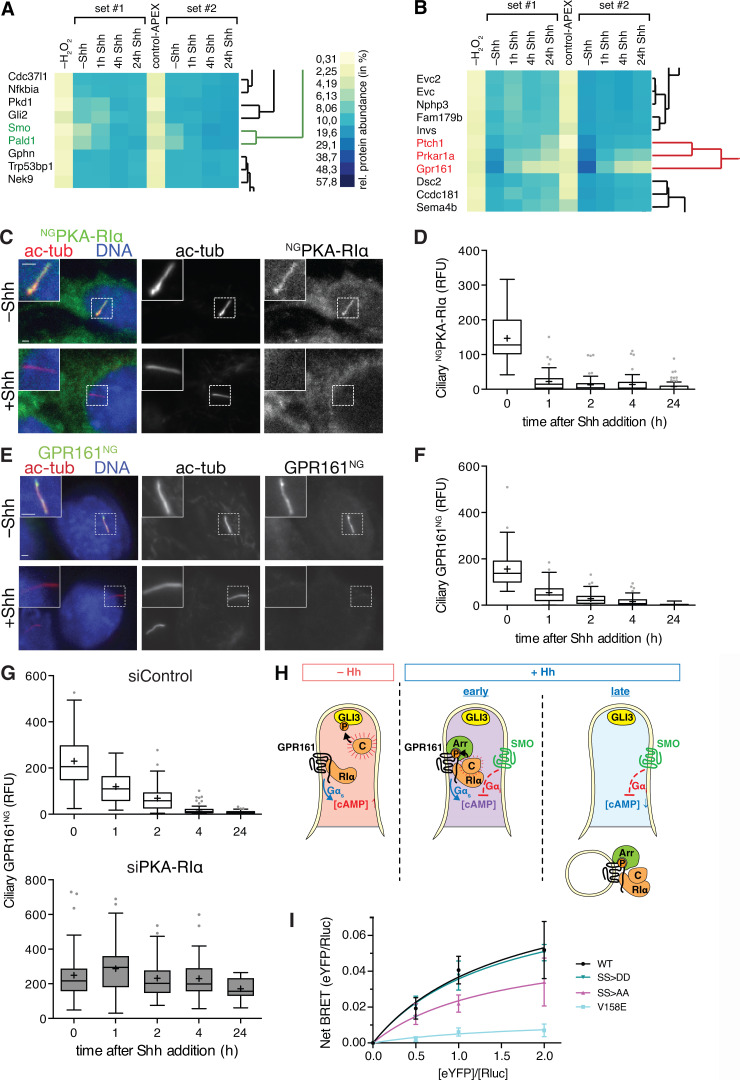
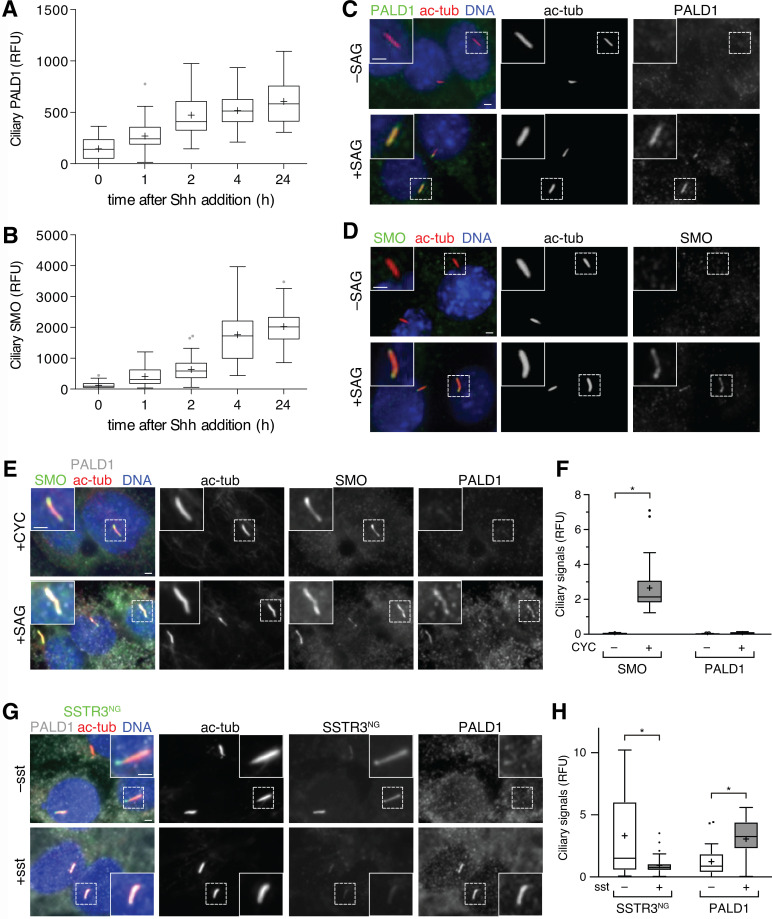
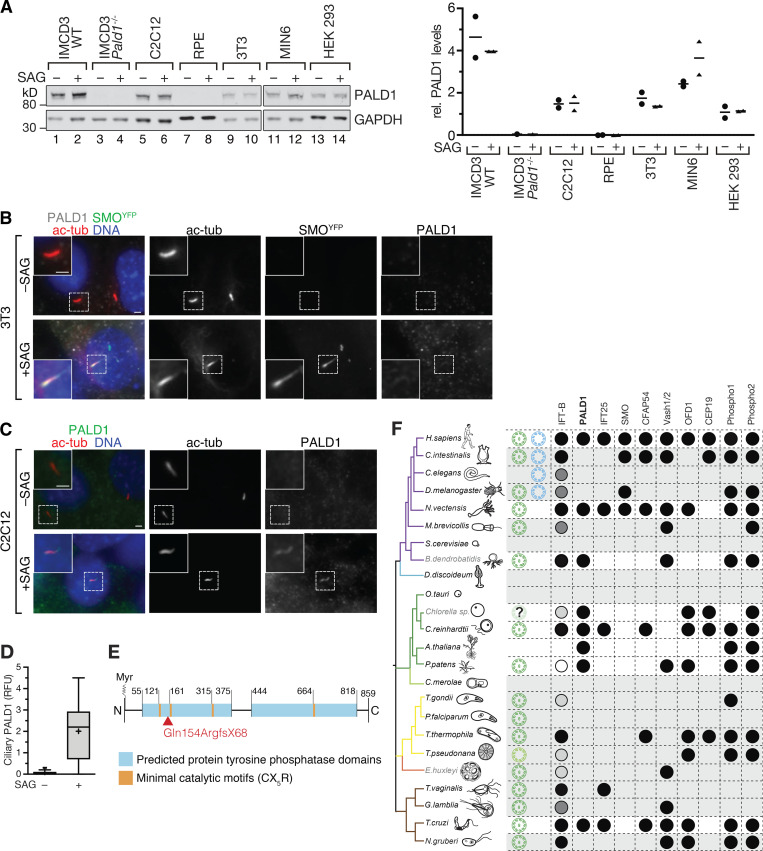
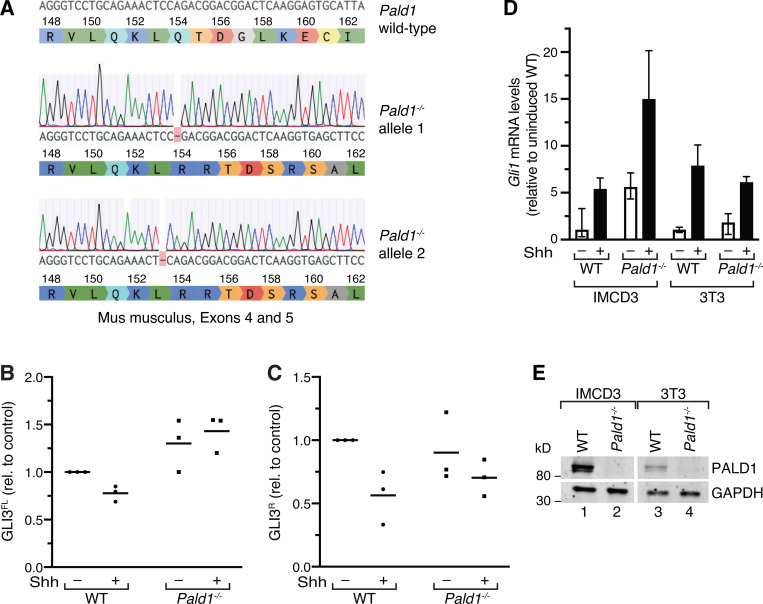
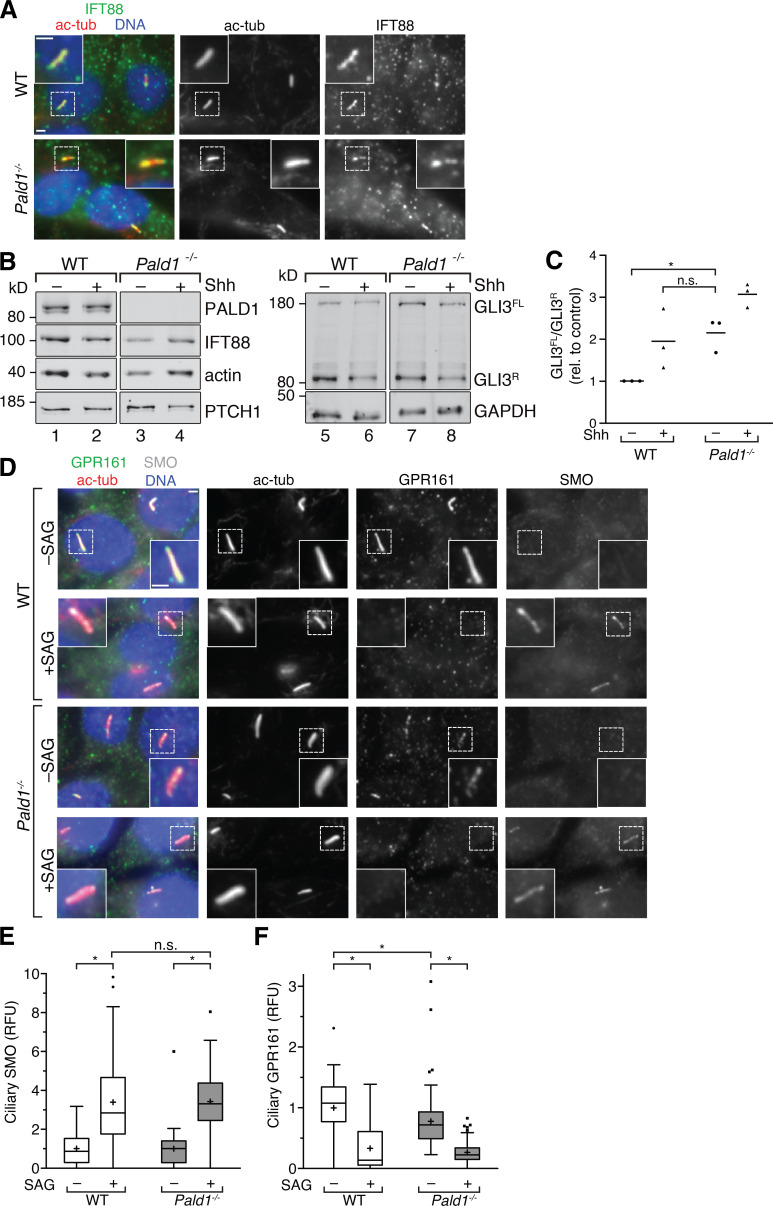
The primary cilium is a signaling compartment that interprets Hedgehog signals through changes of its protein, lipid, and second messenger compositions. Here, we combine proximity labeling of cilia with quantitative mass spectrometry to unbiasedly profile the time-dependent alterations of the ciliary proteome in response to Hedgehog. This approach correctly identifies the three factors known to undergo Hedgehog-regulated ciliary redistribution and reveals two such additional proteins. First, we find that a regulatory subunit of the cAMP-dependent protein kinase (PKA) rapidly exits cilia together with the G protein-coupled receptor GPR161 in response to Hedgehog, and we propose that the GPR161/PKA module senses and amplifies cAMP signals to modulate ciliary PKA activity. Second, we identify the phosphatase Paladin as a cell type-specific regulator of Hedgehog signaling that enters primary cilia upon pathway activation. The broad applicability of quantitative ciliary proteome profiling promises a rapid characterization of ciliopathies and their underlying signaling malfunctions.


Figures

Figure 1.
Figure 1.
Modest Cilia-APEX2 expression enables labeling of the ciliary contents without disturbing the ciliary localization of Hh signaling components. (A) Diagram of Hh signaling. Positive and negative regulators are in green and red boxes, respectively. Pharmacological agents are in oval circles and proteins in rectangles. Acronyms are defined in the text. (B) Diagrams of the Cilia-APEX and Cilia-APEX2 expression cassettes. Numbers indicate amino acid positions. The N terminus of NPHP3 is myristoylated at glycine 2 (Myr) and confers ciliary targeting. The truncated CMV promoter (pCMV(Δ6)) is considerably weaker than the EF1α promoter (pEF1α). (C) IMCD3 cells and stable clones expressing Cilia-APEX or Cilia-APEX2 were serum-starved for 24 h in the presence or absence of Shh before fixation and staining for GPR161 (white) and ARL13B (red). Cilia-APEX and Cilia-APEX2 were visualized via the intrinsic fluorescence of GFP (green). DNA in blue. (D) Box plots showing the relative GPR161 fluorescence normalized to ARL13B in the primary cilium of IMCD3, Cilia-APEX, and Cilia-APEX2 cell lines after Shh treatment as in A. n = 50 cilia per condition. In these and all subsequent box plots, crosses indicate mean values, whiskers indicate values within 1.5× interquartile range, and dots represent outliers. RFU, relative fluorescence unit. (E) IMCD3, Cilia-APEX, and Cilia-APEX2 cell lines were immunoblotted for GFP (APEX fusions), IFT88, and actin. (F) Signals from immunoblots as in E were quantified, ratios of GFP signals in the Cilia-APEX relative to the Cilia-APEX2 cell line were calculated, and results plotted. Thick horizontal line represents the mean (n = 3). (G) IMCD3, Cilia-APEX, and Cilia-APEX2 cell lines were subjected to APEX labeling before fixation and staining for ARL13B (red) and biotin (white). The APEX fusion proteins are detected via intrinsic GFP fluorescence (green). DNA in blue. (H and I) Box plots showing background-subtracted intensities of GFP (H) and biotin (I) signals in the primary cilium from images as in G. n = 30 cilia per condition. Scale bars, 2 µm in all panels.
Figure S1.
Figure S1.
A cilia-less cell line expressing Cilia-APEX2 serves as a specificity control for Cilia-APEX2 proteomics. (A) Dot plot showing total protein levels of IFT88 relative to actin in indicated cell lines as determined by quantitative immunoblotting (see Fig. 1 E). Mean values are indicated by horizontal lines (n = 3). (B) The Cep164 gene was sequenced from genomic DNA from Cep164−/− cells and aligned with the Cep164 gene sequence from M. musculus. A homozygous single-base-pair deletion in exon 8 leads to a frameshift mutation and protein truncation. DNA sequences were analyzed using Benchling. (C and D) Immunofluorescence micrographs of WT or CEP164-deficient (Cep164−/−) cell lines stably expressing Cilia-APEX2. Cell lines were serum-starved for 24 h before fixation. Cilia-APEX2 proteins were detected by GFP fluorescence. (C) Ninein marks centrioles and is visualized by antibody staining. (D) γ-Tubulin and CEP164 are detected by specific antibodies (Lau et al., 2012). Scale bars, 2 µm. (E) High reproducibility of Cilia-APEX2 proteomics setup. Hierarchical cluster analysis based on Ward’s minimum variance method (two-way clustering) of the relative abundances of each identified protein (rows) in the individual samples (columns). Relative scaled abundances were calculated by dividing the TMT signal to noise of an individual protein by the sum of TMT signal to noise ratios in all samples. Legend depicts color scheme for relative abundances (percentage). Brackets indicate cilia clusters (red and purple; see Fig. 2 B) and unrelated cluster (orange) without cilia proteins. (F) Zoom into the control/nonciliary cluster (orange) in the hierarchical cluster analysis shown in E.
Figure 2.
Figure 2.
Cilia-APEX2-based deep proteomics. (A) Workflow of a Cilia-APEX2/TMT experiment. Cells were grown in serum-rich medium for 48 h and switched to low serum for 24 h before conducting APEX labeling by preincubating cells with biotin tyramide for 30 min and adding H2O2 for 2 min before quenching. Cells were lysed, biotinylated proteins (marked with red dots) were isolated on streptavidin resin, and bound material was eluted via on-bead digest with trypsin. For each individual sample, peptides were labeled with a unique TMT. All samples were then pooled and peptides were analyzed using a synchronous precursor selection MS3 method for mass spectrometric identification and quantitation. All samples were in triplicate, except for a technical control, where H2O2 was omitted. (B) Hierarchical two-way cluster analysis of a Cilia-APEX2/TMT experiment. Clustering of the relative abundances of each identified protein (rows) in the individual samples (columns) was performed based on Ward’s minimum variance method. The relative abundance of a given protein was calculated by dividing the TMT signal in one sample by the sum of TMT signals in all samples. The color scheme of relative abundances is shown on the right (in percent). Only the clusters containing cilia proteins are shown (see Fig. S1 E for full cluster analysis). (C and D) Volcano plots of statistical significance versus protein enrichment in Cilia-APEX2 compared with control-APEX2 samples (C) or in Cilia-APEX2 WT versus Cep164−/− samples (D). Calculated P values (statistical significance of enrichment calculated from unpaired Student’s t tests) for 4,836 quantified proteins were plotted against the TMT ratios of Cilia-APEX2 samples versus the respective controls. Proteins fulfilling all four significance and enrichment criteria are represented by blue dots, proteins meeting three criteria are represented by black dots, and other proteins are shown in gray (see text for details). Protein hits quantified by only one peptide are highlighted in purple. See Table S1. (E) Schematic of a primary cilium with key protein complexes, structures, or pathways. The boxes list proteins identified as tier 1 (black) or tier 2 (gray) hits of the Cilia-APEX2 proteome. Proteins not identified by Cilia-APEX2 are indicated by dashed outline lettering. Gene symbols are included when differing from conventional protein names. Note that Ttc30a1 and Ttc30a2 are grouped into IFT70A/Ttc30a.
Figure 3.
Figure 3.
Experimental outline of time-resolved Cilia-APEX2 proteomics after Shh stimulation. (A) Workflow of a time-resolved Cilia-APEX2/TMT experiment. The workflow is identical to Fig. 2 A, except that Shh was added 24 h, 4 h, or 1 h before labeling as indicated. −Shh indicates addition of conditioned medium without Shh. Red dots mark biotinylated proteins. (B) Volcano plot of significance versus enrichment in 24 h Shh-treated compared with no-Shh samples. Hh signaling components known to change their ciliary localization are shown in blue, and proteins with newly identified changes are shown in orange. Relative quantification ratios of 5,350 proteins are plotted.
Figure 4.
Figure 4.
Time-resolved Cilia-APEX2 proteomics reveals the extent of ciliary proteome remodeling in response to Shh. The relative abundances of selected proteins in the Cilia-APEX2/TMT datasets are plotted against time. For each individual protein, the background signal in the control-APEX2 sample was set to 0 and the maximum average signal across all time points was set to 1. t = 0 corresponds to the −Shh sample. (A and B) 24-h time course. Data points represent averages of duplicate measurements, and error bars depict individual values. Error bars smaller than indicated datapoint symbols have been omitted. 0 h represents −Shh as in Fig. 3 A. Housekeeping ciliary proteins are shown in A. Known and newly identified Hh signaling components are shown in B. (C) 1-h time course. Normalized intensities (relative to ARL13B) were plotted over time. See also Fig. S3.
Figure S2.
Figure S2.
Hh pathway activation removes PKA-RIα and GPR161 from cilia, but not the AKAPs identified by Cilia-APEX2. (A) Two-way hierarchical cluster analysis (Ward’s method) of the relative protein abundances (rows) in the individual samples (columns) shows high inter-set reproducibility. Legend depicts the color scheme of relative abundances (calculated as in Fig. S1 E). SMO and GPR161 miniclusters are indicated by green and red arrows, respectively (see Fig. 5, A and B for magnified views of the miniclusters). (B and C) Ciliated NGPKA-RIα–expressing IMCD3 cells were treated with or without SAG for the indicated times. (B) Cells were fixed and stained for acetylated tubulin (ac-tub; red) and DNA (blue). NGPKA-RIα was visualized by NG fluorescence. (C) Box plot shows background-corrected NGPKA-RIα fluorescence in cilia at indicated time points after SAG addition. 50 cilia (n = 50) were analyzed per time point. (D) Ciliated IMCD3 cells expressing GPR161NG were serum-starved for 24 h in the presence of Shh for indicated times and analyzed as in B. GPR161NG was detected by NG fluorescence. For quantitative analysis, see Fig. 5 F. (E) Relative AKAP abundances assessed by mass spectrometric TMT quantitation were plotted over time. Data points represent averages of duplicate measurements, error bars depict individual values. Maximum average signal was set to 1, and background signals as assessed from control-APEX2 labeled samples were set to 0. 0 h represents −Shh. Scale bars, 2 µm. In box plots, crosses indicate mean values, whiskers indicate values within 1.5× interquartile range, and dots represent outliers.
Figure S3.
Figure S3.
Experimental workflow for high resolution time-resolved Cilia-APEX2 profiling of the ciliary Hh response. Related to Fig. 4 C. Cilia-APEX2 and control-APEX2 IMCD3 cells were seeded 72 h before the APEX labeling reaction. 24 h before labeling, cells were starved of serum. 5, 10, 15, 30, 45, and 60 min before APEX labeling, Shh-conditioned medium was added (as indicated). −Shh indicates addition of conditioned medium without Shh 60 min before labeling. APEX labeling and sample preparation were performed as in Fig. 2 A. In brief, biotin tyramide was added 30 min before the 2-min labeling reaction in the presence of H2O2. Samples were quenched and kept on ice for lysis, followed by streptavidin capture and on-bead tryptic digest. Peptides of each sample were labeled with individual TMTs, pooled, and fractionated offline via high-pH reverse-phase chromatography before mass spectrometric analysis. Red dots mark biotinylated proteins.
Figure 5.
Figure 5.
Hierarchical two-way cluster analysis reveals that PKA-RIα exits cilia together with GPR161 in response to Hh signal. (A and B) Magnified views of the hierarchical cluster analysis of the two time-resolved Cilia-APEX2 proteomics experimental replicates. (A) SMO minicluster (green) and neighboring branches. (B) GPR161 minicluster (red) and neighboring branches. Prkar1a is the gene name for PKA-RIα. Complete cluster analysis shown in Fig. S2 A. (C) Ciliated IMCD3 cells stably expressing NGPKA-RIα were treated with Shh or control medium. Cells were fixed and stained for acetylated tubulin (ac-tub; red) and DNA (blue). NGPKA-RIα was visualized via the intrinsic fluorescence of NG (green). (D) Box plot showing background-corrected NGPKA-RIα fluorescence in cilia at indicated time points after Shh addition. (E) IMCD3 cells expressing GPR161NG were treated and analyzed as in C. GPR161NG was visualized via the intrinsic fluorescence of NG. (F) Box plot showing background-corrected ciliary GPR161NG signal at indicated time points after Shh addition. (G) Box plots showing background-corrected GPR161NG fluorescence signals in the primary cilium of cells transfected with siRNA against Prkar1a or control siRNA at indicated times after Shh addition. (H) Model of the functional interaction between GPR161, PKA, and SMO. In unstimulated cells (−Hh), GPR161 keeps [cAMP]cilia high via activation of Gαs. GPR161-bound PKA-RIα releases the fully active catalytic PKA subunits (C) to phosphorylate downstream targets (GLI3). Early after pathway activation (+Hh, early), SMO begins to accumulate in cilia and lowers [cAMP]cilia via Gαi activation. This leads to the association of PKA-C with PKA-RIα to form a partially active holoenzyme that may locally phosphorylate the GPR161 C-terminal tail. GPR161 phosphorylation is a prerequisite for β-arrestin2 (Arr) recruitment, resulting in the exit of GPR161 from cilia and internalization, possibly together with PKA holoenzyme bound (+Hh, late). The removal of GPR161 from cilia eliminates the source of tonic Gαs activation, which leads to a further reduction of [cAMP]cilia. (I) HEK293T cells were transiently cotransfected with the same amount of Rlucβ-arrestin2 DNA and increasing amounts of WT or V158E, S445A/S446A (SS>AA), or S445D/S446D (SS>DD) mutants of GPR161YFP as indicated. Cells were subjected to BRET analysis 48 h after transfection (see Materials and methods for details). Titration curves are based on the means of four datasets (n = 4), and error bars indicate SEM. All scale bars represent 2 µm. n = 60 cilia analyzed per time point in all box plots. In box plots, crosses indicate mean values, whiskers indicate values within 1.5× interquartile range, and dots represent outliers.
Figure 6.
Figure 6.
PALD1 accumulates in primary cilia in response to activation of Gαi in cilia. (A and B) Ciliated IMCD3 cells were treated with Shh for the indicated times before fixation and staining for PALD1 (A) or SMO (B). Box plots display the background-corrected signals of PALD1 and SMO in primary cilia. n = 59 cilia analyzed per condition. (C and D) Ciliated IMCD3 cells were treated with or without SAG for 24 h and immunostained for the indicated proteins. (E and F) Ciliated IMCD3 cells were treated with cyclopamine (+CYC) or SAG for 24 h and analyzed as in C and D. (E) Micrographs of representative images. (F) Box plots showing background-corrected, relative ciliary fluorescence intensities of the respective proteins normalized to acetylated tubulin signals. n = 30 analyzed per condition. Data were analyzed using two-way ANOVA with multiple comparisons (Tukey test) with a defined confidence of 95%. *, P < 0.05. (G and H) Ciliated IMCD3 cells stably expressing SSTR3NG were stimulated with 0 or 10 µM somatostatin (sst) for 24 h and analyzed as in E and F (n = 30). SSTR3NG was detected via NG fluorescence. Data were analyzed using two-way ANOVA with multiple comparisons (Sidak test) with a defined confidence of 95%. *, P < 0.05. All scale bars represent 2 µm. In box plots, crosses indicate mean values, whiskers indicate values within 1.5× interquartile range, and dots represent outliers.
Figure 7.
Figure 7.
PALD1 accumulates in primary cilia upon Hh pathway activation in particular cell lines. (A) Lysates of different cell lines treated with or without SAG for 24 h were immunoblotted for PALD1 and GAPDH (loading control). Dot plot displaying the ratios of PALD1 to GAPDH signals with horizontal lines indicating means (n = 2 except for Pald1−/− where n = 1). (B) PALD1 does not accumulate in primary cilia of 3T3 cells after Hh pathway activation, whereas SMO does. Ciliated 3T3 cells expressing YFPSMO (Rohatgi et al., 2009) were treated with or without SAG for 24 h and stained for PALD1, acetylated tubulin, and DNA. SMO was detected via YFP fluorescence. Scale bars, 2 µm. (C and D) PALD1 is enriched in C2C12 myoblast primary cilia after Hh pathway activation. C2C12 cells were treated and analyzed as in B. Box plots show background-corrected, relative fluorescence levels normalized to acetylated tubulin signals. n = 30 cilia analyzed per condition. (E) Diagram of PALD1 showing predicted protein domains and motifs. Numbers indicate amino acid positions in M. musculus PALD1; Myr depicts the myristoylation site at Gly2. Arrowhead indicates location of missense mutation in Pald1−/− cells (see Fig. S4 A). (F) Phylogenetic analysis of PALD1 orthologues and co-conserved proteins identified by pathway clustering analysis (Li et al., 2014). Shown is a simplified taxonomic tree with crown eukaryotic groups in different colors (modified from Carvalho-Santos et al., 2010). Branch color code: purple, opisthokonts; blue, amoebozoa; green, plants; yellow, alveolates and heterokonts; orange, haptophytes; and brown, excavates. When present in the respective organism, motile cilia are shown in green and primary cilia in blue. The presence of the corresponding proteins is indicated by black circles. Conservation of IFT-B complex subunits is depicted by circles with shades of gray corresponding to percentage of subunits with orthologues (black, 100%; dark gray, <100%; light gray, <60%; white, <30%). Proteins with E-values ≤ 10−25 were scored as hits. In box plots, crosses indicate mean values, whiskers indicate values within 1.5× interquartile range, and dots represent outliers.
Figure S4.
Figure S4.
Full-length GLI3 levels are increased in Pald1−/− IMCD3 cells. (A) cDNA preparation of a CRIPSR/Cas9 genome-edited Pald1−/− IMCD3 cell clone was sequenced and aligned with the PALD1 WT gene sequence from M. musculus. Single-base-pair deletions in exon 4 lead to biallelic frameshift mutations and protein truncation. The DNA sequences have been analyzed using Benchling. (B and C) Quantitation of GLI3 full-length (FL) and repressor (R) forms. Lysates of WT and Pald1−/− IMCD3 cells cultured in the presence or absence of Shh were separated by SDS-PAGE and analyzed by immunoblotting (as in Fig. 8 B). Dot plots show relative GLI3 full-length (GLI3FL; B) and repressor (GLI3R; C) signals normalized to GAPDH, quantified from three independent experiments (n = 3). Horizontal lines indicate means. Each experiment was internally normalized to the relative signals in WT in the absence of signal (WT −Shh ratios = 1). (D) Indicated cell lines were serum-starved for 48 h in the presence or absence of Shh. Gli1 transcript levels were determined using reverse transcription quantitative real-time PCR. Shown are means of relative transcript levels normalized to Gapdh (n = 2). (E) Cell lysates of indicated WT and Pald1−/− cell lines were separated by SDS-PAGE and analyzed by Western blotting using PALD1- and GAPDH-specific antibodies.
Figure 8.
Figure 8.
Hh pathway activity is derepressed in Pald1−/− IMCD3 cells. (A) Ciliated WT and Pald1−/− IMCD3 cells were stained for indicated proteins and DNA. (B) WT and Pald1−/− IMCD3 cells treated with or without Shh for 24 h were immunoblotted for the indicated proteins. GLI3 repressor (GLI3R) and full-length (GLI3FL) forms are indicated. (C) GLI3R and GLI3FL signals from three independent experiments as in B were quantified (see Fig. S4) and GLI3FL/GLI3R ratios plotted. Horizontal lines depict means (n = 3). Each experiment was internally normalized to the GLI3FL/GLI3R ratio in WT in the absence of signal (WT –Shh GLI3FL/GLI3R ratio = 1). (D) Ciliated WT and Pald1−/− IMCD3 cells were treated with or without SAG for 24 h and stained for the indicated proteins and DNA. (E and F) Box plots showing background-corrected, relative fluorescence normalized to acetylated tubulin signals. (E) Two independent experiments were performed, and 30 cilia were analyzed per condition in each experiment (n = 60). (F) 30 cilia per condition were analyzed from three independent experiments (n = 90). Data were analyzed using two-way ANOVA with multiple comparisons in a Tukey test with a defined confidence of 95%. *, P < 0.05; n.s., not significant. All scale bars represent 2 µm. In box plots, crosses indicate mean values, whiskers indicate values within 1.5× interquartile range, and dots represent outliers.

References

    1. Aillaud, C., Bosc C., Peris L., Bosson A., Heemeryck P., Van Dijk J., Le Friec J., Boulan B., Vossier F., Sanman L.E., et al. . 2017. Vasohibins/SVBP are tubulin carboxypeptidases (TCPs) that regulate neuron differentiation. Science. 358:1448–1453. 10.1126/science.aao4165 - DOI - PubMed
    1. Alonso, A., and Pulido R.. 2016. The extended human PTPome: a growing tyrosine phosphatase family. FEBS J. 283:1404–1429. 10.1111/febs.13600 - DOI - PubMed
    1. Amieux, P.S., Howe D.G., Knickerbocker H., Lee D.C., Su T., Laszlo G.S., Idzerda R.L., and McKnight G.S.. 2002. Increased basal cAMP-dependent protein kinase activity inhibits the formation of mesoderm-derived structures in the developing mouse embryo. J. Biol. Chem. 277:27294–27304. 10.1074/jbc.M200302200 - DOI - PubMed
    1. Anvarian, Z., Mykytyn K., Mukhopadhyay S., Pedersen L.B., and Christensen S.T.. 2019. Cellular signalling by primary cilia in development, organ function and disease. Nat. Rev. Nephrol. 15:199–219. 10.1038/s41581-019-0116-9 - DOI - PMC - PubMed
    1. Arveseth, C.D., Happ J.T., Hedeen D.S., Zhu J.-F., Capener J.L., Shaw D.K., Deshpande I., Liang J., Xu J., Stubben S.L., et al. . 2020. Smoothened Transduces Hedgehog Signals via Activity-Dependent Sequestration of PKA Catalytic Subunits. bioRxiv. doi: 10.1101/2020.07.01.183079 (Preprint posted July 2, 2020). - DOI - PMC - PubMed

Publication types

Substances