. 2021 Jul 6;186(3):1632-1644.
doi: 10.1093/plphys/kiab173.

SeedQuant: a deep learning-based tool for assessing stimulant and inhibitor activity on root parasitic seeds

Affiliations

SeedQuant: a deep learning-based tool for assessing stimulant and inhibitor activity on root parasitic seeds

Justine Braguy et al. Plant Physiol. .

Abstract

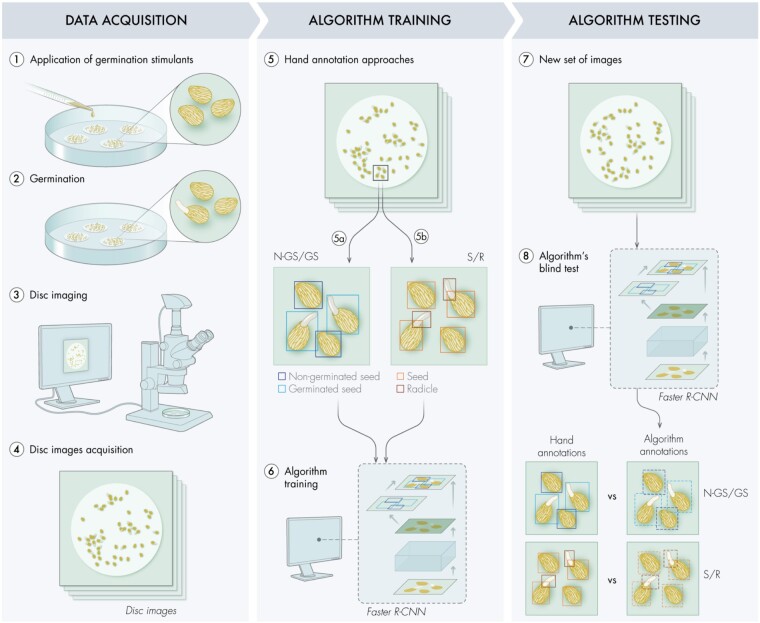
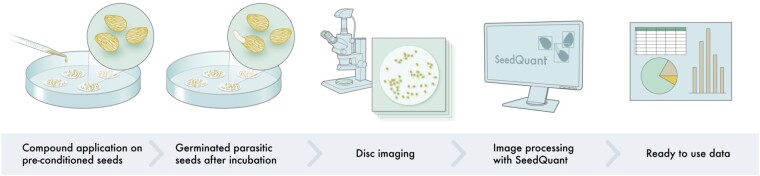
Witchweeds (Striga spp.) and broomrapes (Orobanchaceae and Phelipanche spp.) are root parasitic plants that infest many crops in warm and temperate zones, causing enormous yield losses and endangering global food security. Seeds of these obligate parasites require rhizospheric, host-released stimulants to germinate, which opens up possibilities for controlling them by applying specific germination inhibitors or synthetic stimulants that induce lethal germination in the host's absence. To determine their effect on germination, root exudates or synthetic stimulants/inhibitors are usually applied to parasitic seeds in in vitro bioassays, followed by assessment of germination ratios. Although these protocols are very sensitive, the germination recording process is laborious, representing a challenge for researchers and impeding high-throughput screens. Here, we developed an automatic seed census tool to count and discriminate germinated seeds (GS) from non-GS. We combined deep learning, a powerful data-driven framework that can accelerate the procedure and increase its accuracy, for object detection with computer vision latest development based on the Faster Region-based Convolutional Neural Network algorithm. Our method showed an accuracy of 94% in counting seeds of Striga hermonthica and reduced the required time from approximately 5 min to 5 s per image. Our proposed software, SeedQuant, will be of great help for seed germination bioassays and enable high-throughput screening for germination stimulants/inhibitors. SeedQuant is an open-source software that can be further trained to count different types of seeds for research purposes.


Figures

Figure 1
Figure 1
Pipeline for the algorithm development. Representation of the workflow to adapt an algorithm’s backbone for seed germination detection. During the data acquisition phase, germination stimulants were applied on preconditioned parasitic seeds (1), to trigger germination (2). Each disk, containing a mixture of GS and NGS, was placed under a binocular microscope mounted with a CCD camera for disk imaging (3–4). The acquired images were hand annotated (5) by placing tight bounding boxes around different objects following two classifications: (5a) NGSs/GSs and (5b) S/R. These annotated images were then analyzed by different Faster R-CNN backbones (6). Once the algorithm training is completed, a new set of images was provided to the different backbones for object detection (7). The algorithm annotations (NGS/GS and S/R), resulting from the blind test, were then compared with the hand annotations, performed simultaneously, to assess backbones performance (8).
Figure 2
Figure 2
Performance assessment for NGSs/GSs classification on Striga seeds images. A, Detection performance on 32 images of the different Faster-CNN backbones (R-50-C4, R-50-FPN, R-101-FPN, ResNeXt-101) representing the accuracy (in percentage) of the predicted bounding box position in comparison to the hand annotated one (GT), estimated by the AP represented as bars with error bars that indicate standard error. The horizontal bar is representing the mAP for each backbone and its corresponding value can be found in the table below. B, Counting performance on 32 images of the different Faster-CNN backbones (R-50-C4, R-50-FPN, R-101-FPN, ResNeXt-101) in comparison to the hand counting of NGS/GS objects, estimated by the absolute error (AE). AE represents the percentage of count errors made by the different algorithms and is represented as bars with error bars that indicate standard error. The horizontal bar represents the mAE for each backbone and its corresponding value can be found in the table below. C, Visualization of the resulting bounding boxes for GS (light blue) and NGS (dark blue) on a disk image placed by (upper) the backbone R-50-C4 (algorithm prediction) versus (lower) the hand annotations (GT). D, Close up of the squares indicated on C, showing the variation of the annotation between GT (black bounding boxes) versus R-50-C4 prediction (GS in light blue, NGS in dark blue) on the same picture area.
Figure 3
Figure 3
Performance assessment for S/R classification on Striga seeds images. A, Detection performance on 32 images of the different Faster-CNN backbones (R-50-C4, R-50-FPN, R-101-FPN, ResNeXt-101) representing the accuracy of the predicted bounding box position in comparison to the hand annotated one (GT), estimated by the AP in percentage represented as bars with error bars that indicate standard error. The horizontal bar represents the mAP for each backbone and its corresponding value can be found in the table below. B, Counting performance on 32 images of the different Faster-CNN backbones (R-50-C4, R-50-FPN, R-101-FPN, ResNeXt-101) in comparison to the hand counting of S/R objects, estimated by the absolute error (AE) percentage represented as bars with error bars that indicate standard error. The horizontal bar represents the mAE for each backbone. C, Visualization of the resulting bounding boxes for R (dark red) and S (light red) on a disk image placed by (upper) the backbone R-50-C4 (algorithm prediction) versus (lower) GT. D, Zoom in of the squares indicated on C, showing the variation of the annotation between GT (black bounding boxes) versus R-50-C4 prediction (R in dark red and S in light red) on the same area.
Figure 4
Figure 4
Generalization capabilities of the developed object detection algorithm for measuring germination of other parasitic seeds. A, Assessment of the performance of SeedQuant backbone (R-50-C4, developed on Striga seeds) on O. ramosa, P. cumana, and P. aegyptiaca seeds images (32 images for each seed type), in comparison with the hand annotations for the S/R (seed/radicle) annotation approach. Evaluation of (upper) the detection performances and (lower) the counting performances. The horizontal bars on the bar graphs represent the mAE/mAP, respectively, for each architecture and its corresponding value is reported in the table below. The error bars that indicate standard error. B, (1) Visualization of the P. aegyptiaca seeds morphology (nongerminated indicated by an arrow), showing their extra morphological structure, in comparison with (2) Striga seeds. Visualization of the bounding boxes placed by hand (3) and by the R-40-C4 algorithm (4) (seeds in light red, radicle in dark red). The direct processing of the P. aegyptiaca images by the Striga-based algorithm led to a lot of false positives in radicle detection, as the presence of the additional white part of the seed coat was classified as a very short radicle. C, Assessment of the counting performance of the different Faster-CNN backbone architectures (R-50-C4, R-50-FPN, R-101-FPN, ResNeXt-101) used for SeedQuant development on P. aegyptiaca seeds, based on the S/R object classification: (upper) prior fine-tuning on 32 images and (lower) after fine-tuning on 30 images, using 31 P. aegyptiaca seeds images for an additional training. The horizontal bars on the bar graphs represent the mean value of each architecture, its corresponding value is reported in the table below. The error bars that indicate standard error.
Figure 5
Figure 5
Proposed workflow for seed germination stimulants/inhibitors studies using SeedQuant. Stimulants or inhibitors are applied to preconditioned seeds, placed on small (9 mm) glass fiber filter paper disks. After incubation, the disks are imaged under a binocular microscope mounted by a charge-coupled device (CCD) camera. In one click, the resulting pictures are processed by SeedQuant, which renders the germination ratio for each picture. The data are then provided to the user in an easy-to-use format (.csv), allowing further data processing.

References

    1. Aly R (2012) Advanced technologies for parasitic weed control. Weed Sci 60: 290–294
    1. Atera EA, Itoh K, Azuma T, Ishii T (2012) Farmers' perspectives on the biotic constraint of Striga hermonthica and its control in western Kenya. Weed Biol Manag 12: 53–62
    1. Bengio Y, Courville A, Vincent P (2013) Representation learning: a review and new perspectives. IEEE Trans Pattern Anal Mach Intell 35: 1798–1828 - PubMed
    1. Bouwmeester HJ, Matusova R, Sun ZK, Beale MH (2003) Secondary metabolite signaling in host-parasitic plant interactions. Curr Opin Plant Biol 6: 358–364 - PubMed
    1. Butler LG (1995) Chemical Communication Between the Parasitic Weed Striga and its Crop Host: A New Dimension in Allelochemistry. ACS Publications, Washington, DC

Publication types

MeSH terms