. 2021 May 7;20(5):2780-2795.
doi: 10.1021/acs.jproteome.1c00049. Epub 2021 Apr 15.

Enhancing Top-Down Proteomics of Brain Tissue with FAIMS

Affiliations

Enhancing Top-Down Proteomics of Brain Tissue with FAIMS

James M Fulcher et al. J Proteome Res. .

Abstract

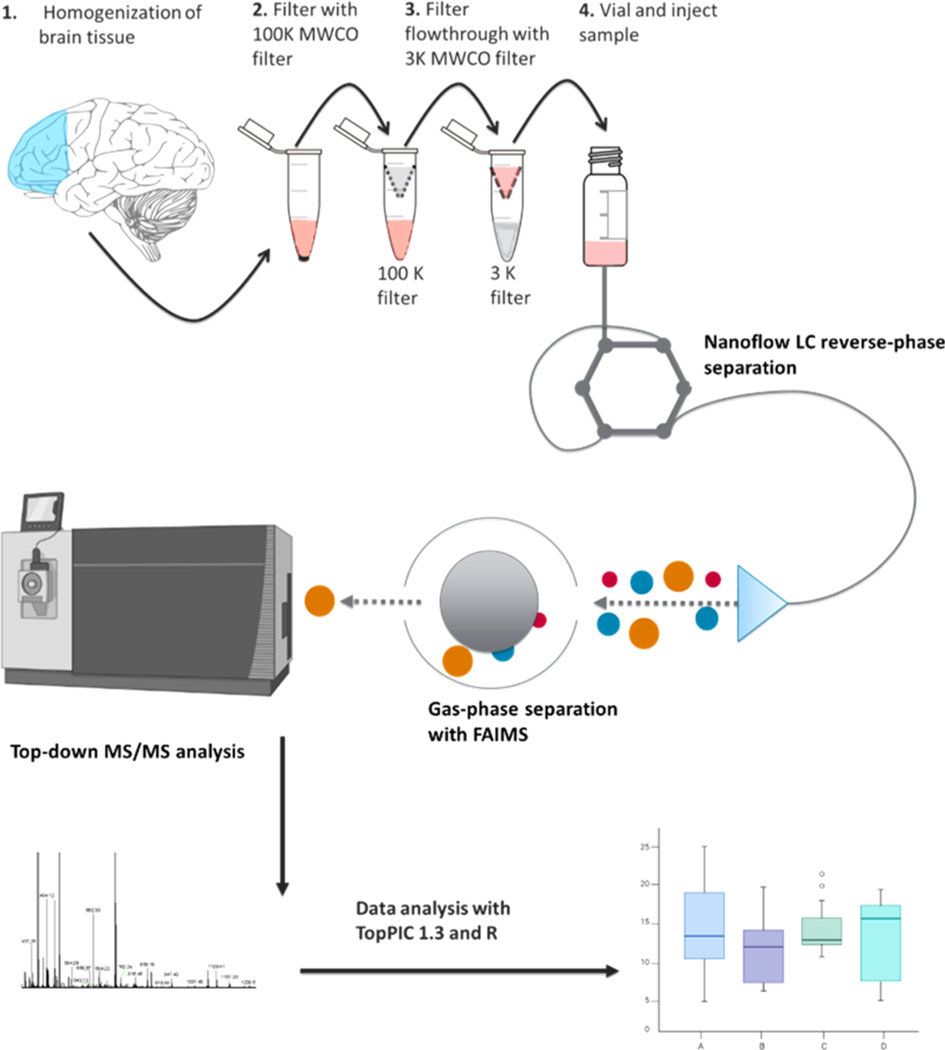
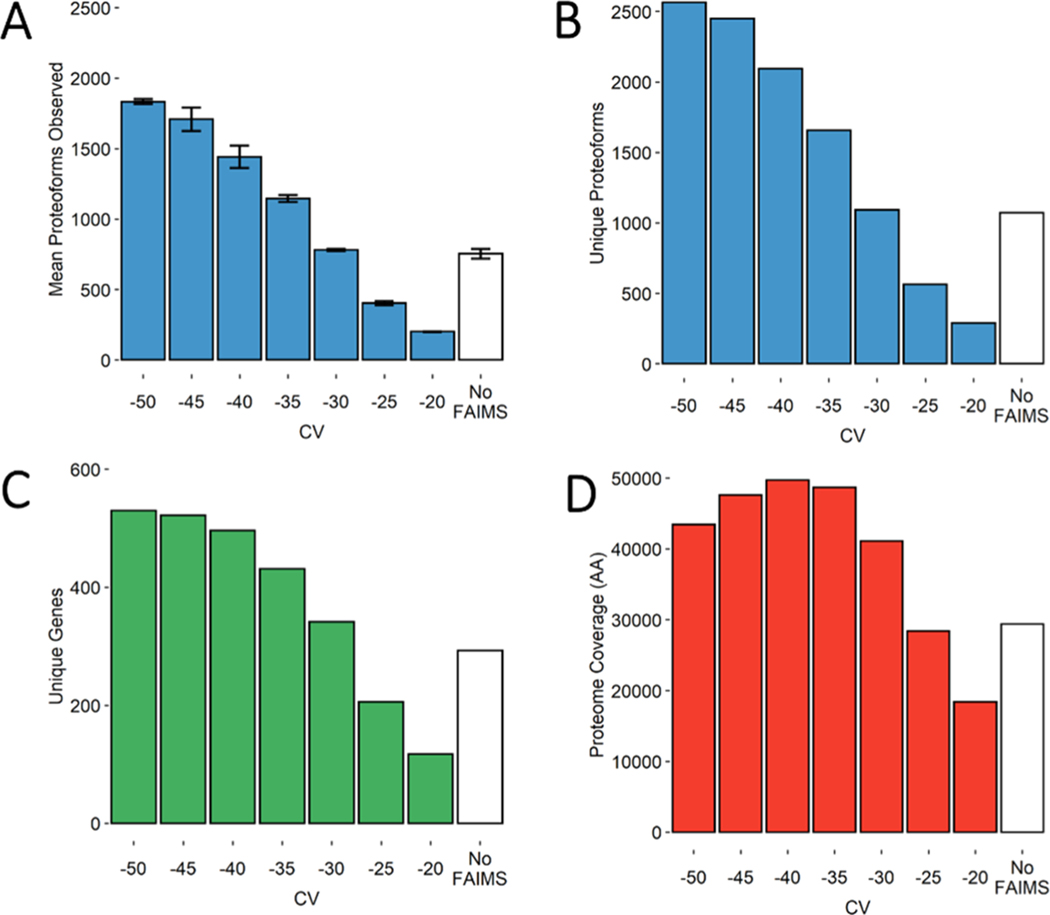
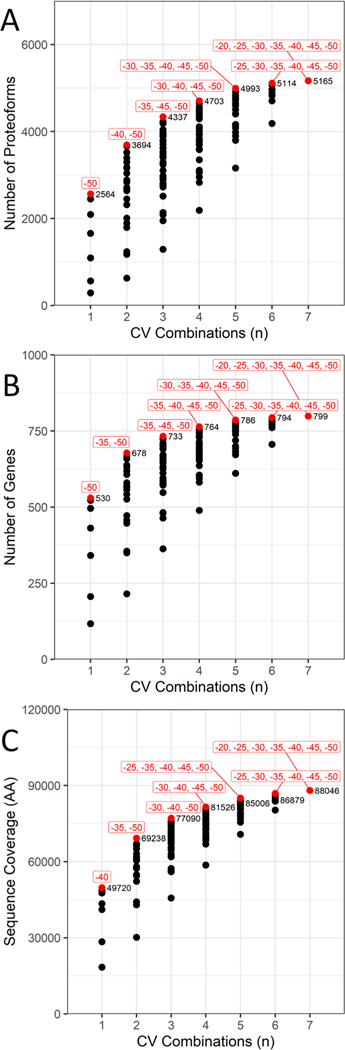
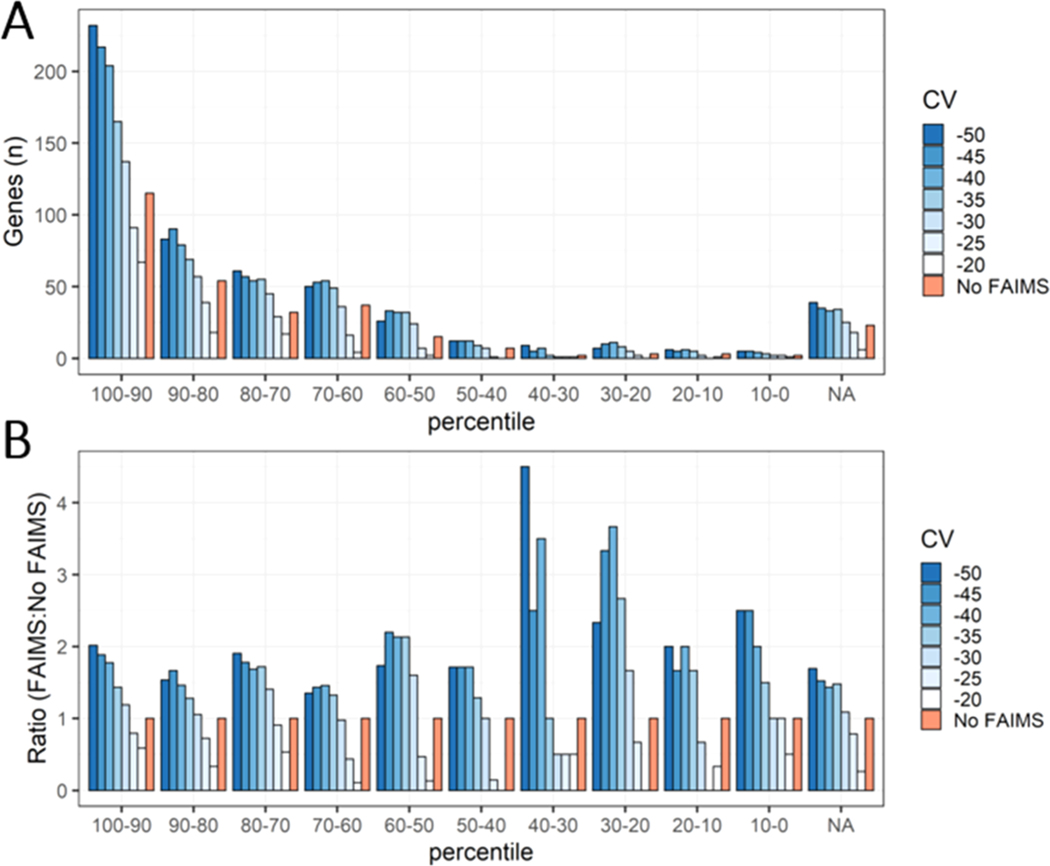
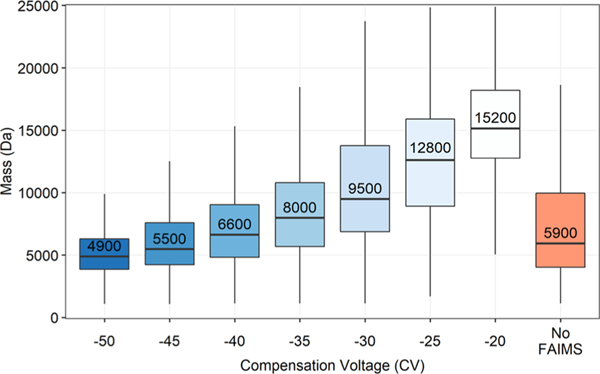
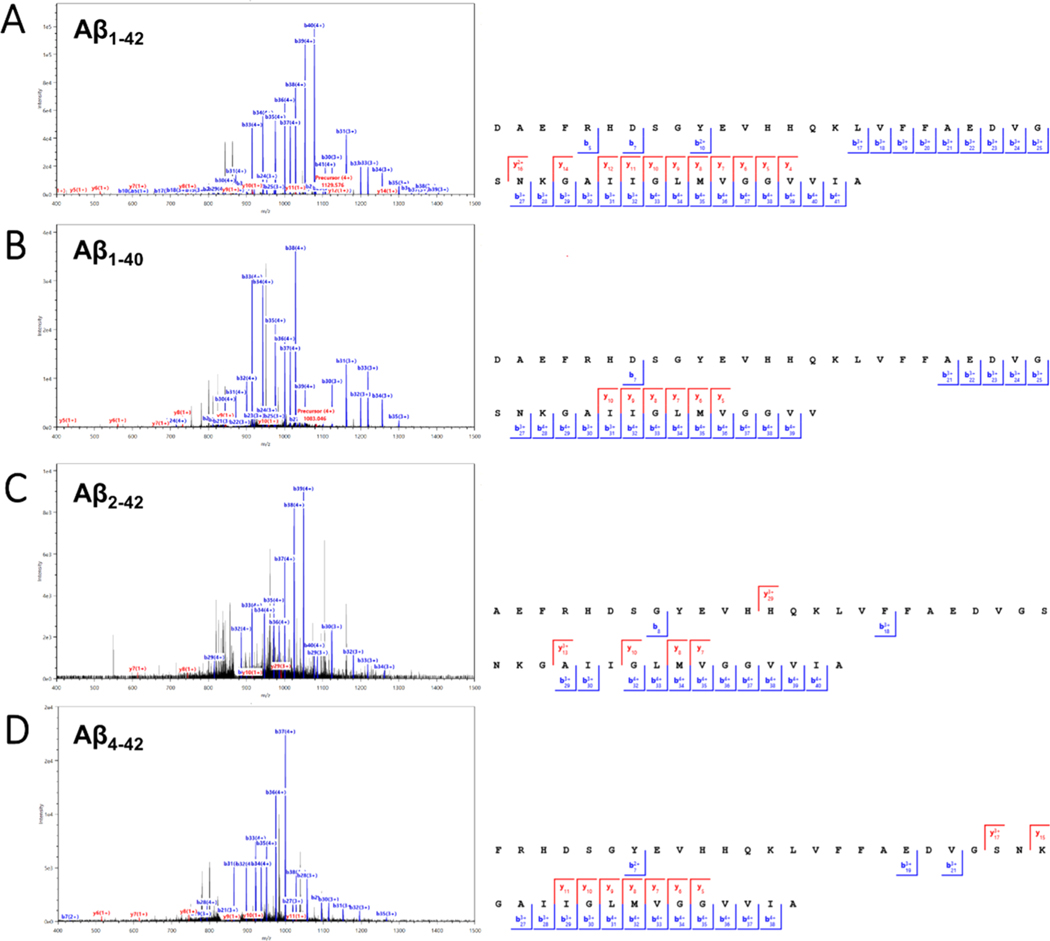
Proteomic investigations of Alzheimer's and Parkinson's disease have provided valuable insights into neurodegenerative disorders. Thus far, these investigations have largely been restricted to bottom-up approaches, hindering the degree to which one can characterize a protein's "intact" state. Top-down proteomics (TDP) overcomes this limitation; however, it is typically limited to observing only the most abundant proteoforms and of a relatively small size. Therefore, fractionation techniques are commonly used to reduce sample complexity. Here, we investigate gas-phase fractionation through high-field asymmetric waveform ion mobility spectrometry (FAIMS) within TDP. Utilizing a high complexity sample derived from Alzheimer's disease (AD) brain tissue, we describe how the addition of FAIMS to TDP can robustly improve the depth of proteome coverage. For example, implementation of FAIMS with external compensation voltage (CV) stepping at -50, -40, and -30 CV could more than double the mean number of non-redundant proteoforms, genes, and proteome sequence coverage compared to without FAIMS. We also found that FAIMS can influence the transmission of proteoforms and their charge envelopes based on their size. Importantly, FAIMS enabled the identification of intact amyloid beta (Aβ) proteoforms, including the aggregation-prone Aβ1-42 variant which is strongly linked to AD. Raw data and associated files have been deposited to the ProteomeXchange Consortium via the MassIVE data repository with data set identifier PXD023607.

Keywords: Alzheimer’s; FAIMS; brain tissue; differential mobility spectrometry; ion mobility; top-down proteomics.


Conflict of interest statement

The authors declare no competing financial interest.

Figures

Figure 1.
Figure 1.
Workflow demonstrating sample preparation, LC–MS, FAIMS-TDP, and data analysis with TopPIC/R.
Figure 2.
Figure 2.
Bar charts demonstrating several metrics used in the comparison of FAIMS CVs in steps of 5 V with “No FAIMS” data sets. (A) Mean number of proteoform identifications per replicate (n = 3). Error bars represent standard deviation from the mean. (B) Total unique proteoforms found across all three replicates for each FAIMS CV or “No FAIMS”. (C) Total unique genes found across all three replicates for each FAIMS CV or “No FAIMS”. (D) Total proteome coverage or non-redundant amino acids covered by each proteoform’s sequence, found across all three replicates for each FAIMS CV or “No FAIMS”.
Figure 3.
Figure 3.
Boxplot displaying the distributions of the RSDs determined from the feature intensities of proteoforms found in FAIMS and “No FAIMS” replicates. The median RSD for each condition is written within the upper box, above the line indicating its position. The upper and lower hinges correspond to the first and third quartiles (25th and 75th percentiles), while the upper and lower whiskers represent 1.5 times the interquartile range (IQR). Outliers beyond the whiskers are not plotted.
Figure 4.
Figure 4.
Heatmap generated in R comparing the overlap coefficients of each CV replicate based on proteoforms identified with TopPIC. White lines separate replicates, while black lines separate different CVs. Mean overlap coefficients of each CV’s replicates are shown in the middle block of the CVs being compared. White text color is used on overlap coefficients ≥0.5 and black text color <0.5 to improve visibility.
Figure 5.
Figure 5.
Combinatorial analysis of FAIMS CVs with regard to (A) number of proteoforms, (B) number of genes, and (C) sequence coverage. For each combination, the highest number plotted is highlighted in red and labeled with the CVs for that specific combination.
Figure 6.
Figure 6.
Bottom-up data sets from human brain tissue were used to estimate protein abundance by weighted spectral counting. These proteins were then binned into 10 different abundance percentiles, as well as a top-down only bin indicated as “NA”. (A) Comparison between the genes found in FAIMS and “No FAIMS” data sets across the 10 different abundance percentiles, as well as genes only found from our top-down analysis. (B) The number of genes for each FAIMS CV was normalized to the number of genes found in the “No FAIMS” data sets for each abundance percentile bin.
Figure 7.
Figure 7.
Boxplot displaying distributions of proteoform masses identified with TopPIC against tested FAIMS CVs. Each distribution includes only non-redundant proteoforms found within all three replicates. The median proteoform mass for each condition is written within the upper box, above the line indicating its position. The upper and lower hinges correspond to the first and third quartiles (25th and 75th percentiles), while the upper and lower whiskers represent 1.5 times the IQR. Outliers beyond the whiskers are not plotted.
Figure 8.
Figure 8.
Heatmap of the median PrSM charge states from seven proteoforms identified across the −50 to −20 CV range, filtered by ≥4 PrSMs in order to increase the confidence in identifications and provide a reasonable estimate of the median charge state. The median PrSM charge state is shown within each block, while the deviation of the PrSM charge state is indicated in red (increasing) or blue (decreasing) relative to −50 CV. Proteoforms on the x-axis are written as the gene name, starting amino acid, and ending amino acid.
Figure 9.
Figure 9.
Sequence maps of (A) tubulin alpha-1B chain (TUBA1B) and (B) synapsin-1 (SYN1). Each colored segment represents a proteoform with a unique amino acid start and end site. Color scale represents the number of observed PrSMs that can be mapped to the corresponding segment. Unknown mass shifts were not utilized in this analysis.
Figure 10.
Figure 10.
(A) Schematic representation of selected tau fragments with the number of PrSMs that unambiguously identify 0/1N or 3/4R tau. 0N and 1N fragments are being shown as sharing the same KKVAV residues at their C-terminus, while 3R and 4R proteoforms share VRTPP at their N-terminus. Residues underlined are the KVAVVR hexapeptide sequence in the second proline-rich region of tau which is cleaved at proteolytic cleavage site #1. The 3R and 4R hexapeptide motifs are not shown but are both cleaved at proteolytic cleavage site #2. (B) Sequence coverage map of MAPT 1N3R (Tau-B) showing all proteoforms that could be mapped to this isoform with a unique amino acid start and end site. Red lines at the bottom represent the positions of proteolytic cleavage sites #1 and #2. Color scale represents the number of observed PrSMs that can be mapped to the corresponding segment. Unknown mass shifts were not utilized in this analysis.
Figure 11.
Figure 11.
Representative MS2 spectra and MS2 fragment ion coverage maps with matched b and y ions of the 5+ charge state of four Aβ proteoforms: (A) Aβ1–42 from 903.663 m/z precursor with 68.3% sequence coverage (43 PrSMs). (B) Aβ1–40 from 866.4374 m/z precursor with 48.7% sequence coverage (6 PrSMs). (C) Aβ2–42 from 880.6570 m/z precursor with 40.0% sequence coverage (3 PrSMs). (D) Aβ4–42 from 840.6410 m/z precursor with 44.7% sequence coverage (4 PrSMs).

Similar articles

Cited by

References

    1. Nichols E; Szoeke CEI; Vollset SE; Abbasi N; Abd-Allah F; Abdela J; Aichour MTE; Akinyemi RO; Alahdab F; Asgedom SW; Awasthi A; Barker-Collo SL; Baune BT; Béjot Y; Belachew AB; Bennett DA; Biadgo B; Bijani A; Bin Sayeed MS; Brayne C; Carpenter DO; Carvalho F; Catalá-López F; Cerin E; Choi J-YJ; Dang AK; Degefa MG; Djalalinia S; Dubey M; Duken EE; Edvardsson D; Endres M; Eskandarieh S; Faro A; Farzadfar F; Fereshtehnejad S-M; Fernandes E; Filip I; Fischer F; Gebre AK; Geremew D; Ghasemi-Kasman M; Gnedovskaya EV; Gupta R; Hachinski V; Hagos TB; Hamidi S; Hankey GJ; Haro JM; Hay SI; Irvani SSN; Jha RP; Jonas JB; Kalani R; Karch A; Kasaeian A; Khader YS; Khalil IA; Khan EA; Khanna T; Khoja TAM; Khubchandani J; Kisa A; Kissimova-Skarbek K; Kivimäki M; Koyanagi A; Krohn KJ; Logroscino G; Lorkowski S; Majdan M; Malekzadeh R; März W; Massano J; Mengistu G; Meretoja A; Mohammadi M; Mohammadi-Khanaposhtani M; Mokdad AH; Mondello S; Moradi G; Nagel G; Naghavi M; Naik G; Nguyen LH; Nguyen TH; Nirayo YL; Nixon MR; Ofori-Asenso R; Ogbo FA; Olagunju AT; Owolabi MO; Panda-Jonas S; Passos V. M. d. A.; Pereira DM; Pinilla-Monsalve GD; Piradov MA; Pond CD; Poustchi H; Qorbani M; Radfar A; Reiner RC; Robinson SR; Roshandel G; Rostami A; Russ TC; Sachdev PS; Safari H; Safiri S; Sahathevan R; Salimi Y; Satpathy M; Sawhney M; Saylan M; Sepanlou SG; Shafieesabet A; Shaikh MA; Sahraian MA; Shigematsu M; Shiri R; Shiue I; Silva JP; Smith M; Sobhani S; Stein DJ; Tabarés-Seisdedos R; Tovani-Palone MR; Tran BX; Tran TT; Tsegay AT; Ullah I; Venketasubramanian N; Vlassov V; Wang Y-P; Weiss J; Westerman R; Wijeratne T; Wyper GMA; Yano Y; Yimer EM; Yonemoto N; Yousefifard M; Zaidi Z; Zare Z; Vos T; Feigin VL; Murray CJL Global, regional, and national burden of Alzheimer’s disease and other dementias, 1990–2016: a systematic analysis for the Global Burden of Disease Study 2016. Lancet Neurol. 2019, 18, 88–106. - PMC - PubMed
    1. Beyreuther K; Masters CL Amyloid precursor protein (APP) and beta A4 amyloid in the etiology of Alzheimer’s disease: precursor-product relationships in the derangement of neuronal function. Brain Pathol. 1991, 1, 241–251. - PubMed
    1. Hardy J; Higgins G. Alzheimer’s disease: the amyloid cascade hypothesis. Science 1992, 256, 184–185. - PubMed
    1. Goedert M. Tau protein and the neurofibrillary pathology of Alzheimer’s disease. Trends Neurosci. 1993, 16, 460–465. - PubMed
    1. Iqbal K; Liu F; Gong C-X Tau and neurodegenerative disease: the story so far. Nat. Rev. Neurol. 2016, 12, 15–27. - PubMed

Publication types

LinkOut - more resources