

Stay-at-Home Orders, Mobility Patterns, and Spread of COVID-19
- PMID: 33856875
- PMCID: PMC8101571
- DOI: 10.2105/AJPH.2021.306209
Stay-at-Home Orders, Mobility Patterns, and Spread of COVID-19
Abstract
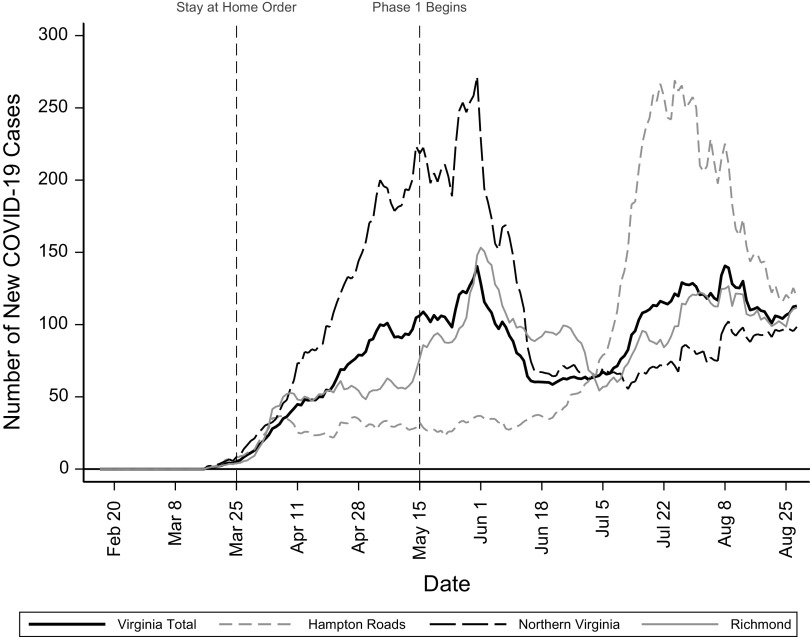
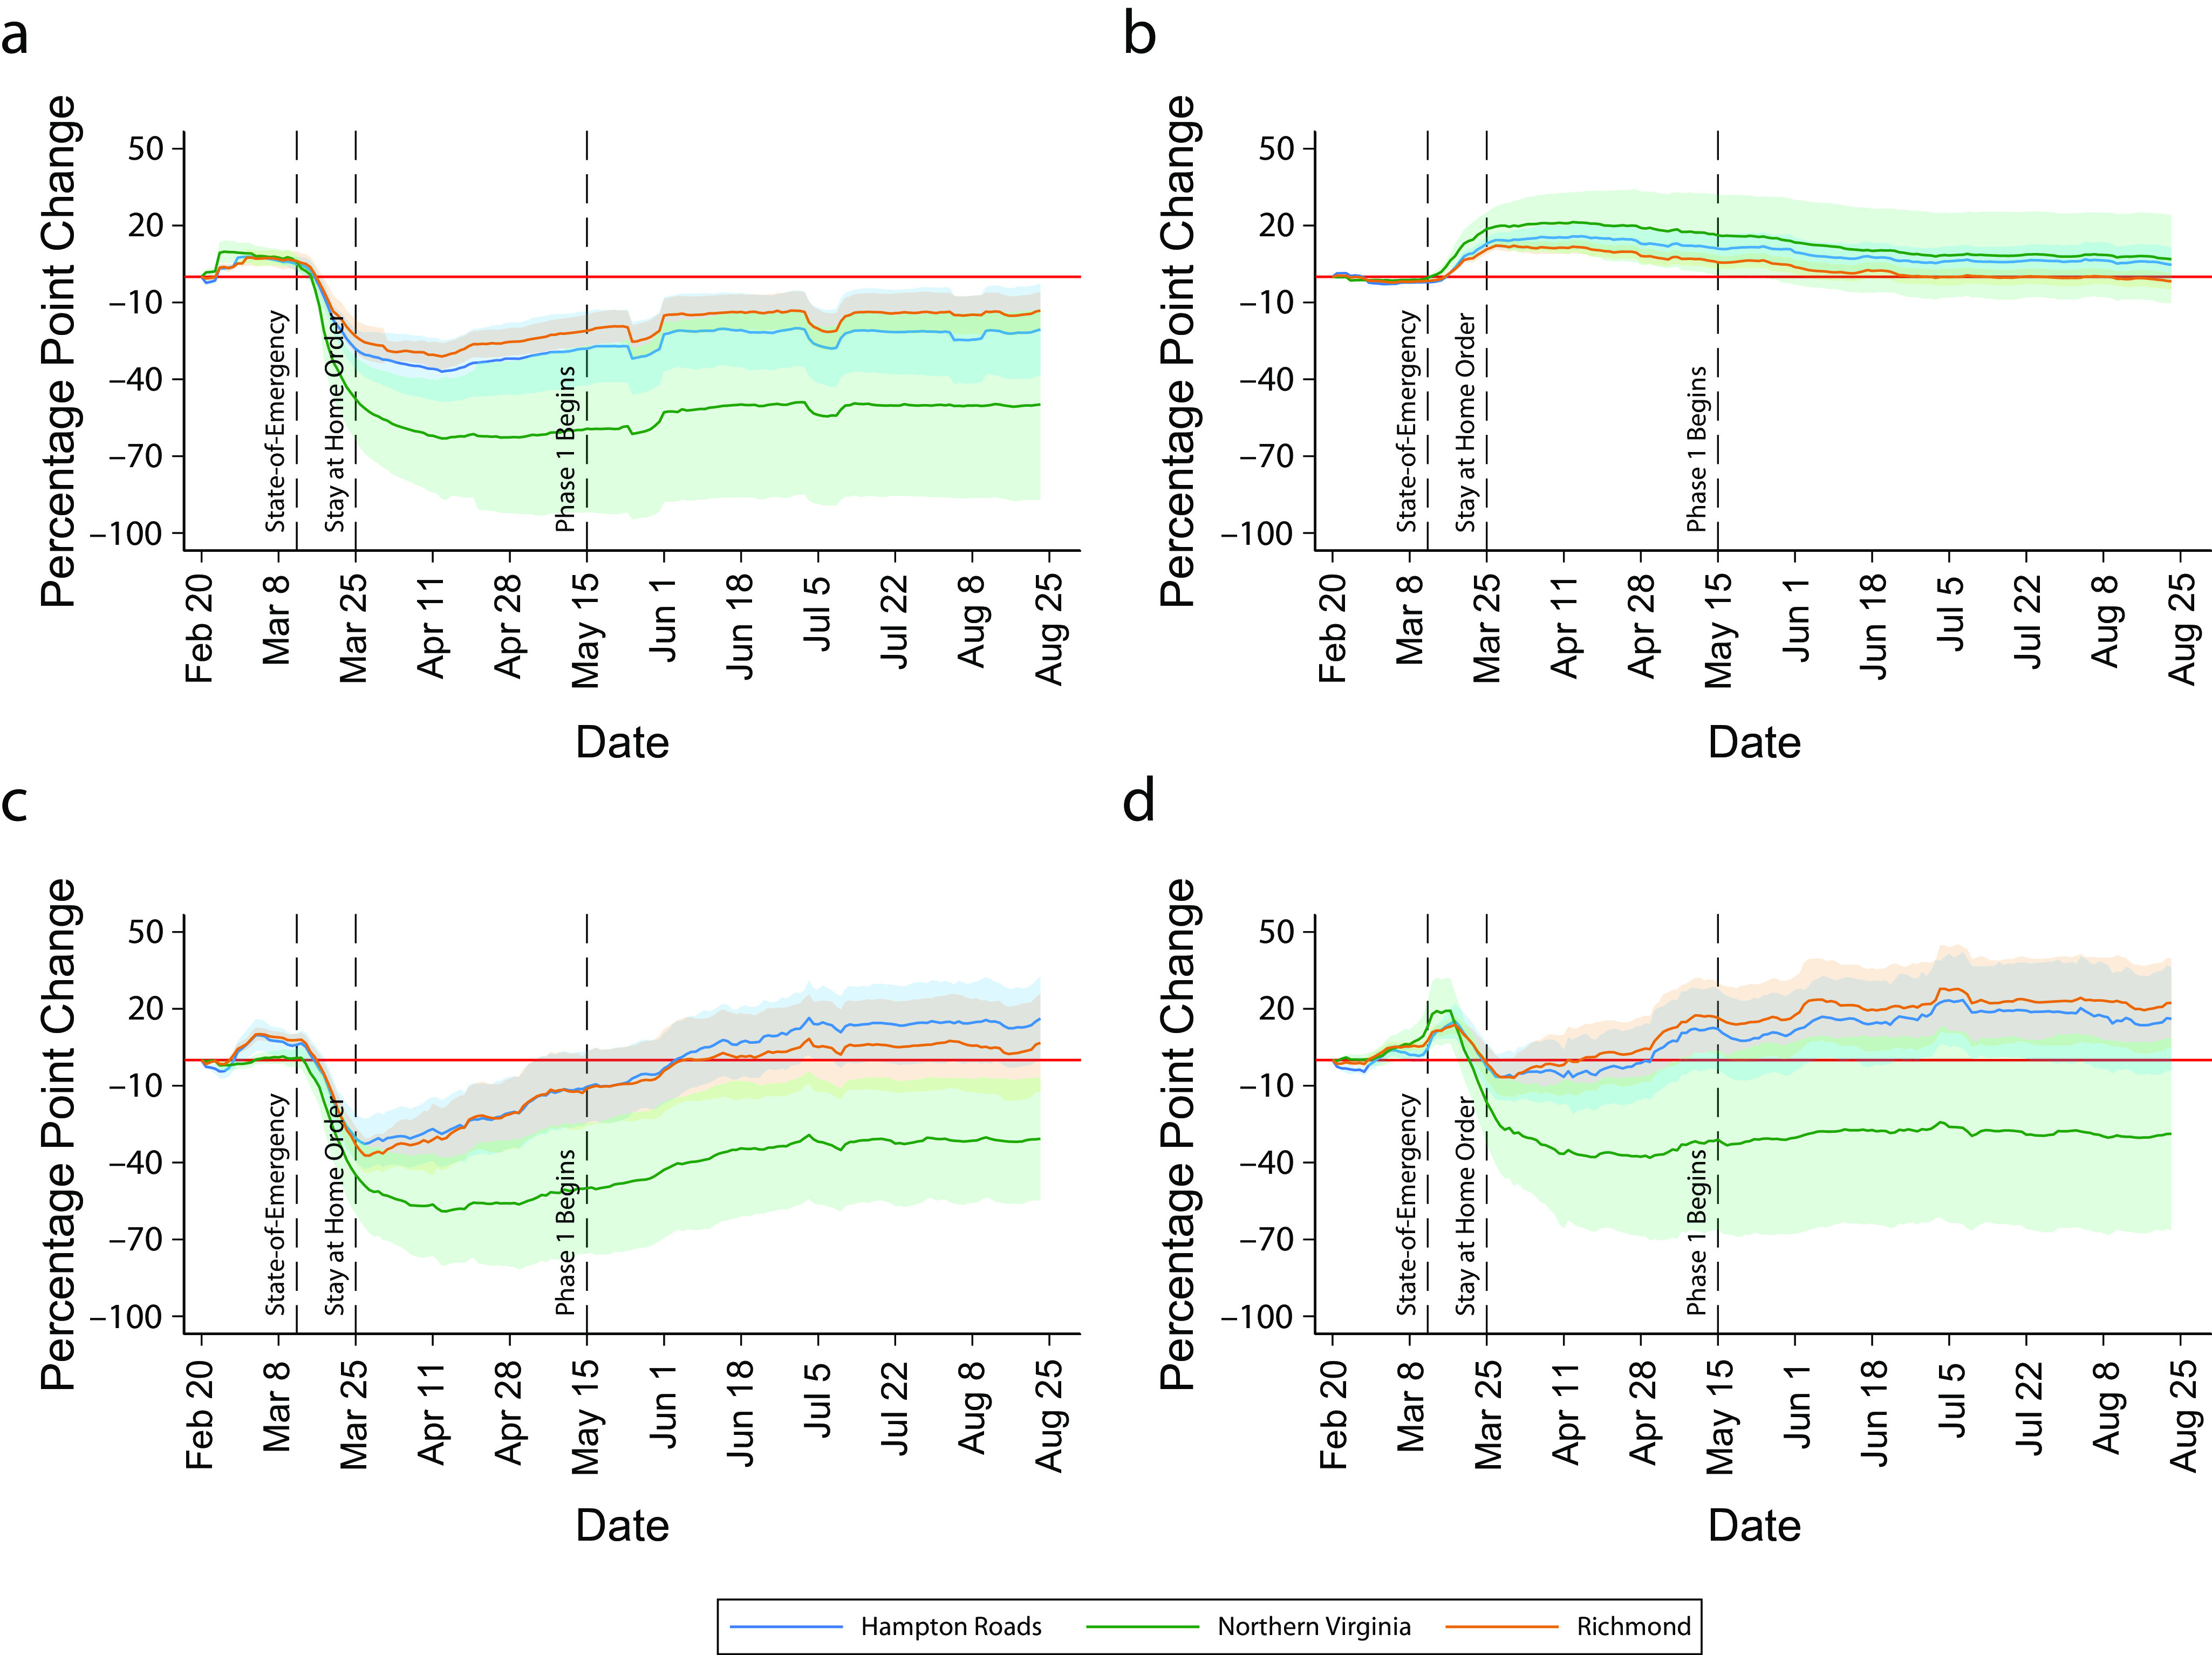
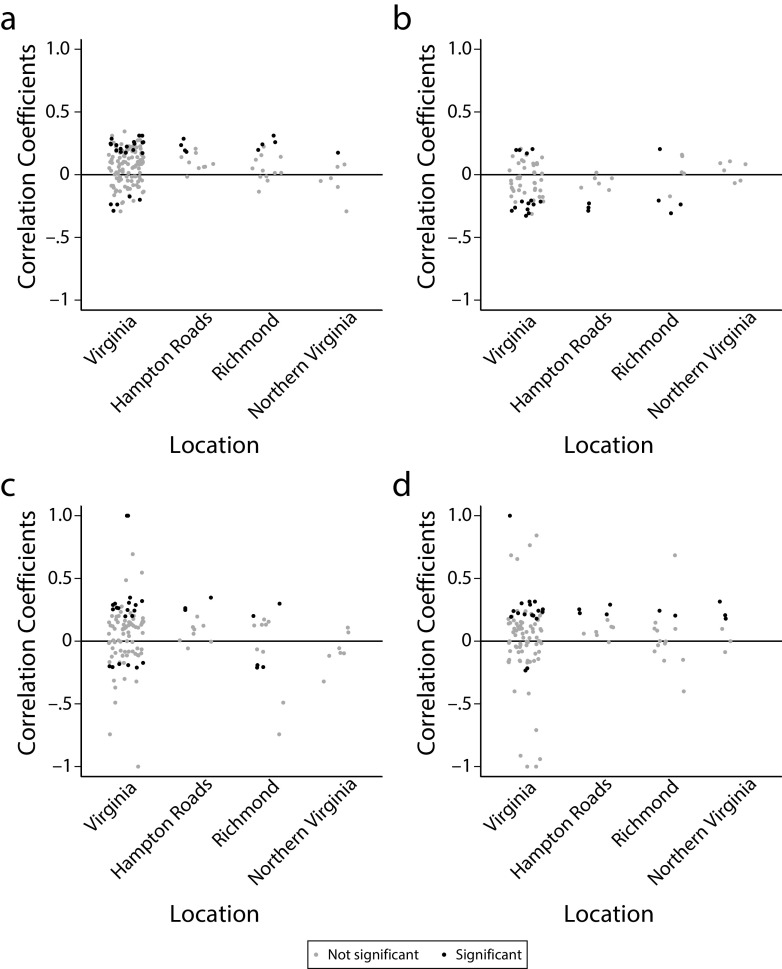
Objectives. To understand how stay-at-home orders changed mobility patterns and influenced the spread of COVID-19.Methods. I merged 2020 data from the Virginia Department of Health, Google Mobility Reports, and the US Census to estimate a series of 2-way fixed-effect event-study regression models.Results. A stay-at-home order caused people to increase the amount of time spent at home by 12 percentage points and decrease the time the spent at work by 30 percentage points, retail and recreation venues by 40 percentage points, and grocery stores and pharmacies by 10 percentage points. People did not sustain changes in mobility and gradually returned to prepandemic levels before the stay-at-home order was lifted. In areas where people spent the most time at indoor locations, there was a large increase in COVID-19.Conclusions. A more robust and stricter policy response coordinated at the national level combined with a strong economic response from policymakers could have increased the effectiveness of the stay-at-home order.
Figures

Comment in
-
Occupational Health Surveillance as a Tool for COVID-19 Prevention.Am J Public Health. 2021 Jun;111(6):999-1001. doi: 10.2105/AJPH.2021.306269. Am J Public Health. 2021. PMID: 33950719 Free PMC article. No abstract available.
References
-
- Fang H, Wang L, Yang Y. National Bureau of Economic Research Working Paper. 2020. Human mobility restrictions and the spread of the novel coronavirus (2019-ncov) in China; p. 27576. Available at: https://www.nber.org/papers/w26906. Accessed September 27, 2020. - PMC - PubMed
-
- US Census. QuickFacts. Available at: https://census.gov/quickfacts. Accessed September 27, 2020.
-
- Adalja AA, Watson M, Toner ES, Cicero A, Inglesby TV. The characteristics of pandemic pathogens. Johns Hopkins Bloomberg School of Public Health; 2018. Available at: https://www.centerforhealthsecurity.org/our-work/pubs_archive/pubs-pdfs/.... Accessed September 25, 2020.
-
- Rice G. Here we go again? A new pandemic of the 21st century. N Z Med J. 2020;133(1512):8–9. - PubMed
MeSH terms
LinkOut - more resources
Full Text Sources
Other Literature Sources
Medical
