

Accurate contact-based modelling of repeat proteins predicts the structure of new repeats protein families
- PMID: 33857128
- PMCID: PMC8078820
- DOI: 10.1371/journal.pcbi.1008798
Accurate contact-based modelling of repeat proteins predicts the structure of new repeats protein families
Abstract
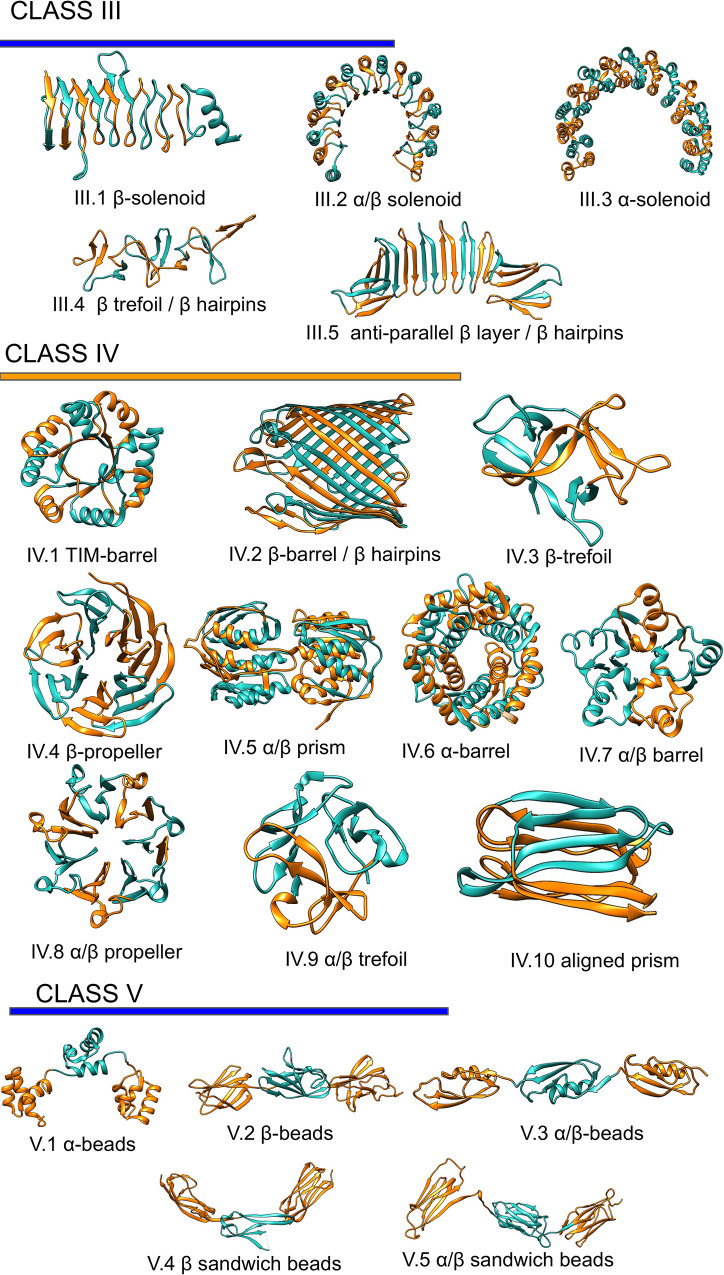
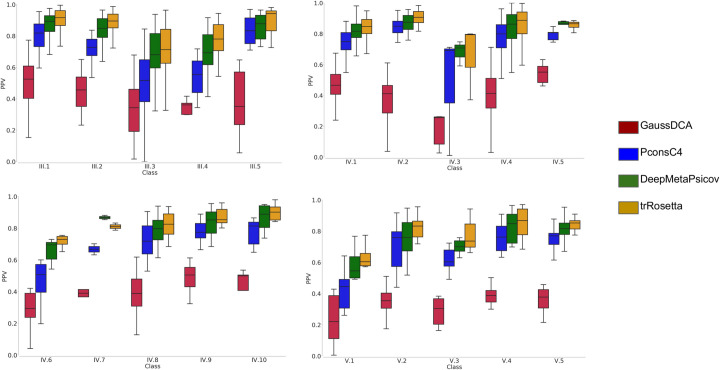
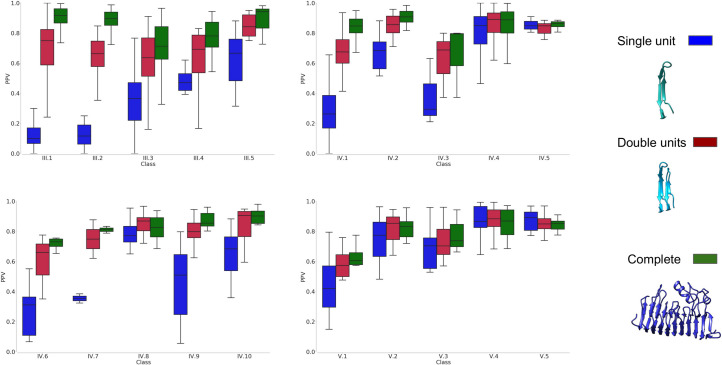
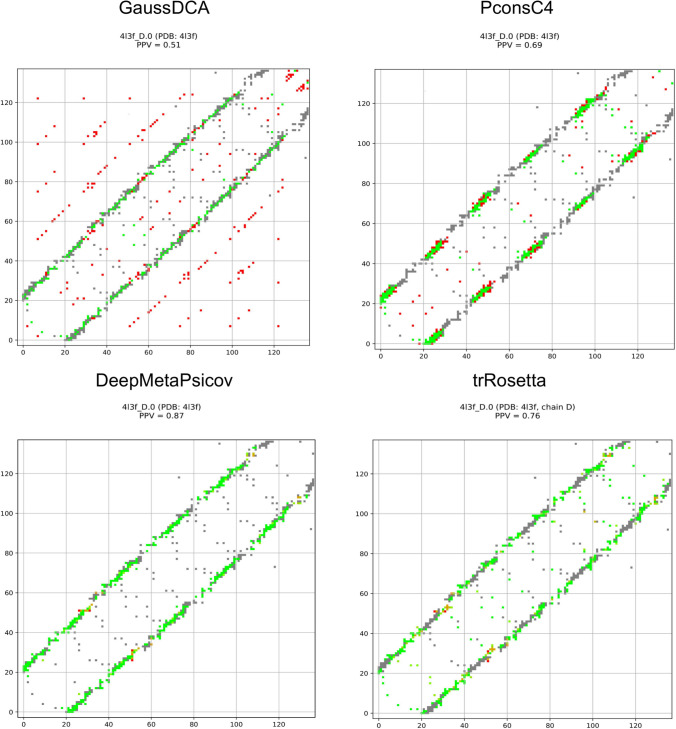
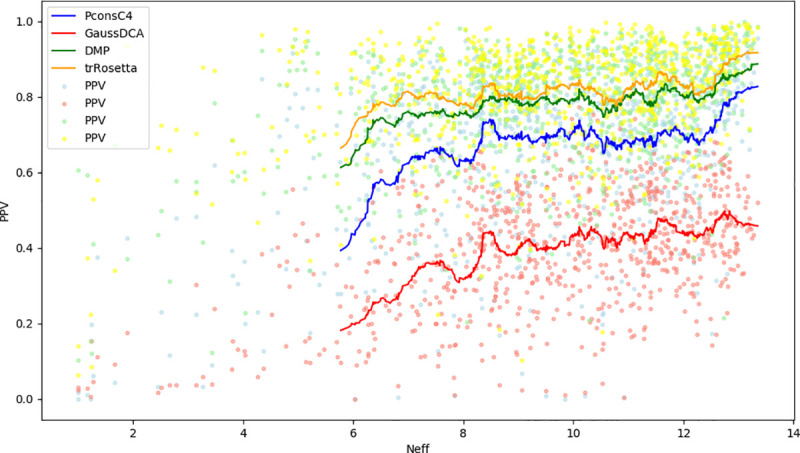
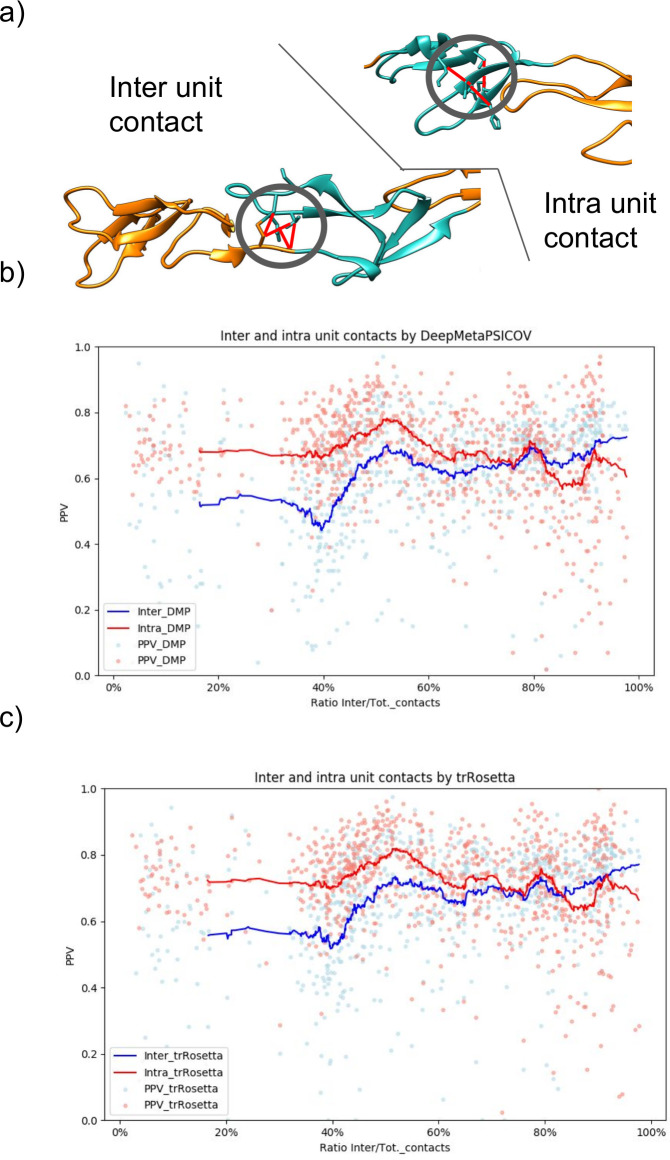
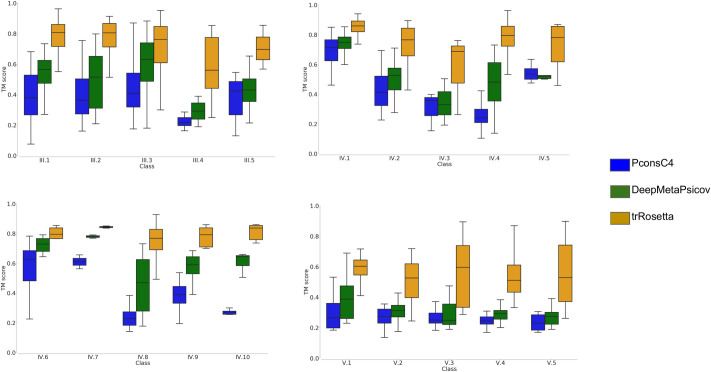
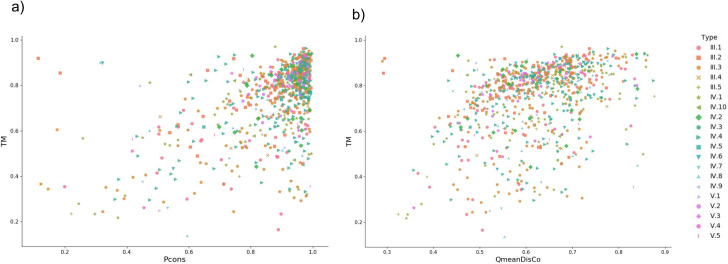
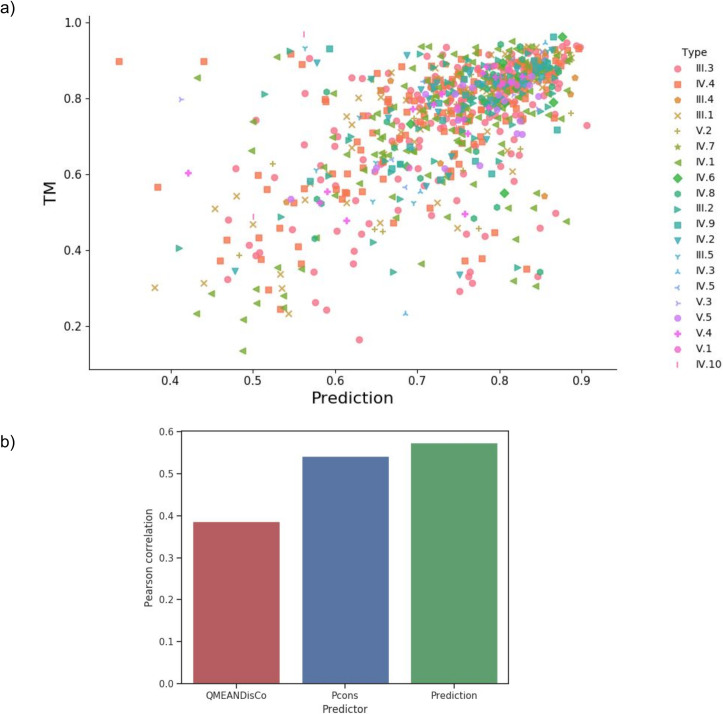
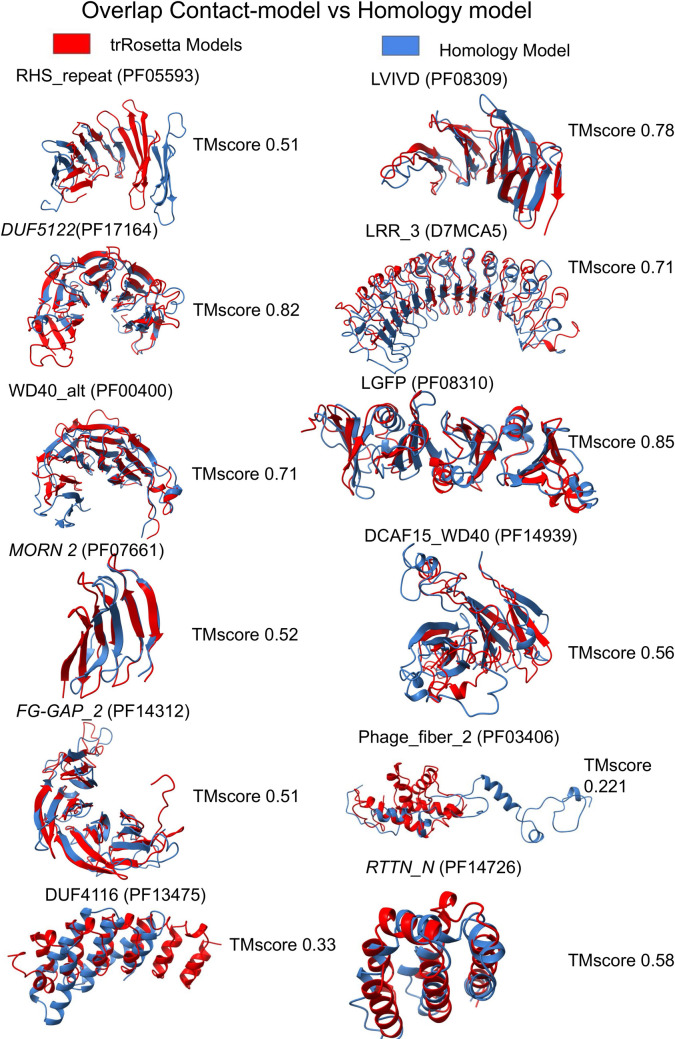
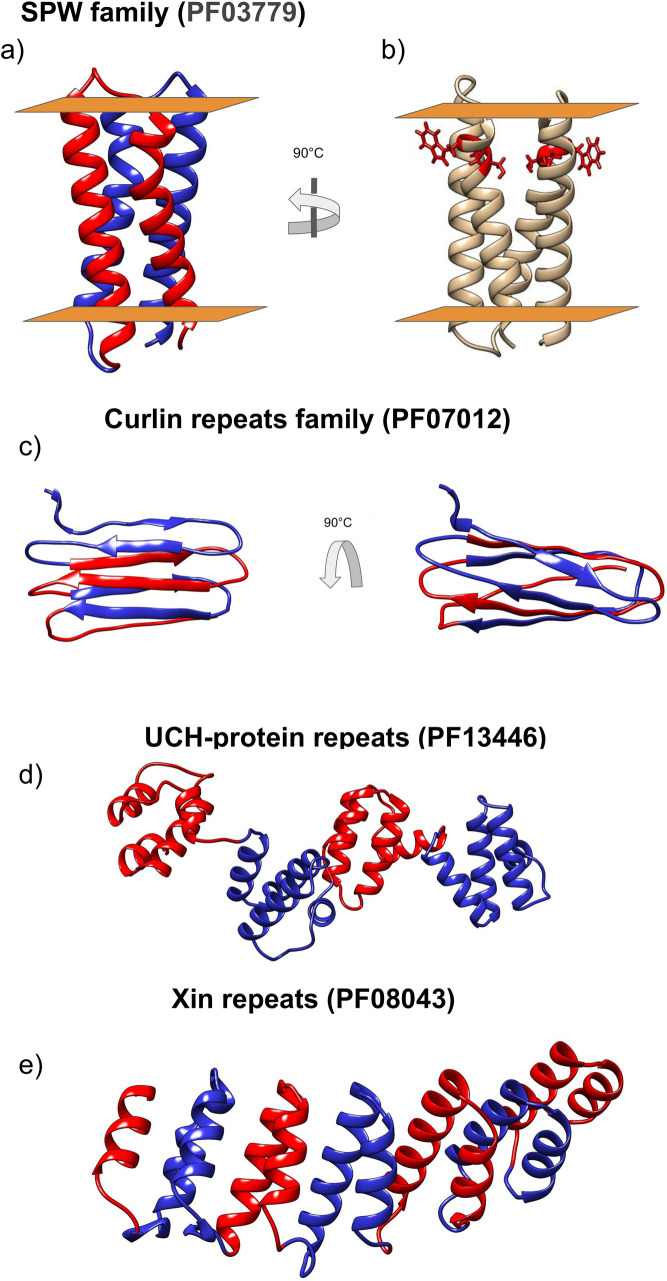
Repeat proteins are abundant in eukaryotic proteomes. They are involved in many eukaryotic specific functions, including signalling. For many of these proteins, the structure is not known, as they are difficult to crystallise. Today, using direct coupling analysis and deep learning it is often possible to predict a protein's structure. However, the unique sequence features present in repeat proteins have been a challenge to use direct coupling analysis for predicting contacts. Here, we show that deep learning-based methods (trRosetta, DeepMetaPsicov (DMP) and PconsC4) overcomes this problem and can predict intra- and inter-unit contacts in repeat proteins. In a benchmark dataset of 815 repeat proteins, about 90% can be correctly modelled. Further, among 48 PFAM families lacking a protein structure, we produce models of forty-one families with estimated high accuracy.
Conflict of interest statement
The authors have declared that no competing interests exist
Figures
Similar articles
-
The trRosetta server for fast and accurate protein structure prediction.Nat Protoc. 2021 Dec;16(12):5634-5651. doi: 10.1038/s41596-021-00628-9. Epub 2021 Nov 10. Nat Protoc. 2021. PMID: 34759384 Review.
-
Using PconsC4 and PconsFold2 to Predict Protein Structure.Curr Protoc Bioinformatics. 2019 Jun;66(1):e75. doi: 10.1002/cpbi.75. Epub 2019 May 7. Curr Protoc Bioinformatics. 2019. PMID: 31063641
-
Accurate De Novo Prediction of Protein Contact Map by Ultra-Deep Learning Model.PLoS Comput Biol. 2017 Jan 5;13(1):e1005324. doi: 10.1371/journal.pcbi.1005324. eCollection 2017 Jan. PLoS Comput Biol. 2017. PMID: 28056090 Free PMC article.
-
Large-scale structure prediction by improved contact predictions and model quality assessment.Bioinformatics. 2017 Jul 15;33(14):i23-i29. doi: 10.1093/bioinformatics/btx239. Bioinformatics. 2017. PMID: 28881974 Free PMC article.
-
Comparison of protein repeat classifications based on structure and sequence families.Biochem Soc Trans. 2015 Oct;43(5):832-7. doi: 10.1042/BST20150079. Biochem Soc Trans. 2015. PMID: 26517890 Review.
Cited by
-
Rare Variant Analysis and Molecular Dynamics Simulation in Alzheimer's Disease Identifies Exonic Variants in FLG.Genes (Basel). 2022 May 7;13(5):838. doi: 10.3390/genes13050838. Genes (Basel). 2022. PMID: 35627223 Free PMC article.
-
Gram-negative outer-membrane proteins with multiple β-barrel domains.Proc Natl Acad Sci U S A. 2021 Aug 3;118(31):e2104059118. doi: 10.1073/pnas.2104059118. Proc Natl Acad Sci U S A. 2021. PMID: 34330833 Free PMC article.
-
A Proposal for a Consolidated Structural Model of the CagY Protein of Helicobacter pylori.Int J Mol Sci. 2023 Nov 26;24(23):16781. doi: 10.3390/ijms242316781. Int J Mol Sci. 2023. PMID: 38069104 Free PMC article.
-
TRAL 2.0: Tandem Repeat Detection With Circular Profile Hidden Markov Models and Evolutionary Aligner.Front Bioinform. 2021 Jun 25;1:691865. doi: 10.3389/fbinf.2021.691865. eCollection 2021. Front Bioinform. 2021. PMID: 36303789 Free PMC article.
-
Recombination and lineage-specific mutations linked to the emergence of SARS-CoV-2.Genome Med. 2021 Aug 6;13(1):124. doi: 10.1186/s13073-021-00943-6. Genome Med. 2021. PMID: 34362430 Free PMC article.
References
Publication types
MeSH terms
Substances
LinkOut - more resources
Full Text Sources
Other Literature Sources
