. 2021 Apr 15;217(4):iyab017.
doi: 10.1093/genetics/iyab017.

N- and C-terminal Gln3-Tor1 interaction sites: one acting negatively and the other positively to regulate nuclear Gln3 localization

Affiliations

N- and C-terminal Gln3-Tor1 interaction sites: one acting negatively and the other positively to regulate nuclear Gln3 localization

Jennifer J Tate et al. Genetics. .

Abstract

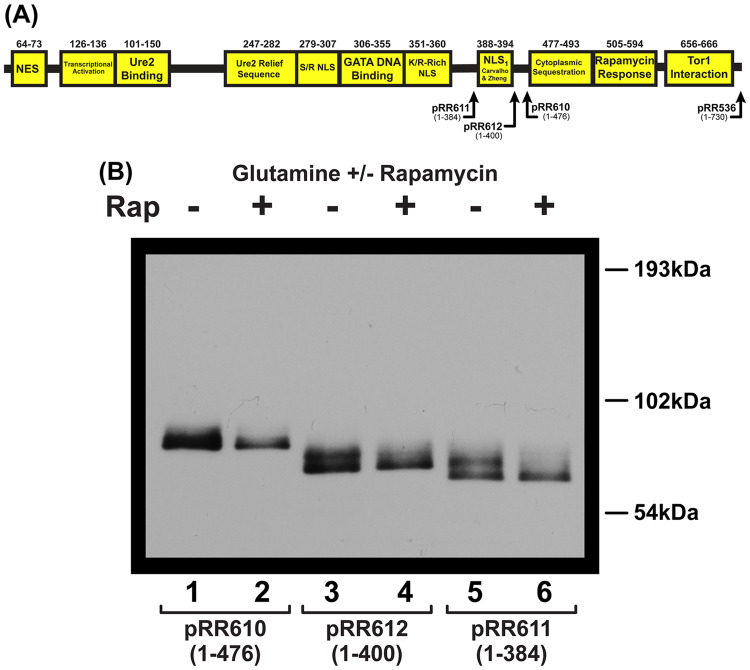
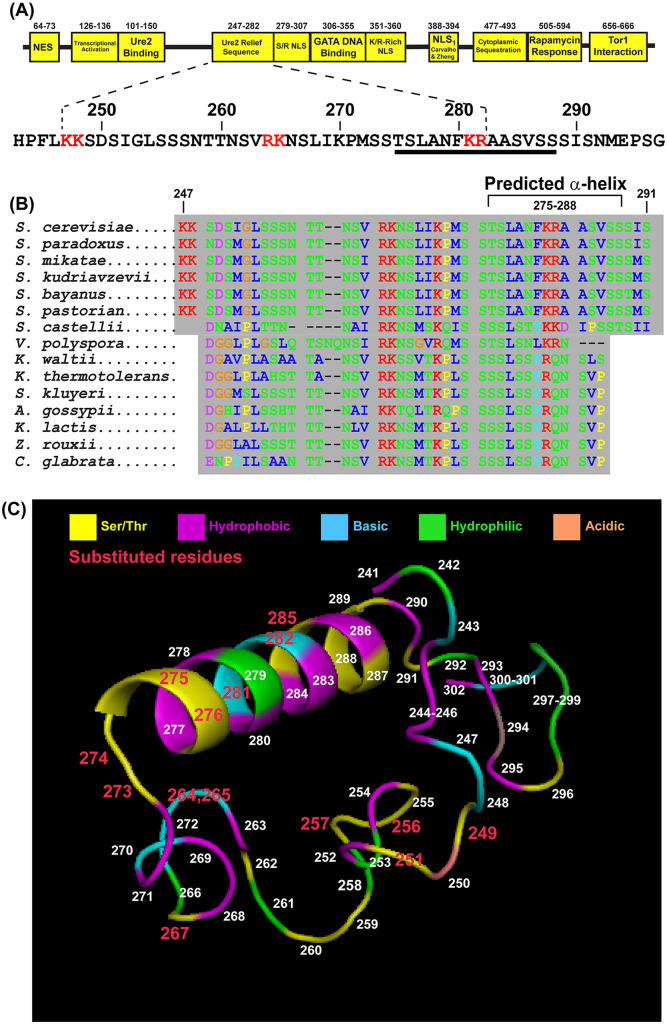
Gln3 activates Nitrogen Catabolite Repression, NCR-sensitive expression of the genes required for Saccharomyces cerevisiae to scavenge poor nitrogen sources from its environment. The global TorC1 kinase complex negatively regulates nuclear Gln3 localization, interacting with an α-helix in the C-terminal region of Gln3, Gln3656-666. In nitrogen replete conditions, Gln3 is sequestered in the cytoplasm, whereas when TorC1 is down-regulated, in nitrogen restrictive conditions, Gln3 migrates into the nucleus. In this work, we show that the C-terminal Gln3-Tor1 interaction site is required for wild type, rapamycin-elicited, Sit4-dependent nuclear Gln3 localization, but not for its dephosphorylation. In fact, truncated Gln31-384 can enter the nucleus in the absence of Sit4 in both repressive and derepressive growth conditions. However, Gln31-384 can only enter the nucleus if a newly discovered second positively-acting Gln3-Tor1 interaction site remains intact. Importantly, the N- and C-terminal Gln3-Tor1 interaction sites function both autonomously and collaboratively. The N-terminal Gln3-Tor1 interaction site, previously designated Gln3URS contains a predicted α-helix situated within an unstructured coiled-coil region. Eight of the thirteen serine/threonine residues in the Gln3URS are dephosphorylated 3-15-fold with three of them by 10-15-fold. Substituting phosphomimetic aspartate for serine/threonine residues in the Gln3 URS abolishes the N-terminal Gln3-Tor1 interaction, rapamycin-elicited nuclear Gln3 localization, and ½ of the derepressed levels of nuclear Gln3 localization. Cytoplasmic Gln3 sequestration in repressive conditions, however, remains intact. These findings further deconvolve the mechanisms that achieve nitrogen-responsive transcription factor regulation downstream of TorC1.

Keywords: Gln3; Nitrogen metabolism; Signal transduction; Sit4; TOR complex (TorC1); Transcription factors; URS.


Figures

Figure 1
Figure 1
Regulation of intracellular Gln3 by environmental conditions, regulatory proteins and inhibitors. (A) Green text indicates molecules or growth conditions that elicit or are required for nuclear Gln3 localization. Red text indicates molecules or growth conditions that prevent nuclear Gln3 localization. Green arrows and red bars indicate positive and negative regulation, respectively. (B) Phosphatase requirements for each condition to elicit nuclear Gln3 localization. A more detailed diagram appears in Figure 11 of Tate et al.(2019).
Figure 2
Figure 2
Comparison of rapamycin-elicited Gln3-Myc13 mutant protein localization and phosphorylation. (A) Diagram depicting Gln3 control elements, their amino acid positions and the C-terminal regions containing mutations found in plasmids pRR850, pRR1045 and pRR680. The substituted residues in these constructs are shown below the domain diagram. (B) This panel, with exception of the western blot of pRR1045, contains summaries of previously published experiments as noted in the right column of the panel. Electrophoretic mobility and localization of Gln3-Myc13 were determined using transformants of wild type strain JK9-3da. JK9-3da cells were transformed with the pRR536 (Wild type), pRR850, pRR1045 or pRR680. Transformants were grown in YNB-glutamine (Gln) medium to mid-log phase followed by treatment with 200 ng/ml rapamycin (+Rap) for 20 minutes. 5 mls of cells were collected prior to and after rapamycin addition for indirect immunofluorescent microscopy as described in the section “Materials and Methods.” Cultures were also collected for protein extraction and western blot analysis. See the section “Materials and Methods” for protocols.
Figure 3
Figure 3
Effects of C-terminal truncations on Gln3-Myc13 localization in wild type and sit4Δ cells. (A) Diagram depicting the C-terminus of each Gln3-Myc13 C-terminal truncation. (B–E) Wild type (JK9-3da) and sit4Δ (FV029) cells were transformed with plasmids encoding full length, wild type Gln31-730-Myc13 (pRR536) or Gln31-476-Myc13 (pRR610). Cells were grown to mid-log phase in YNB-glutamine (Gln), or -proline (Pro) medium. Rapamycin (200 ng/ml) was added to glutamine-grown cells where indicated (+Rap) for 15 minutes. (B and D) Illustrative images of Gln3-Myc13 localization under the growth conditions scored in the historgrams. Gln3-Myc13 localization was scored as cytoplasmic (red bars), nuclear-cytoplasmic (yellow bars; fluorescent material appearing in both the cytoplasm and colocalizing with DAPI-positive material, DNA) or nuclear (green bars; fluorescent material colocalizing only with DAPI-positive material). (C and E) Histograms depicting the percentage of Gln3 localized to each cellular compartment. Experimental format and scoring criteria were as described in the section “Materials and Methods.” Histogram values represent the averages derived from two biological replicates; error bars indicate standard deviations.
Figure 4
Figure 4
Effects of C-terminal truncations on Gln3-Myc13 localization in wild type and sit4Δ cells. Wild type (JK9-3da) and sit4Δ (FV029) cells were transformed with pRR612 (Gln31-400-Myc13), or pRR611 (Gln31-384-Myc13). Experimental design and data presentation were as described in Figure 3.
Figure 5
Figure 5
Rapamycin-elicited dephosphorylation is retained in C-terminally truncated Gln3-Myc13 proteins. (A) Gln3 domain diagram showing the locations of the truncations analyzed in this experiment. (B). Wild type (JK9-3da) cells were transformed with pRR610 (Gln31-476-Myc13), pRR612 (Gln31-400-Myc13) or pRR611 (Gln31-384-Myc13). Transformants were grown to mid-log phase in YNB-glutamine (Gln) medium. Rapamycin (200 ng/ml) was added where indicated (+Rap) for 15 minutes. Cultures were collected for protein extraction and western blot analysis as described (see the section “Materials and Methods” for protocols).
Figure 6
Figure 6
Dephosphorylation of C-terminally truncated Gln3-Myc13 proteins is Sit4-dependent. Wild type (JK9-3da) and sit4Δ (FV029) cells were transformed with plasmids encoding Gln31-476-Myc13 (pRR610), Gln31-400-Myc13 (pRR612), or Gln31-384-Myc13 (pRR611). Transformants were grown to mid-log phase in YNB-glutamine (A), ammonia (B) or proline (C) as the sole nitrogen source. Cell collection and processing for western blot analysis were performed as described in the section “Materials and Methods.”
Figure 7
Figure 7
Predicted secondary structure of the highly conserved Gln3URS. (A)The Gln3URS sequence and its position in Gln3. (B) Highly conserved Gln3 sequences containing the Gln3URS. Amino acid types are color coded: hydrophobic (blue); hydrophilic (green); basic (red); acidic (purple); and proline, though hydrophobic, (yellow). The sequence predicted to possess an α-helical secondary structure is indicated. (C) PyMol modeling showing the predicted secondary structure of Gln3241–302. Colored regions represent amino acid characteristics: basic (cyan) serine/threonine (yellow), hydrophobic (magenta), hydrophilic (green) and acidic (peach). Numbers indicate the Gln3 residue locations. Red numbers indicate the residues that were substituted in this work.
Figure 8
Figure 8
Rapamycin responsiveness of Gln3-Myc13 localization is abolished when aspartate is substituted for basic and serine residues in the predicted disordered loop and amphipathic α-helical regions of the Gln3URS. (A) Gln3URS with aspartate-substituted residues indicated by asterisks; the predicted 14 residue amphipathic α-helix is underlined. (B) Ribbon and space-filling models of the Gln3URS showing the locations of the substituted residues. Residue color scheme: basic (cyan), hydrophobic (magenta), hydrophilic (green), substituted serines (yellow), remaining serine/threonines that were not substituted (orange). Structures in image 3 was derived by rotating the structure in image 2 horizontally ∼180°. Structures in image 6 was derived by rotating the structure in images 5 vertically ∼180°. (C) Contains summaries of previously published experiments as noted in the right column of the panel. Effects of rapamycin addition on Gln3-Myc13 localization. Experimental format and data presentation were as described in Figures 2–4. Transformants contained pRR536 (wild type Gln3), pRR754 (Gln3R264D, K265D, S267D) or pRR772 (Gln3K281D, R282D, S285D).
Figure 9
Figure 9
Rapamycin responsiveness of Gln3-Myc13 localization is abolished when aspartate is substituted for serine/threonine residues in the predicted disordered loop and amphipathic α-helical regions of the Gln3URS. (A) URS sequence containing amino acid substitutions in loop and helical regions of Gln3. (B) Pymol modeling showing position of mutated amino acids in the Gln3URS sequence. (C) This panel contains summaries of previously published experiments as noted in the right column of the panel. Wild type strain JK9-3da was transformed with either pRR536 (Gln31-730-Myc13), pRR1366 (Gln3S249D, S251D, S256D, S257D), or pRR1368 (Gln3S267D, S273F, S274D, T275D, S276D). Transformants were grown in YNB-glutamine (Gln) medium to mid-log phase followed by treatment with 200 ng/ml rapamycin (+Rap) for 15 minutes. Experimental format and data presentation were as described in Figures 3, 4, 8 and the section “Materials and Methods.”
Figure 10
Figure 10
Nitrogen catabolite repression of Gln3-Myc13 localization is altered when aspartate is substituted for serine/threonine residues in the predicted disordered loop and α-helical regions of the Gln3URS. Wild type strain JK9-3da was transformed with either pRR536 (Gln31-730-Myc13), pRR1366 (Gln3S249D, S251D, S256D, S257D), or pRR1368 (Gln3S267D, S273F, S274D, T275D, S276D). Transformants were grown in YNB-ammonia (Am.) or -proline (Pro) medium to mid-log phase. Experimental format and data presentation are as described in Figures 3 and 4. Error bars are standard deviations of two biological replicates. Similar conditions to those used in this experiment may also be found by comparing data obtained comparing Gln vs. Pro as nitrogen source and ammonia vs. ammonia + Msx presented in Tate et al.(2018).
Figure 11
Figure 11
Two-hybrid assessment of Tor1 association with truncated forms of Gln3. (A) Diagram of Gln3 indicating the end points of sequences present in each of the truncation mutants. (B) Locations of the Tor1 domains. (C) Strain PJ69-4a was transformed with pRR1067 (Gln31-600), pRR1122 (Gln31-476), pRR1120 (Gln31-400), pRR1118 (Gln31-350), pRR1149 (Gln31-240), pRR1147 (Gln31-158), or pRR1145 (Gln31-99). All of these plasmids consisted of the Gal4 activation domain fused to the N-terminus of the respective Gln3 proteins. pJ69-4a transformed with pAS2-1 and pACT2 served as a negative control. pJ69-4a, transformed with both pAV3-1 and pTD1-1, served as a positive control (D). All transformants were tested for Gln3 interaction with full length Tor1 (pASTOR11-2470) or Tor1-1764 (pASTOR11-1764) by streaking cells on the same medium in the presence or absence of 3 mM 3-aminotriazole (3AT). The assays were performed as described in the section “Materials and Methods.”
Figure 12
Figure 12
Aspartate substitutions in the Gln3URS abolish Gln3–Tor1 interaction. (A and B) Locations of aspartate substitutions in Gln3 primary and predicted secondary structures of proteins encoded by pRR1124 (Gln3R264D, K265K, S267D) and pRR1128 (Gln3K281D, R282D, S285D). The substitutions in pRR1124 and pRR1128 were the same as those analyzed in pRR754 and pRR772, respectively (Figure 7). Color coding of the Gln3 secondary structure images are the same as in Figures 8 and 9. (C) The two-hybrid experiments were performed and presented as described in Figure 11.
Figure 13
Figure 13
Rapamycin decreases the phosphorylation of serine and threonine residues in the Gln3URS. Phosphorylation levels in untreated cells and those treated with 200 ng/mL rapamycin for 30 minutes. The histograms indicate the average of the assay results, whereas the filled circles indicate the actual values of biological replicates from which the histograms were generated. These are the quantitative data associated with the analysis described in Table 4.
Figure 14
Figure 14
Locations of Gln3 serine and threonine residues in the predicted α-helix (A and B) and complete Gln3URS (C) that were dephosphorylated by treating cells with 200 ng/mL rapamycin. The phosphorylated/dephosphorylated residues are designated by their primary sequence locations and were derived from the data in Table 4. Color coding as in Figures 2, 8, 9, and 12.

Similar articles

Cited by

References

    1. Beck T, Hall MN.. 1999. The TOR signaling pathway controls nuclear localization of nutrient-regulated transcription factors. Nature. 402:689–692. - PubMed
    1. Bertram PG, Choi JH, Carvalho J, Ai W, Zeng C, et al.2000. Tripartite regulation of Gln3p by TOR, Ure2p, and phosphatases. J Biol Chem. 275:35727–35733. - PubMed
    1. Binda M, Bonfils G, Panchaud N, Péli-Gulli MP, De Virgilio C.. 2010. An EGOcentric view of TORC1 signaling. Cell Cycle. 9:221–222. - PubMed
    1. Binda M, Péli-Gulli MP, Bonfils G, Panchaud N, Urban J, et al.2009. The Vam6 GEF controls TORC1 by activating the EGO complex. Mol Cell. 35:563–573. - PubMed
    1. Blinder D, Coschigano PW, Magasanik B.. 1996. Interaction of the GATA factor Gln3p with the nitrogen regulator Ure2p in Saccharomyces cerevisiae. J Bacteriol. 178:4734–4736. - PMC - PubMed

Publication types

MeSH terms

LinkOut - more resources