

Maize centromeric chromatin scales with changes in genome size
- PMID: 33857306
- PMCID: PMC8049547
- DOI: 10.1093/genetics/iyab020
Maize centromeric chromatin scales with changes in genome size
Abstract
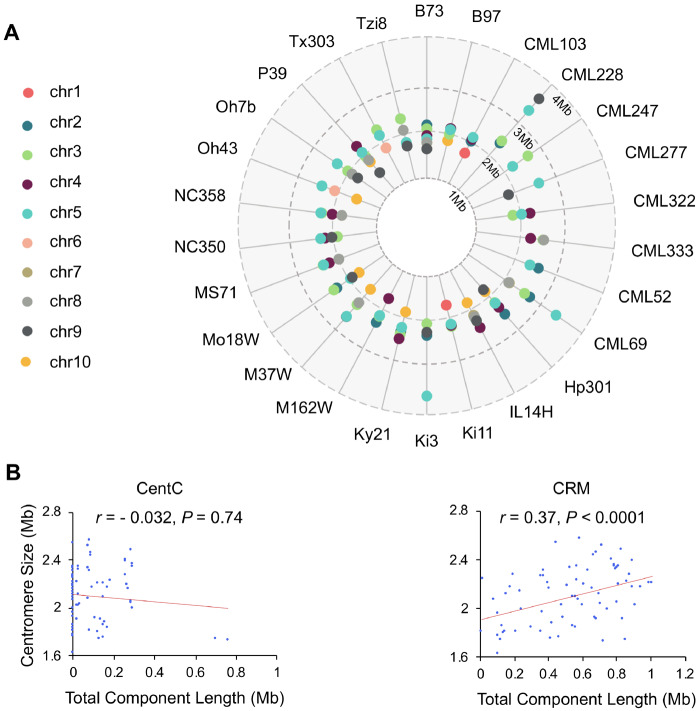
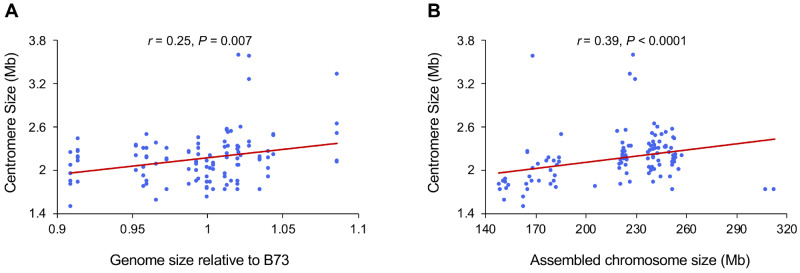
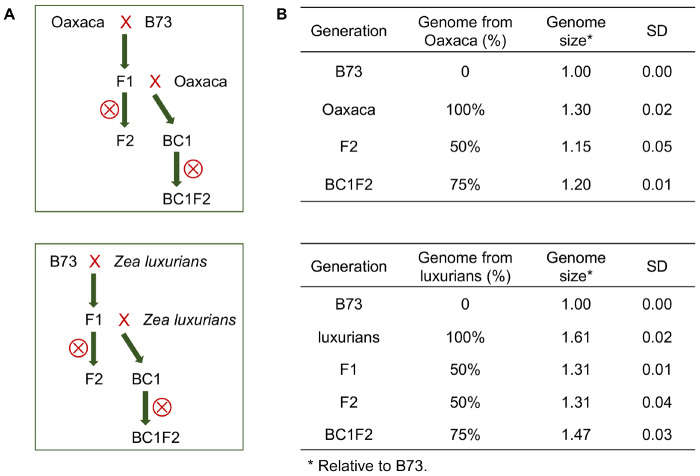
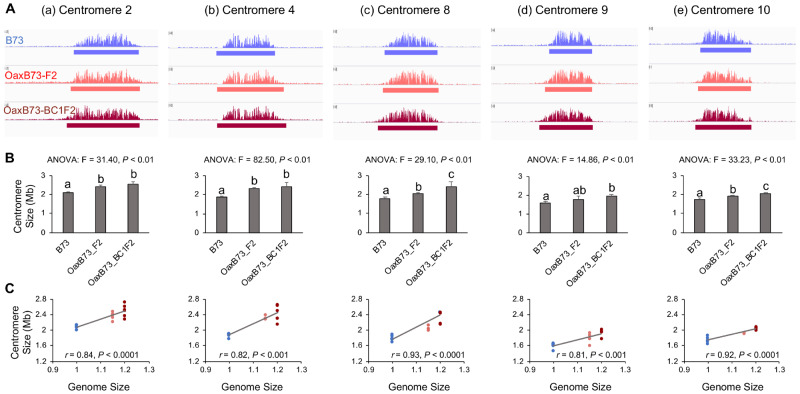
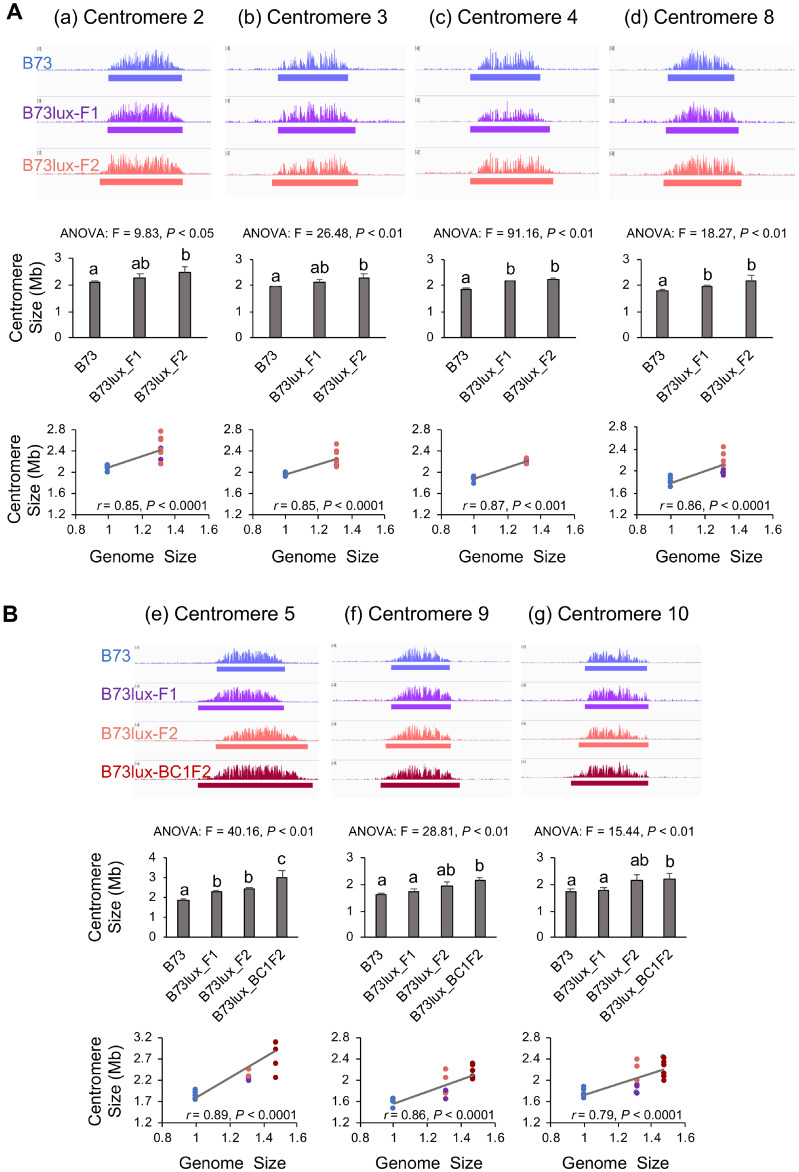
Centromeres are defined by the location of Centromeric Histone H3 (CENP-A/CENH3) which interacts with DNA to define the locations and sizes of functional centromeres. An analysis of 26 maize genomes including 110 fully assembled centromeric regions revealed positive relationships between centromere size and genome size. These effects are independent of variation in the amounts of the major centromeric satellite sequence CentC. We also backcrossed known centromeres into two different lines with larger genomes and observed consistent increases in functional centromere sizes for multiple centromeres. Although changes in centromere size involve changes in bound CENH3, we could not mimic the effect by overexpressing CENH3 by threefold. Literature from other fields demonstrate that changes in genome size affect protein levels, organelle size and cell size. Our data demonstrate that centromere size is among these scalable features, and that multiple limiting factors together contribute to a stable centromere size equilibrium.
Keywords: CENP-A; cellular scaling; centromere; genome-site; kinetochore.
© The Author(s) 2021. Published by Oxford University Press on behalf of Genetics Society of America. All rights reserved. For permissions, please email: journals.permissions@oup.com.
Figures

Similar articles
-
Stable centromere positioning in diverse sequence contexts of complex and satellite centromeres of maize and wild relatives.Genome Biol. 2017 Jun 21;18(1):121. doi: 10.1186/s13059-017-1249-4. Genome Biol. 2017. PMID: 28637491 Free PMC article.
-
Gene Expression and Chromatin Modifications Associated with Maize Centromeres.G3 (Bethesda). 2015 Nov 12;6(1):183-92. doi: 10.1534/g3.115.022764. G3 (Bethesda). 2015. PMID: 26564952 Free PMC article.
-
Centromeric retroelements and satellites interact with maize kinetochore protein CENH3.Plant Cell. 2002 Nov;14(11):2825-36. doi: 10.1105/tpc.006106. Plant Cell. 2002. PMID: 12417704 Free PMC article.
-
DNA and proteins of plant centromeres.Curr Opin Plant Biol. 2003 Dec;6(6):554-60. doi: 10.1016/j.pbi.2003.09.007. Curr Opin Plant Biol. 2003. PMID: 14611953 Review.
-
Centromeric chromatin and its dynamics in plants.Plant J. 2015 Jul;83(1):4-17. doi: 10.1111/tpj.12875. Plant J. 2015. PMID: 25976696 Review.
Cited by
-
Centromere-size reduction and chromatin state dynamics following intergenomic hybridization in cotton.PLoS Genet. 2025 May 2;21(5):e1011689. doi: 10.1371/journal.pgen.1011689. eCollection 2025 May. PLoS Genet. 2025. PMID: 40315272 Free PMC article.
-
Large haplotypes highlight a complex age structure within the maize pan-genome.Genome Res. 2023 Mar;33(3):359-370. doi: 10.1101/gr.276705.122. Epub 2023 Feb 28. Genome Res. 2023. PMID: 36854668 Free PMC article.
-
Plasticity of the mitotic spindle in response to karyotype variation.Curr Biol. 2024 Aug 5;34(15):3416-3428.e4. doi: 10.1016/j.cub.2024.06.058. Epub 2024 Jul 22. Curr Biol. 2024. PMID: 39043187 Free PMC article.
-
Kinetochore size scales with chromosome size in bimodal karyotypes of Agavoideae.Ann Bot. 2022 Jul 19;130(1):77-84. doi: 10.1093/aob/mcac063. Ann Bot. 2022. PMID: 35576011 Free PMC article.
-
A complete telomere-to-telomere assembly of the maize genome.Nat Genet. 2023 Jul;55(7):1221-1231. doi: 10.1038/s41588-023-01419-6. Epub 2023 Jun 15. Nat Genet. 2023. PMID: 37322109 Free PMC article.
References
-
- Albert PS, Gao Z, Danilova TV, Birchler JA.. 2010. Diversity of chromosomal karyotypes in maize and its relatives. Cytogenet Genome Res. 129:6–16. - PubMed
-
- Bennett MD, Smith JB, Ward J, Jenkins G.. 1981. The relationship between nuclear DNA content and centromere volume in higher plants. J Cell Sci. 47:91–115. - PubMed
Publication types
MeSH terms
Substances
LinkOut - more resources
Full Text Sources
Other Literature Sources
