. 2021 Apr 29;184(9):2487-2502.e13.
doi: 10.1016/j.cell.2021.03.030. Epub 2021 Apr 14.

Synthetic lethality-mediated precision oncology via the tumor transcriptome

Affiliations

Synthetic lethality-mediated precision oncology via the tumor transcriptome

Joo Sang Lee et al. Cell. .

Abstract

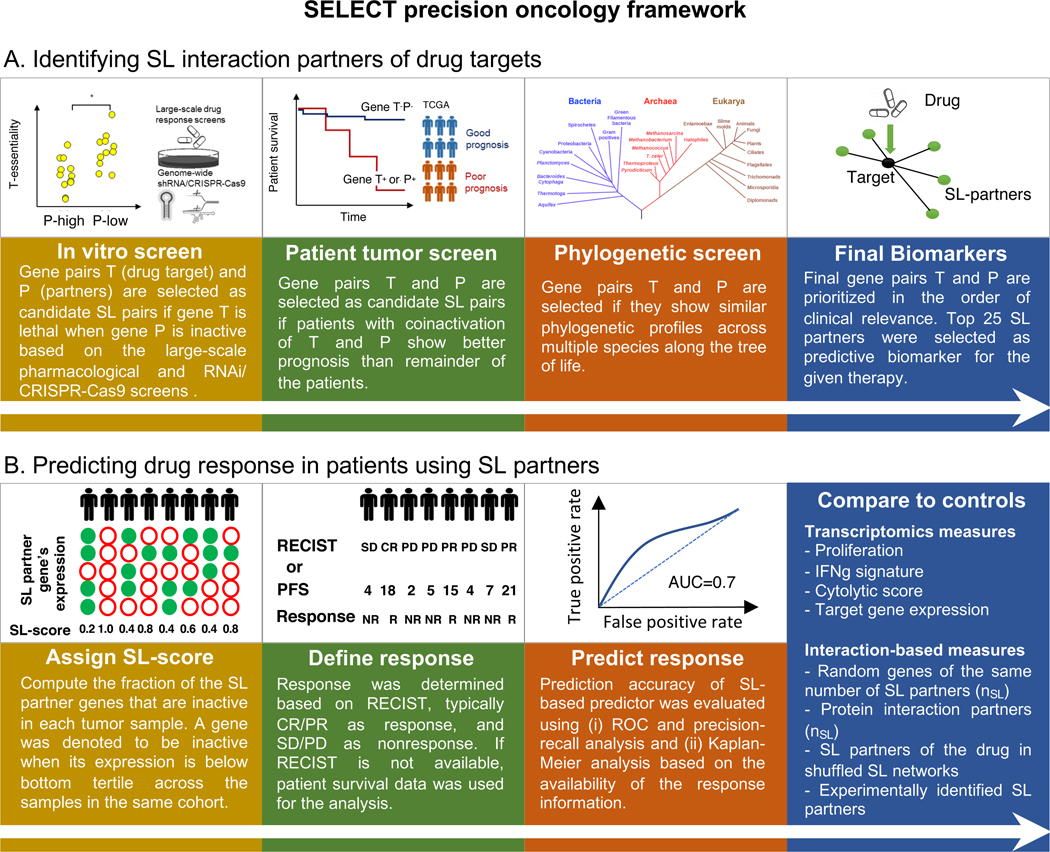
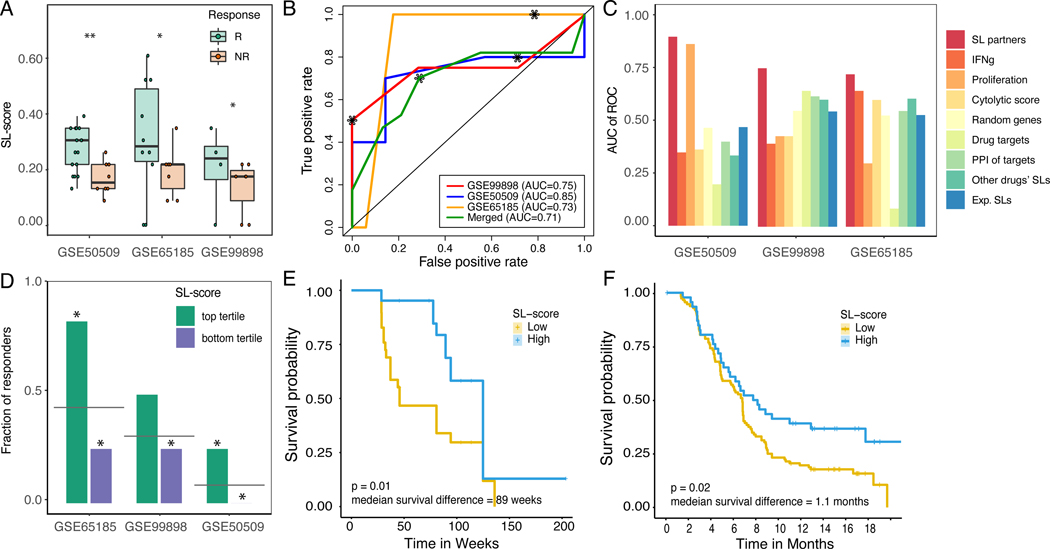
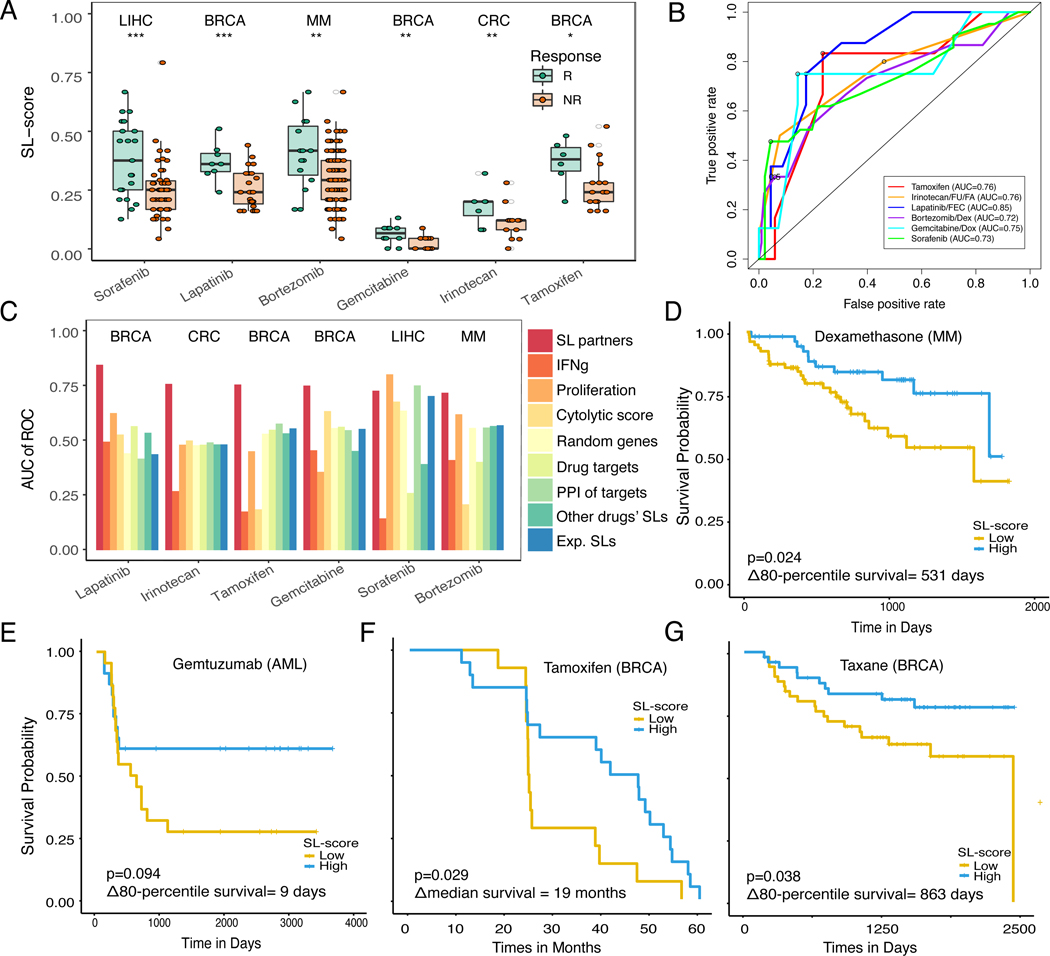
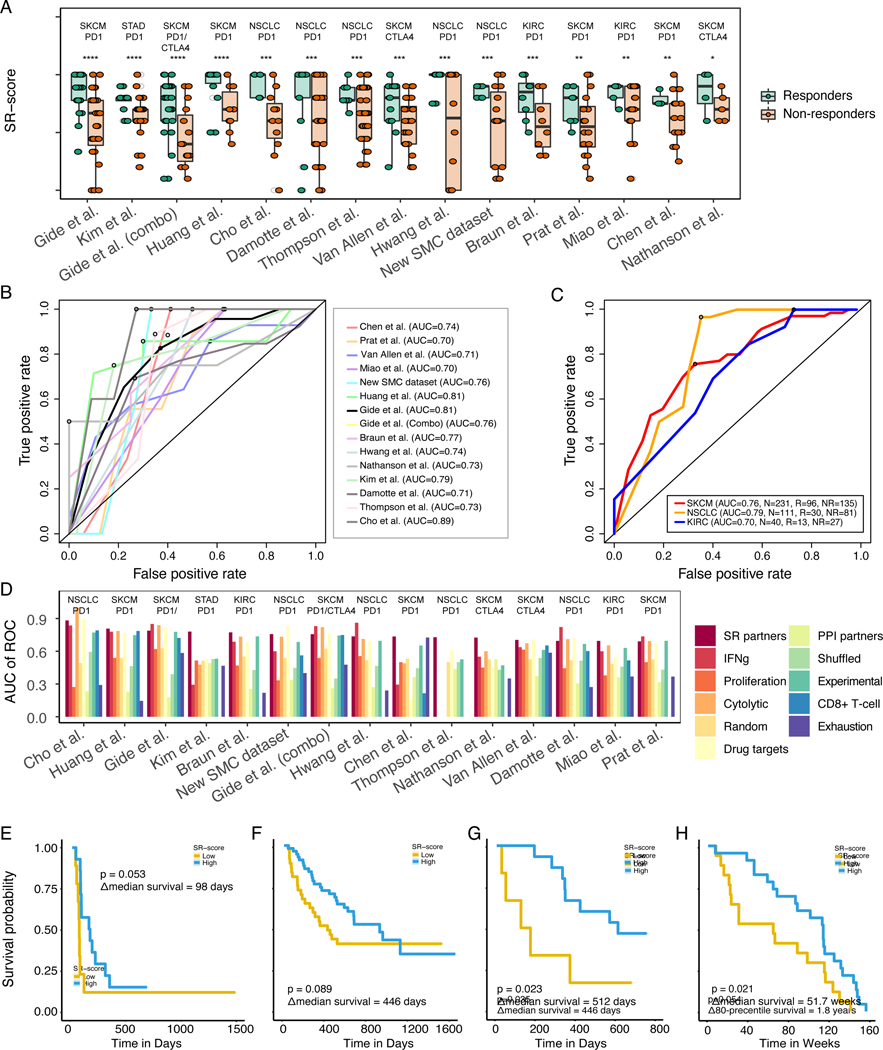
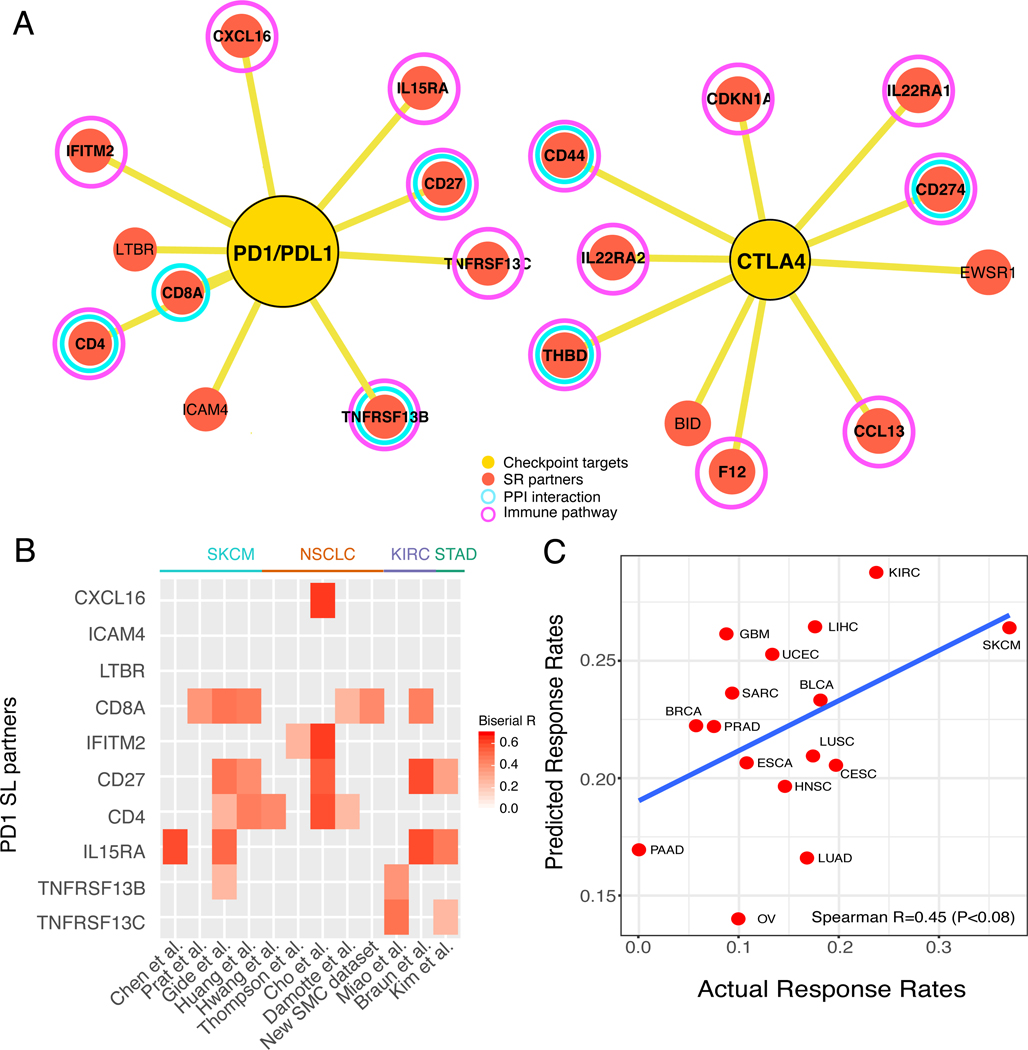
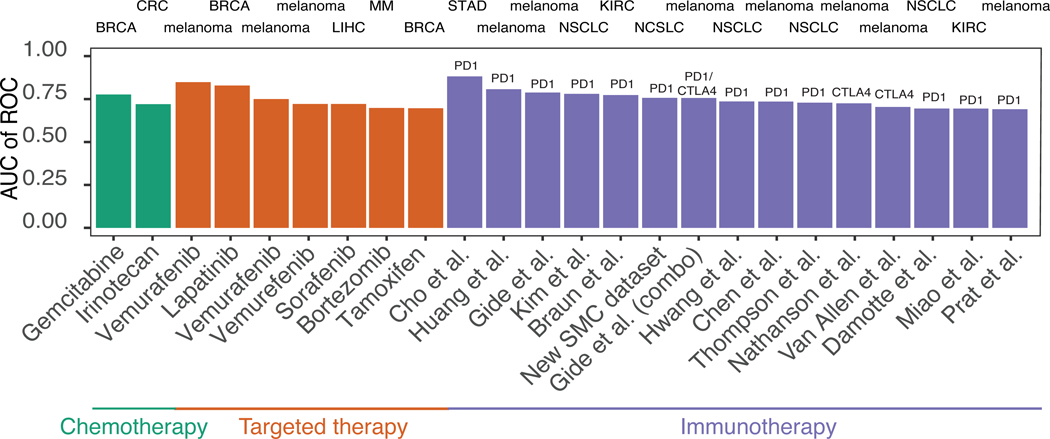
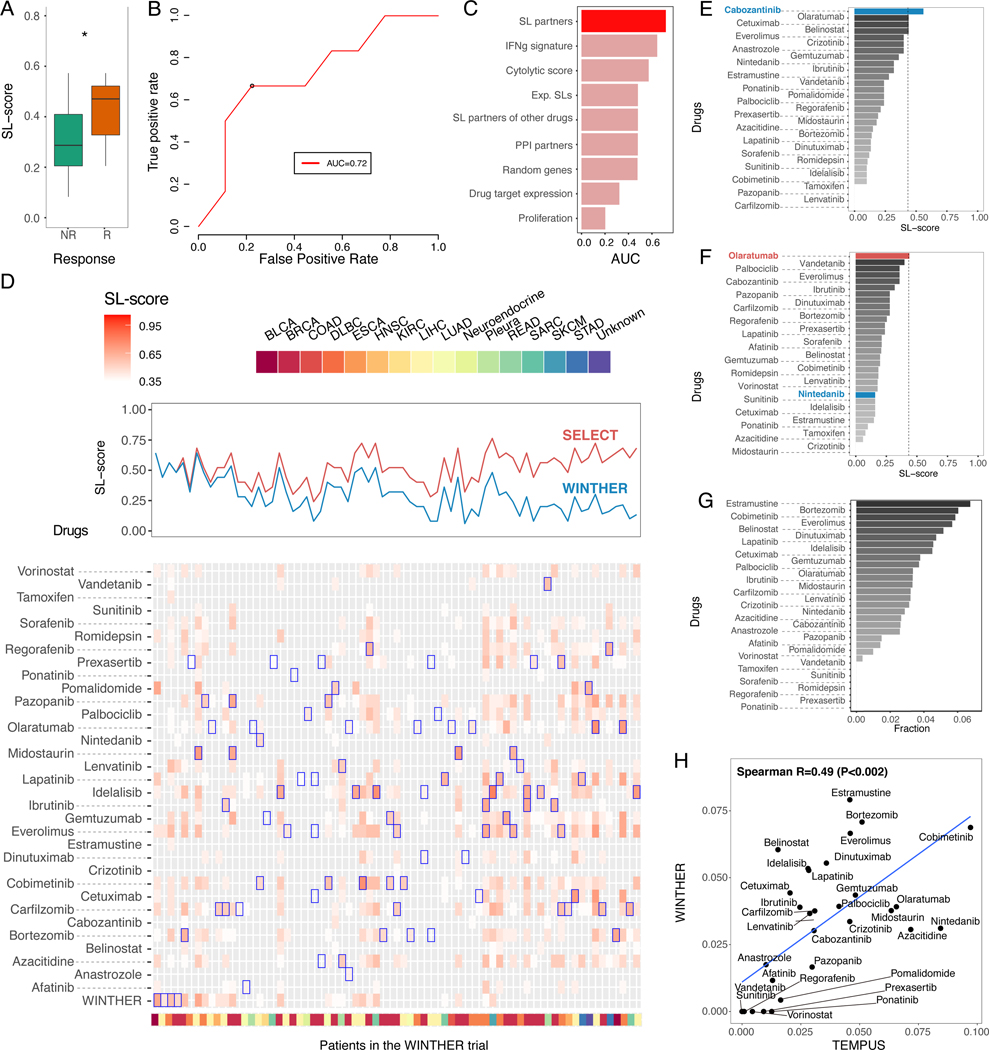
Precision oncology has made significant advances, mainly by targeting actionable mutations in cancer driver genes. Aiming to expand treatment opportunities, recent studies have begun to explore the utility of tumor transcriptome to guide patient treatment. Here, we introduce SELECT (synthetic lethality and rescue-mediated precision oncology via the transcriptome), a precision oncology framework harnessing genetic interactions to predict patient response to cancer therapy from the tumor transcriptome. SELECT is tested on a broad collection of 35 published targeted and immunotherapy clinical trials from 10 different cancer types. It is predictive of patients' response in 80% of these clinical trials and in the recent multi-arm WINTHER trial. The predictive signatures and the code are made publicly available for academic use, laying a basis for future prospective clinical studies.

Keywords: cancer immunotherapy; patient stratification; precision oncology; synthetic lethality; synthetic rescues; transcriptomics.


Conflict of interest statement

Declaration of interests E.R. is a co-founder of Medaware, Metabomed, and Pangea Therapeutics (divested from the latter). E.R. serves as a non-paid scientific consultant to Pangea Therapeutics, a company developing a precision oncology SL-based multi-omics approach. J.S.L. is a scientific consultant; T.B. is chief executive officer and chief technical officer; G.D. is head of research and development; R.B. is a member of the Scientific Advisory Board; and Z.R. is a co-founder and a scientific advisor at Pangea Therapeutics. R.K. receives research funding from Genentech, Merck Serono, Pfizer, Boehringer Ingelheim, TopAlliance, Takeda, Incyte, Debiopharm, Medimmune, Sequenom, Foundation Medicine, Konica Minolta, Grifols, Omniseq, and Guardant; received consultant, speaker, and/or advisory board fees for X-Biotech, Neomed, Pfizer, Actuate Therapeutics, Roche, Turning Point Therapeutics, TD2/Volastra, and Bicara Therapeutics; has an equity interest in IDbyDNA and CureMatch; serves on the board of CureMatch and CureMetrix; and is a co-founder of CureMatch. A patent application associated with this manuscript is in process.

Figures

Figure 1.
Figure 1.. SELECT precision oncology framework.
(A-B) The SELECT precision oncology framework is composed of two steps: (i) identifying SL interaction partners of drug targets and (ii) predicting drug response in patients using SL partners. (A) The SL partners (gene P) of the drug target genes (gene T) are supported by genetic dependencies in cell lines, patient tumor data, and phylogenetic profiles. (B) The identified SL partners of the drug target genes are used to compute an SL-score to predict the response to the given therapy. See also Supplemental Figure 1,2, Supplemental Table 2.
Figure 2.
Figure 2.. SELECT stratifies melanoma patients for BRAF inhibitors based on the expression of BRAF SL partners.
(A) SL-scores are significantly higher in responders (green) vs non-responders (red) based on Wilcoxon rank-sum test after multiple hypothesis correction. For false discovery rates: * denotes 10% and ** denotes 5%. (B) ROC curves depicting the prediction accuracy of the response to BRAF inhibition using SL-scores in the three melanoma cohorts (red, yellow, blue) and their aggregation (green). The stars denote the point of the maximal Fl-score. (C) Bar graphs show the predictive accuracy in terms of Area Under the Curve (AUC) of ROC curve (Y-axis) of SL-based predictors (red) and controls including several known transcriptomics-deduced metrics (IFNg signature, proliferation index, cytolytic score, and the drug target expression levels) and several interaction-based scores (based on randomly chosen partners, randomly chosen PPI partners of the drug target gene(s), the identified SL partners of other cancer drugs, and experimentally identified SL partners) in the three BRAF inhibitor cohorts (X-axis). (D) Bar graphs showing the fraction of responders in the patients with high SL-scores (top tertile; green) and low SL-scores (bottom tertile; purple). The grey line denotes the overall response rate in each cohort, and the stars denote the hypergeometric significance of enrichment of responders in the high-SL group and depletion of responders in the low-SL group (compared to their baseline frequency in the cohort). (E,F) Kaplan-Meier curves depicting the survival of patients with low (yellow) vs high (blue) BRAF SL-scores (top vs. bottom tertile of SL-scores) of (E) GSE50509 (Rizos et al., 2014) and (F) independent (unseen) BRAF inhibitor clinical trials (Wongchenko et al., 2017). Patients with high SL-scores show better prognosis, as expected. The logrank P-value and median survival difference are denoted. See also Supplemental Figure 2,3, Supplemental Table 2,5.
Figure 3.
Figure 3.. SELECT stratifies patients for targeted therapies across different cancer types.
(A) SL-scores are significantly higher in responders (green) vs non-responders (red) based on Wilcoxon ranksum test after multiple hypothesis correction. For false discovery rates: * denotes 10%, ** denotes 5%, and *** denotes 1%. Cancer types are noted on the top of each dataset. (B) ROC curves for breast cancer patients treated with lapatinib (GSE66399) (Guarneri et al., 2015), tamoxifen (GSE16391) (Desmedt et al., 2009), gemcitabine (GSE8465) (Julka et al., 2008), colorectal cancer patients treated with irinotecan (GSE3964) (Graudens et al., 2006), multiple myeloma patients treated with bortezomib (GSE68871) (Terragna et al., 2016), and hepatocellular carcinoma patients treated with sorafenib (GSE109211) (Pinyol et al., 2019). The circles denote the point of maximal F1-score. (C) Bar graphs show the predictive accuracy in terms of AUCs (Y-axis) of SL-based predictors and a variety of controls specified earlier in Figure 2C (X-axis). (D-G) Kaplan-Meier curves depicting the survival of patients with low vs high SL-scores of (D) multiple myeloma patients treated with dexamethasone (Manojlovic et al., 2017), and (E) acute myeloid leukemia patients treated with gemtuzumab (Bolouri et al., 2018), (F) breast cancer treated with tamoxifen (GSE16391) (Desmedt et al., 2009), and (G) breast cancer cohorts treated with taxane-anthracycline (GSE32603) (Magbanua et al., 2015), where X-axis denotes survival time and Y-axis denotes the probability of survival. Patients with high SL-scores (top-tertile, blue) show better prognosis than the patients with low SL-scores (bottom tertile, yellow), as expected. The logrank P-values and median survival differences (or 80-percentile survival differences if survival exceeds 50% at the longest time point) are denoted in the figure. Tumor type abbreviations: MM, multiple myeloma; CRC, colorectal cancer; BRCA, breast invasive carcinoma; AML, acute myeloid leukemia; and LIHC, liver hepatocellular carcinoma. See also Supplemental Figure 3, Supplemental Table 2,5.
Figure 4.
Figure 4.. SELECT stratifies patients for immune checkpoint therapy across different cancer types.
(A) SR-scores are significantly higher in responders (green) vs non-responders (red) based on Wilcoxon ranksum test after multiple hypothesis correction. For false discovery rates: * denotes 20%, ** denotes 10%, *** denotes 5%, and **** denotes 1%. Cancer types are noted on the top of each dataset. Results are shown for melanoma (Chen et al., 2016; Gide et al., 2018; Liu et al., 2019; Nathanson et al., 2017; Prat et al., 2017; Van Allen et al., 2015), non-small cell lung cancer (Cho et al., 2020; Damotte et al., 2019; Hwang et al., 2020; Thompson et al., 2020), renal cell carcinoma (Braun et al., 2020; Miao et al., 2018), and metastatic gastric cancer (Kim et al., 2018) treated with anti-PD1/PDL1, anti-CTLA4 or their combination, and our new lung adenocarcinoma cohort treated with anti-PD1 (GSE166449). (B-C) ROC curves showing the prediction accuracy obtained with the SELECT framework (B) in the 15 different datasets and (C) across their cancer type-specific aggregation in melanoma, non-small cell lung cancer and kidney cancer. The circles denote the point of maximal F1-score. (D) Bar graphs show the predictive accuracy in terms of AUC (Y-axis) of SR-based predictors and controls across the 15 different cohorts (X-axis) (control predictors are similar to those described in Figure 2C, with the addition of T-cell exhaustion and CD8+ T-cell abundance). (E-H) Kaplan-Meier curves depicting the survival of patients with low vs high SR-scores in (E) anti-PD1/CTLA4 combination-treated melanoma (Gide et al., 2018), (F) nivolumab/pembrolizumab-treated melanoma (Liu et al., 2019), (G) atezolizumab-treated urothelial cancer (Snyder et al., 2017), and (H) nivolumab-treated melanoma (Riaz et al., 2017) cohorts. Patients with high SR- scores (blue; over top tertile) show better prognosis than the patients with low SR-scores (yellow; below bottom tertile), and the logrank P-values and median survival differences are denoted. Tumor type abbreviations: STAD, stomach adenocarcinoma, SKCM, skin cutaneous melanoma; NSCLC, non-small cell lung cancer; and KIRC, kidney renal clear cell carcinoma. See also Supplemental Figure 3, Supplemental Table 4.
Figure 5.
Figure 5.. Meta-analysis of SELECT SR partners for immune checkpoint therapy.
(A) The SR partners of PD1-PDL1 interaction (left) and CTLA4 (right), where red circles denote SR partners, yellow circles denote checkpoint targets, purple circles denote genes that belong to immune pathways, and cyan circles denote a protein-protein interaction (based on STRING database (Szklarczyk et al., 2015)) with PD1/PDL1 or CTLA4, respectively. (B) A heatmap showing the association of individual SR partners’ gene expression (Y-axis) with anti-PD1 response in the 12 clinical trial cohorts (X-axis). The significant point-biserial correlation coefficients are color-coded (P<0.1), and the cancer types of each cohort are denoted on the top of the heatmap. (C) The SR-based predicted response rates for different TCGA cancer types (Y-axis) correlate with the objective response rates observed in independent clinical trials across these cancer types (X-axis) (Spearman R=0.45, P<0.08), with a regression line (blue). Tumor type abbreviations: UCEC, uterine corpus endometrial carcinoma; STAD, stomach adenocarcinoma, SKCM, skin cutaneous melanoma; SARC, sarcoma; PRAD, prostate adenocarcinoma; PAAD, pancreatic adenocarcinoma; OV, ovarian serous cystadenocarcinoma; NSCLC, non-small cell lung cancer; LUAD, lung adenocarcinoma; LUSC, lung squamous cell carcinoma; LIHC, liver hepatocellular carcinoma; KIRC, kidney renal clear cell carcinoma; HNSC, head-neck squamous cell carcinoma; GBM, glioblastoma multiforme; ESCA, esophageal carcinoma; CESC, cervical squamous cell carcinoma and endocervical adenocarcinoma; BRCA, breast invasive carcinoma; and BLCA, bladder carcinoma. See also Supplemental Figure 3.
Figure 6.
Figure 6.. Overall prediction accuracy of SELECT precision oncology framework.
The bar graphs show the overall predictive accuracy of SELECT for chemotherapy (red), targeted therapy (green) and immunotherapy (purple) in 24 different cohorts encompassing 8 different cancer types and 9 treatment options (for which discrete response information like RECIST was given). Tumor type abbreviations: STAD, stomach adenocarcinoma; NSCLC, non-small cell lung cancer; MM, multiple myeloma; LIHC, liver hepatocellular carcinoma; KIRC, kidney renal clear cell carcinoma; CRC, colorectal cancer; BRCA, breast invasive carcinoma; and BLCA, bladder carcinoma.
Figure 7.
Figure 7.. SELECT analysis of the WINTHER trial.
(A) Responders (CR, PR, and SD; red) show significantly higher SL-scores compared to non-responders (PD; green) (Wilcoxon rank- sum P<0.05). (B) SL-scores are predictive of response to the different treatments prescribed at the trial (AUC of R0C=0.72). The black circle denotes the point of maximal F1-score (corresponding to an SL-score threshold of 0.44). (C) Bar graphs show the predictive accuracy in terms of AUC (X-axis) of SL-based predictors and different controls (Y-axis) (control types are similar to those described in Figure 2C). (D) (top panel) Comparison of the SL-scores (Y-axis) of the treatments actually prescribed in the WINTHER trial (blue) and the SL-scores of the best therapy identified by our approach (red) across all 71 patients; samples are ordered by the difference in the two SL-scores. (bottom panel) A more detailed display of the SL-scores of the treatment given in the trial (bottom row) and of all candidate therapies (all other rows), for all 71 patients (the treatments considered are denoted in every column). Blue boxes denote the highest SL-scoring treatments predicted for each patient. Cancer types of each sample are color-coded at the bottom of the figure. (E-F) SELECT recommendations for two individual patients in the WINTHER trial. The X-axis denotes the SL-score and the Y-axis lists the different cohort treatments. The drugs given in WINTHER trial are colored in blue and the top prediction by SELECT are in red. (G) A bar graph showing the frequency (X-axis) of the drugs (Y-axis) predicted to be most effective across the WINTHER cohort. (H) The correlation between the estimated coverage of top-predicted drugs in the WINTHER cohort (Y-axis) and in a TEMPUS cohort of corresponding cancer types (n=98). See also Supplemental Figure 4-7, Supplemental Table 5.

References

    1. Aguirre AJ, Meyers RM, Weir BA, Vazquez F, Zhang CZ, Ben-David U, Cook A, Ha G, Harrington WF, Doshi MB., et al. (2016). Genomic Copy Number Dictates a Gene-Independent Cell Response to CRISPR/Cas9 Targeting. Cancer Discov 6, 914–929. - PMC - PubMed
    1. Ayers M, Lunceford J, Nebozhyn M, Murphy E, Loboda A, Kaufman DR, Albright A, Cheng JD, Kang SP, Shankaran V, et al. (2017). IFN-gamma-related mRNA profile predicts clinical response to PD-1 blockade. J Clin Invest 127, 2930–2940. - PMC - PubMed
    1. Barretina J, Caponigro G, Stransky N, Venkatesan K, Margolin AA, Kim S, Wilson CJ, Lehar J, Kryukov GV, Sonkin D, et al. (2012). The Cancer Cell Line Encyclopedia enables predictive modelling of anticancer drug sensitivity. Nature 483, 603–607. - PMC - PubMed
    1. Basu A, Bodycombe NE, Cheah JH, Price EV, Liu K, Schaefer GI, Ebright RY, Stewart ML, Ito D, Wang S, et al. (2013). An Interactive Resource to Identify Cancer Genetic and Lineage Dependencies Targeted by Small Molecules. Cell 154, 1151–1161. - PMC - PubMed
    1. Beaubier N, Bontrager M, Huether R, Igartua C, Lau D, Tell R, Bobe AM, Bush S, Chang AL, Hoskinson DC, et al. (2019). Integrated genomic profiling expands clinical options for patients with cancer. Nat Biotechnol. - PubMed

Publication types

MeSH terms

Substances