

Effect of socioeconomic inequalities and vulnerabilities on health-system preparedness and response to COVID-19 in Brazil: a comprehensive analysis
- PMID: 33857500
- PMCID: PMC8041360
- DOI: 10.1016/S2214-109X(21)00081-4
Effect of socioeconomic inequalities and vulnerabilities on health-system preparedness and response to COVID-19 in Brazil: a comprehensive analysis
Abstract
Background: COVID-19 spread rapidly in Brazil despite the country's well established health and social protection systems. Understanding the relationships between health-system preparedness, responses to COVID-19, and the pattern of spread of the epidemic is particularly important in a country marked by wide inequalities in socioeconomic characteristics (eg, housing and employment status) and other health risks (age structure and burden of chronic disease).
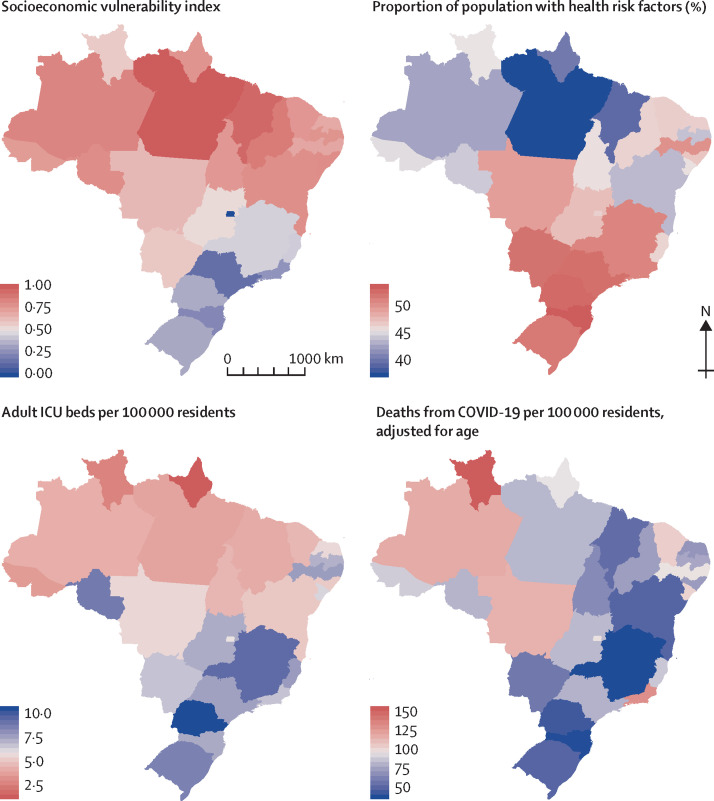
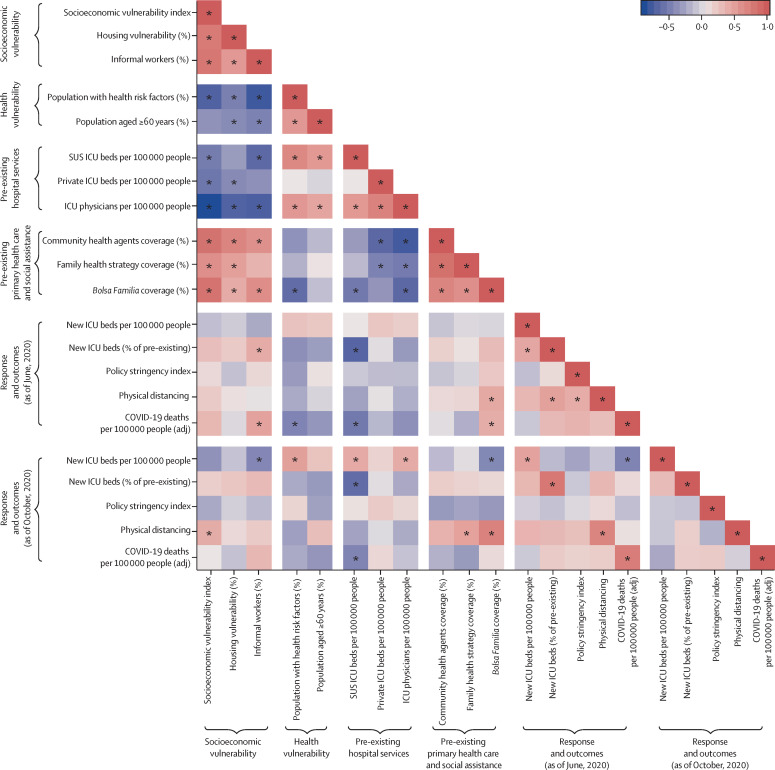
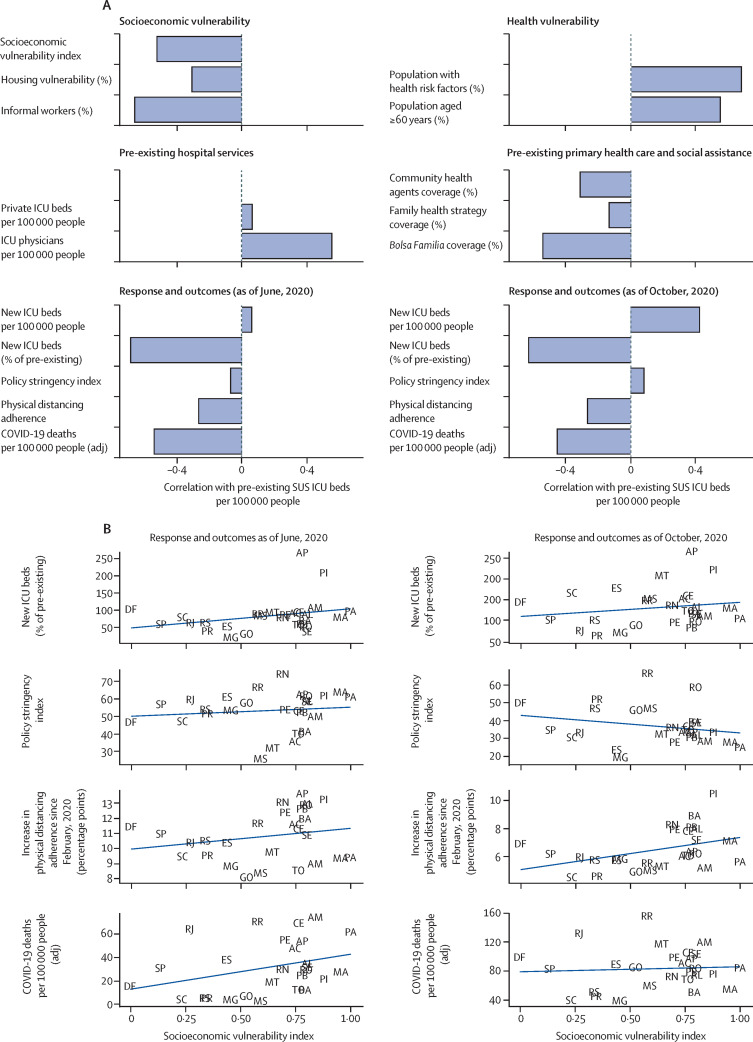
Methods: From several publicly available sources in Brazil, we obtained data on health risk factors for severe COVID-19 (proportion of the population with chronic disease and proportion aged ≥60 years), socioeconomic vulnerability (proportions of the population with housing vulnerability or without formal work), health-system capacity (numbers of intensive care unit beds and physicians), coverage of health and social assistance, deaths from COVID-19, and state-level responses of government in terms of physical distancing policies. We also obtained data on the proportion of the population staying at home, based on locational data, as a measure of physical distancing adherence. We developed a socioeconomic vulnerability index (SVI) based on household characteristics and the Human Development Index. Data were analysed at the state and municipal levels. Descriptive statistics and correlations between state-level indicators were used to characterise the relationship between the availability of health-care resources and socioeconomic characteristics and the spread of the epidemic and the response of governments and populations in terms of new investments, legislation, and physical distancing. We used linear regressions on a municipality-by-month dataset from February to October, 2020, to characterise the dynamics of COVID-19 deaths and response to the epidemic across municipalities.
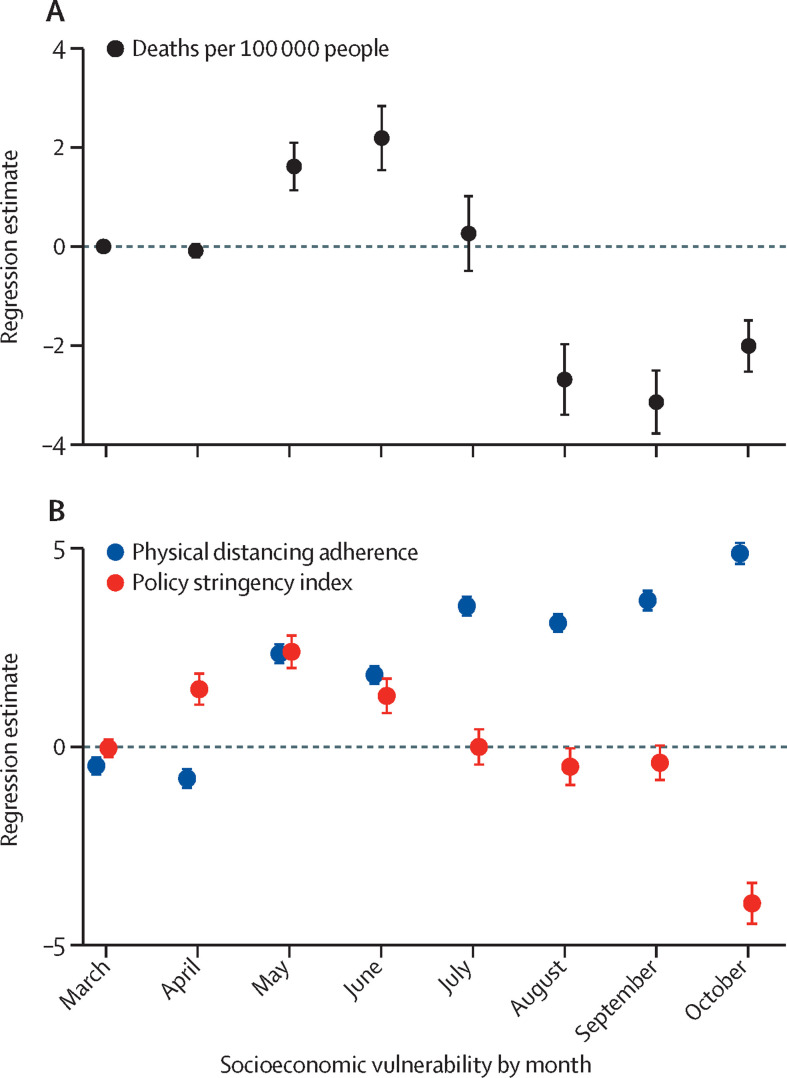
Findings: The initial spread of COVID-19 was mostly affected by patterns of socioeconomic vulnerability as measured by the SVI rather than population age structure and prevalence of health risk factors. The states with a high (greater than median) SVI were able to expand hospital capacity, to enact stringent COVID-19-related legislation, and to increase physical distancing adherence in the population, although not sufficiently to prevent higher COVID-19 mortality during the initial phase of the epidemic compared with states with a low SVI. Death rates accelerated until June, 2020, particularly in municipalities with the highest socioeconomic vulnerability. Throughout the following months, however, differences in policy response converged in municipalities with lower and higher SVIs, while physical distancing remained relatively higher and death rates became relatively lower in the municipalities with the highest SVIs compared with those with lower SVIs.
Interpretation: In Brazil, existing socioeconomic inequalities, rather than age, health status, and other risk factors for COVID-19, have affected the course of the epidemic, with a disproportionate adverse burden on states and municipalities with high socioeconomic vulnerability. Local government responses and population behaviour in the states and municipalities with higher socioeconomic vulnerability have helped to contain the effects of the epidemic. Targeted policies and actions are needed to protect those with the greatest socioeconomic vulnerability. This experience could be relevant in other low-income and middle-income countries where socioeconomic vulnerability varies greatly.
Funding: None.
Translation: For the Portuguese translation of the abstract see Supplementary Materials section.
Copyright © 2021 The Author(s). Published by Elsevier Ltd. This is an Open Access article under the CC BY-NC-ND 4.0 license. Published by Elsevier Ltd.. All rights reserved.
Conflict of interest statement
Declaration of interests We declare no competing interests.
Figures
Comment in
-
Brazil's response to COVID-19: commercial determinants of health and regional inequities matter.Lancet Glob Health. 2021 Jun;9(6):e726-e727. doi: 10.1016/S2214-109X(21)00146-7. Epub 2021 Apr 12. Lancet Glob Health. 2021. PMID: 33857501 No abstract available.
References
-
- WHO Coronavirus disease (COVID-19). Situation report—148. https://www.who.int/docs/default-source/coronaviruse/situation-reports/2...
-
- Lloyd-Sherlock P, Ebrahim S, Geffen L, McKee M. Bearing the brunt of COVID-19: older people in low and middle income countries. BMJ. 2020;368 - PubMed
-
- Johns Hopkins University of Medicine COVID-19 Dashboard by the Center for Systems Science and Engineering at Johns Hopkins University. https://coronavirus.jhu.edu/map.html
MeSH terms
LinkOut - more resources
Full Text Sources
Other Literature Sources
Medical
