. 2021 Apr 15;19(1):76.
doi: 10.1186/s12915-021-01009-0.

Multi-omic profiling of pituitary thyrotropic cells and progenitors

Affiliations

Multi-omic profiling of pituitary thyrotropic cells and progenitors

Alexandre Z Daly et al. BMC Biol. .

Abstract

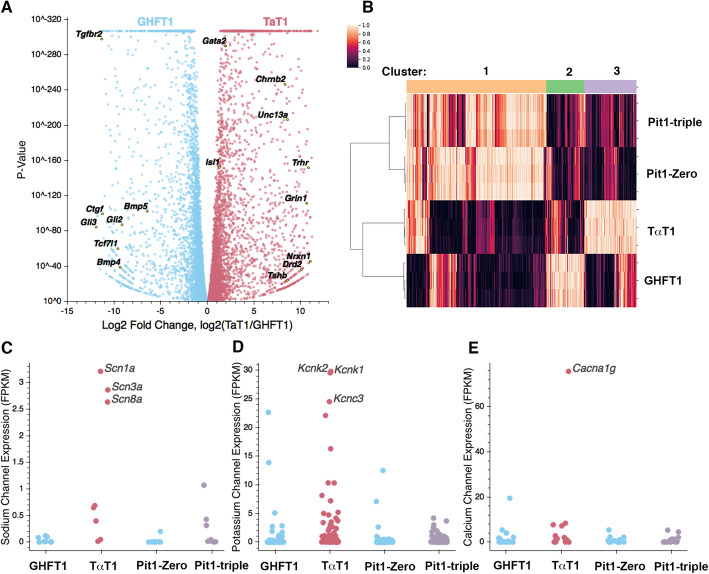
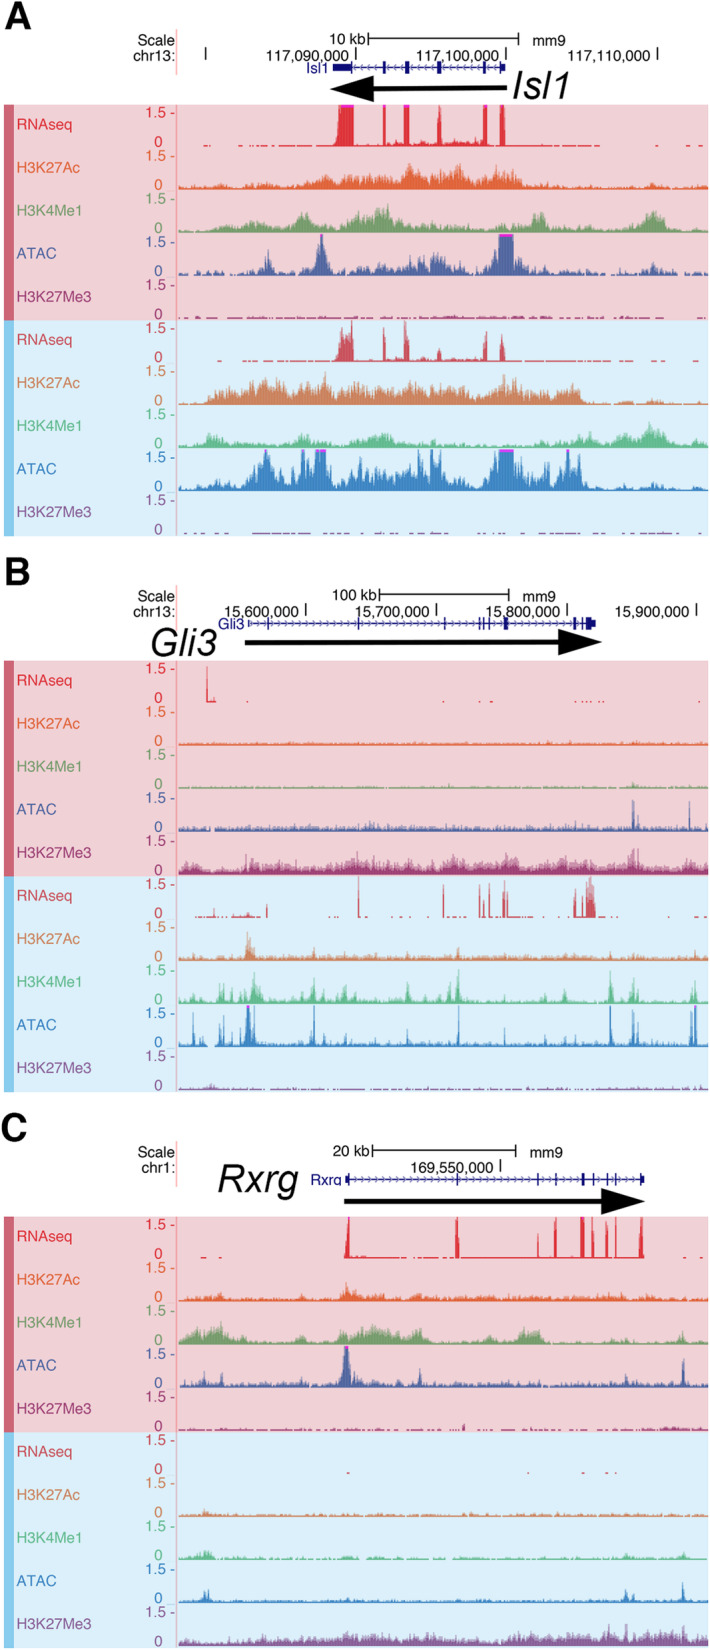
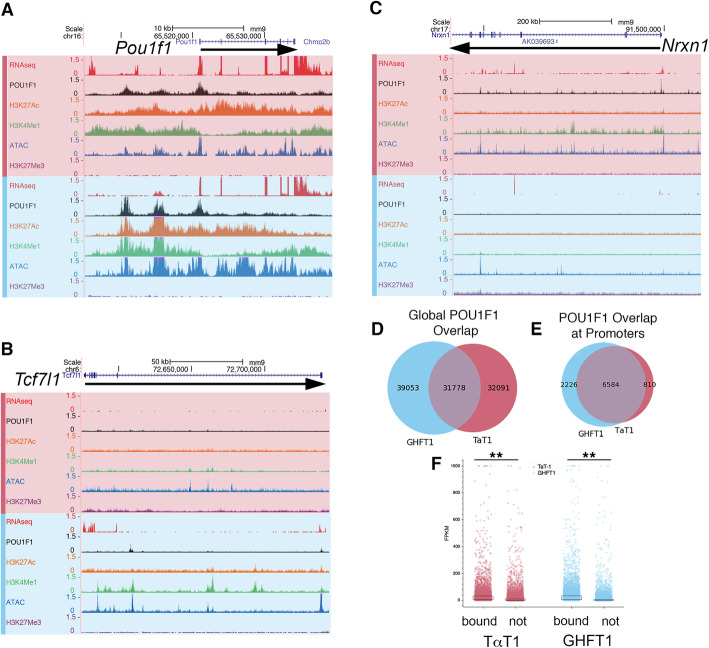
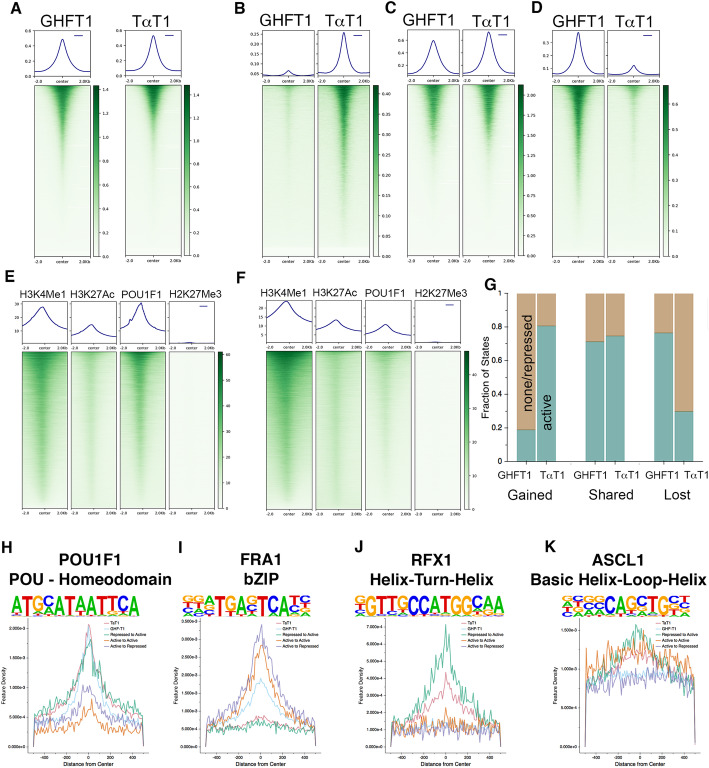
Background: The pituitary gland is a neuroendocrine organ containing diverse cell types specialized in secreting hormones that regulate physiology. Pituitary thyrotropes produce thyroid-stimulating hormone (TSH), a critical factor for growth and maintenance of metabolism. The transcription factors POU1F1 and GATA2 have been implicated in thyrotrope fate, but the transcriptomic and epigenomic landscapes of these neuroendocrine cells have not been characterized. The goal of this work was to discover transcriptional regulatory elements that drive thyrotrope fate.

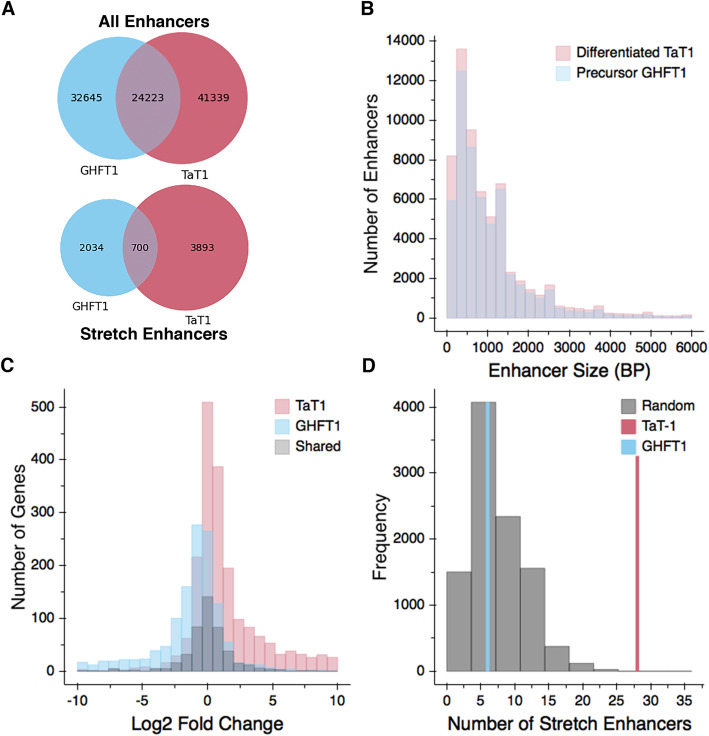
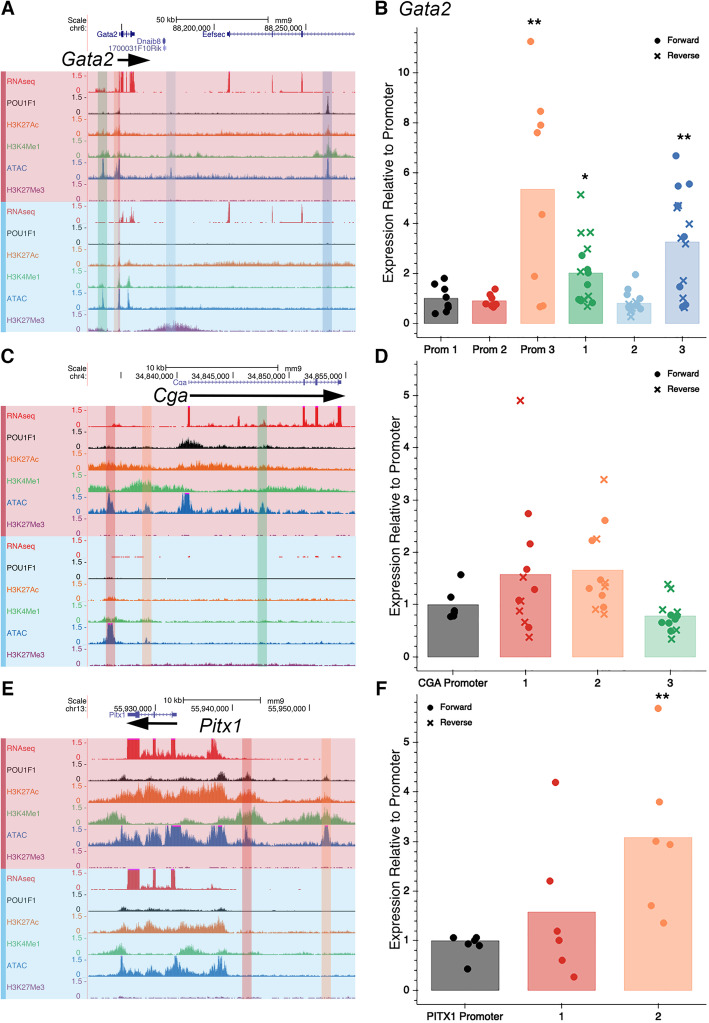
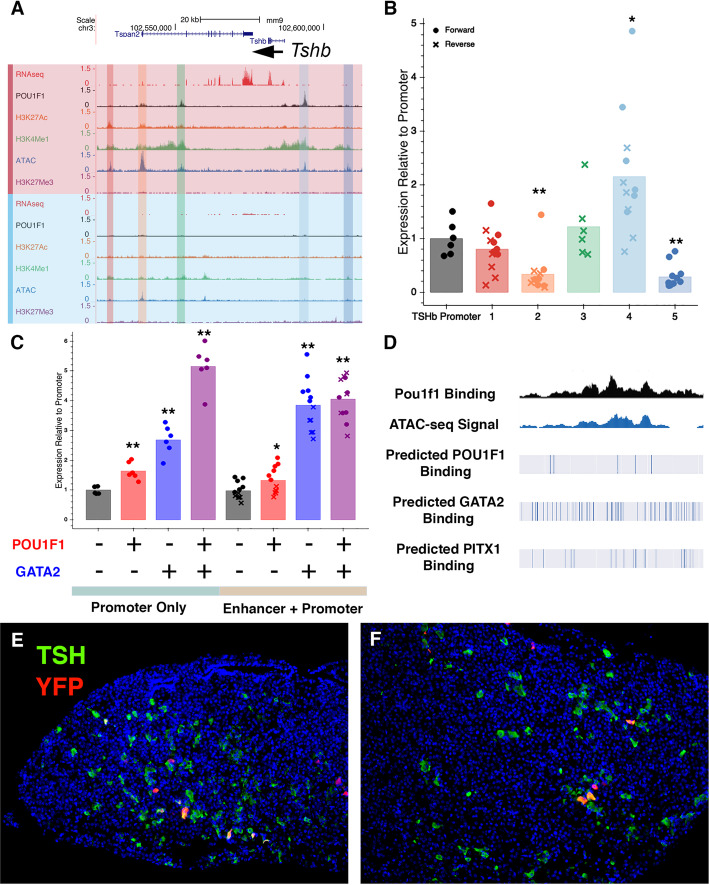
Results: We identified the transcription factors and epigenomic changes in chromatin that are associated with differentiation of POU1F1-expressing progenitors into thyrotropes using cell lines that represent an undifferentiated Pou1f1 lineage progenitor (GHF-T1) and a committed thyrotrope line that produces TSH (TαT1). We compared RNA-seq, ATAC-seq, histone modification (H3K27Ac, H3K4Me1, and H3K27Me3), and POU1F1 binding in these cell lines. POU1F1 binding sites are commonly associated with bZIP transcription factor consensus binding sites in GHF-T1 cells and Helix-Turn-Helix (HTH) or basic Helix-Loop-Helix (bHLH) factors in TαT1 cells, suggesting that these classes of transcription factors may recruit or cooperate with POU1F1 binding at unique sites. We validated enhancer function of novel elements we mapped near Cga, Pitx1, Gata2, and Tshb by transfection in TαT1 cells. Finally, we confirmed that an enhancer element near Tshb can drive expression in thyrotropes of transgenic mice, and we demonstrate that GATA2 enhances Tshb expression through this element.

Conclusion: These results extend the ENCODE multi-omic profiling approach to the pituitary gland, which should be valuable for understanding pituitary development and disease pathogenesis.

Keywords: Chromatin; GATA2; POU1F1; TSH; bHLH; bHTH; bZIP.


Conflict of interest statement

The authors declare that they have no competing interests.

Figures

Fig. 1
Fig. 1
a Volcano plot of differential gene expression for GHF-T1 compared to TαT1 cells. Genes with elevated expression in GHF-T1 cells are colored blue, and those elevated in TαT1 cells are colored red. Labeled genes represent key factors and genes associated with GO terms in Table 2. b Heatmap showing similarly and differentially expressed genes across GHF-T1, TαT1, Pit1-Zero, and Pit1-Triple cells. Genes associated with each cluster are presented in Supplemental Table 1. c FPKM values of neuronal sodium channel genes. d FPKM values of potassium channel genes. e FPKM values of calcium channel genes. N = 3/cell line
Fig. 2
Fig. 2
Epigenomic marks and expression for three key transcription factors. a Isl1 encodes a key pituitary transcription factor that is expressed in both TαT1 (red) and GHF-T1 (blue) cell lines. Data from RNA-Seq, CUT&RUN for active chromatin marks (H3K27Ac and H3K4Me1), open chromatin (ATAC-seq), and CUT&RUN for repressive chromatin marks (H3K27Me3) is visualized for each cell line in genome browser tracks. b Gli3 is in active chromatin and expressed in GHF-T1 cells. Gli3 is not expressed in TαT1 cells, and the chromatin is inaccessible with repressive marks. c Rxrg is expressed and in active chromatin in TαT1 cells, while not expressed and bearing repressive marks in GHF-T1 cells. N = 2 for histone marks/cell line
Fig. 3
Fig. 3
Comparison of POU1F1 binding sites in GHFT1 and TαT1 cells. a Pou1f1 is expressed in both cell lines, contains active chromatin marks, and exhibits similar POU1F1 binding to enhancer elements. Data from RNA-seq, CUT&RUN for POU1F1 and active chromatin marks (H3K27Ac, H3K4Me1), ATAC-seq, and CUT&RUN for repressive marks (H3K27Me3) is visualized in genome browser tracks for TαT1 cells (red) and GHF-T1 (blue). b Tcf7l1 is an example of a gene uniquely bound by POU1F1 and expressed in GHF-T1 cells. c Nrxn1 is an example of a gene uniquely bound by POU1F1 and expressed in TαT1 cells. d A Venn diagram illustrating the number of shared and distinct POU1F1 binding sites throughout the genomes of GHF-T1 and TαT1 cells. e A Venn diagram showing the number of shared and distinct genes whose promoters and regulatory elements are bound by POU1F1 in GHF-T1 and TαT1 cells. f Scatter plot showing the FPKM of genes whose promoters are bound or not bound by POU1F1 in both TαT1 and GHF-T1 cells. In both TαT1 and GHF-T1 cells, genes whose promoters are bound by POU1F1 are more highly expressed. The boxed regions represent the middle quartiles, i.e., 25–75%. The significance is represented by asterisks (p values 4 × 10− 114 and 8 × 10− 130, respectively). N = 1 for POU1F1/cell line
Fig. 4
Fig. 4
Comparison of open chromatin between GHF-T1 and TαT1 cells and prediction of transcription factor binding. a ATAC-seq signal at POU1F1 binding sites in GHFT1 and TαT1 cells. b ATAC-seq signal at POU1F1 binding sites that are specific to TαT1 cells. c ATAC-seq signal at POU1F1 binding sites that are shared between Tα T1 and GHF-T1 cells. d ATAC-seq signal at POU1F1 binding sites that are specific to GHF-T1 cells. e POU1F1 signal at enhancers in GHFT1 cells. f POU1F1 signal at enhancers in TαT1 cells. g The composition of active (teal) chromatin states vs repressed or unmarked chromatin states (brown) for POU1F1 binding sites in GHF-T1 and TαT1 cells is compared. Active states are defined as states 1–6 (Supplemental Figure 5). TαT1-specific sites (gained in differentiation, left) are mostly active in TαT1 cells, while shared sites (center) have equivalent active states. GHF-T1-specific sites (lost in differentiation, right) are mostly active in GHFT1 cells. h Density of POU1F1 motifs across POU1F1 binding sites in GHF-T1 cells (blue), TαT1 cells (red), at TαT1-specific POU1F1 binding sites that are repressed in GHF-T1 cells and active in TαT1 cells (repressed to active, green), POU1F1 binding sites that are shared in GHF-T1 and TαT1 cells that are active in both (active to active, orange), and POU1F1 binding sites that are specific to GHF-T1, and are in an active state in GHF-T1 cells and a repressed state in TαT1 cells (active to repressed, purple). i Similar analysis as h, for the bZIP transcription factor sites, like FRA1. j Similar analysis as h, for the HTH transcription factor sites, like RFX1. k Similar analysis as h, for bHLH transcription factor sites, like ASCL1. Supplemental Figure 6 shows more motifs
Fig. 5
Fig. 5
Comparison of putative enhancers in GHF-T1 and TαT1 cells. a A Venn diagram showing the number of shared and distinct enhancers in GHF-T1 and TαT1 cells (top). A Venn diagram showing the number of shared and distinct stretch enhancers in GHF-T1 and TαT1 cells (bottom). b A histogram showing the distribution of enhancer sizes in GHF-T1 (in blue) and TαT1 cells (in red). c A histogram showing the log 2-fold-change in expression of the genes that are closest to GHF-T1-specific stretch enhancers (blue), TαT1-specific stretch enhancers (red), and shared stretch enhancers (black). d Number of TαT1 (red) and GHF-T1 (blue) stretch enhancers within 100 kb (50 kb upstream or downstream) of the TSS of 25 genes important for thyrotrope function (Supplemental Table 3). To evaluate the significance of the difference, 25 genes were randomly selected, normalized for gene expression, and assessed for stretch enhancers. This process was repeated in 10,000 iterations and displayed as a histogram (gray)
Fig. 6
Fig. 6
Functional testing of putative enhancers by transient transfection. a Tracks for RNA-seq, POU1F1, H3K27Ac, H3K4Me1, ATAC-seq, and H3K27Me3 are shown for Gata2 in TαT1 (red) and GHF-T1 (blue) cells. The putative enhancer regions cloned for the luciferase assay are highlighted in red, orange, green, light blue, and dark blue. b The level of luciferase activity of each element relative to the smallest promoter region is shown. Prom 1, 2, and 3 represent the Gata2 promoter with 0.2, 0.9, and 2.8 kb of 5′ flanking region, respectively. 1, 2, and 3 represent the three similarly highlighted elements in a tested in both the forward (circles) and reverse (x’s) orientation upstream of the 0.2 kb Gata2 promoter. The significance was evaluated with a two-sided t-test and indicated with asterisks where p value < 0.05 = * and p value < 0.01 = **. c Same tracks as in a, at the Cga locus, where elements tested are highlighted. d Level of luciferase activity of each element, color-coordinated with the highlighted elements in c in both the forward (circles) and reverse (x’s) orientation. e Same tracks as in a at the Pitx1 locus, where elements tested are highlighted. f Level of luciferase activity of each element, color-coordinated with the highlighted elements in f. Elements were tested only in the forward orientation. N = 6 replicates/reporter gene
Fig. 7
Fig. 7
Evaluation of Tshb regulatory elements in transfection and transgenic mice. a Tracks illustrating the results of RNA-seq, CUT&RUN for POU1F1, H3K27Ac, and H3K4Me1, ATAC-seq, and CUT&RUN for H3K27Me3 are shown for the Tshb locus in TαT1 cells (red) and GHF-T1 cells (blue). Elements that were tested functionally are highlighted. The significance is indicated with asterisks: p value < 0.05 = *; p value < 0.01 = **. b TαT1 cells were transfected with a 438 bp Tshb promoter-proximal element fused to luciferase and putative regulatory elements in the forward (filled circles) or reverse (x) orientation. Luciferase activity for each construct is normalized to the promoter-only luciferase activity and significant differences from promoter alone are indicated with asterisks (p < 0.05 = * and p < 0.01 = **). c Heterologous CV1 cells were transfected with the Tshb promoter-only construct or the promoter plus element 4 construct, along with expression vectors for POU1F1 and/or GATA2 as indicated by + or −. Significant differences from the reporter gene alone are indicated with asterisks (p < 0.05 = * and p < 0.01 = **). The values obtained for both constructs with POU1F1 or GATA2 expression vectors were significantly different, p < 0.01. d Genome browser track illustrating element 4 (1.4 kb located 6.6–7.7 kb upstream of the Tshb transcription start site) with experimentally determined sites for POU1F1 binding and ATAC-seq, and predicted binding sites for POU1F1, GATA2, and PITX1 that reach a confidence level of at least 0.8 in JASPAR. An extended list of binding motifs predicted in Element 4 is presented is in Supplemental Table 5. e A section of the pituitary gland from transgenic founder 399 was co-immunostaining for YFP (red) and TSHB (green), revealing overlap in expression (yellow). Nuclei are stained with DAPI (blue). f Same as e, in founder mouse 423. For transfections, N = 6/reporter gene

Similar articles

Cited by

References

    1. Jarvis JP, Scheinfeldt LB, Soi S, Lambert C, Omberg L, Ferwerda B, Froment A, Bodo JM, Beggs W, Hoffman G, Mezey J, Tishkoff SA. Patterns of ancestry, signatures of natural selection, and genetic association with stature in Western African pygmies. PLoS Genet. 2012;8(4):e1002641. doi: 10.1371/journal.pgen.1002641. - DOI - PMC - PubMed
    1. Turchin MC, Chiang CW, Palmer CD, Sankararaman S, Reich D, Genetic Investigation of ATC. Hirschhorn JN. Evidence of widespread selection on standing variation in Europe at height-associated SNPs. Nat Genet. 2012;44(9):1015–1019. doi: 10.1038/ng.2368. - DOI - PMC - PubMed
    1. Ye Z, Li Z, Wang Y, Mao Y, Shen M, Zhang Q, Li S, Zhou L, Shou X, Chen J, Song Z, Ma Z, Zhang Z, Li Y, Ye H, Huang C, Wang T, He W, Zhang Y, Xie R, Qiao N, Qiu H, Huang S, Wang M, Shen J, Wen Z, Li W, Liu K, Zhou J, Wang L, Ji J, Wang Y, Chen H, Cheng H, Shi Z, Zhu Y, Geng D, Yao Z, Tang W, Lu B, Pan L, Zhang Y, Bao W, Wu J, Zheng K, Shi Y, Zhao Y. Common variants at 10p12.31, 10q21.1 and 13q12.13 are associated with sporadic pituitary adenoma. Nat Genet. 2015;47(7):793–797. doi: 10.1038/ng.3322. - DOI - PubMed
    1. Edwards SL, Beesley J, French JD, Dunning AM. Beyond GWASs: illuminating the dark road from association to function. Am J Hum Genet. 2013;93(5):779–797. doi: 10.1016/j.ajhg.2013.10.012. - DOI - PMC - PubMed
    1. Mayran A, Khetchoumian K, Hariri F, Pastinen T, Gauthier Y, Balsalobre A, Drouin J. Pioneer factor Pax7 deploys a stable enhancer repertoire for specification of cell fate. Nat Genet. 2018;50(2):259–269. doi: 10.1038/s41588-017-0035-2. - DOI - PubMed

Publication types