. 2021 Apr 15;21(1):219.
doi: 10.1186/s12935-021-01915-x.

Establishment and validation of a prognostic signature for lung adenocarcinoma based on metabolism-related genes

Affiliations

Establishment and validation of a prognostic signature for lung adenocarcinoma based on metabolism-related genes

Zhihao Wang et al. Cancer Cell Int. .

Abstract

Background: Given that dysregulated metabolism has been recently identified as a hallmark of cancer biology, this study aims to establish and validate a prognostic signature of lung adenocarcinoma (LUAD) based on metabolism-related genes (MRGs).

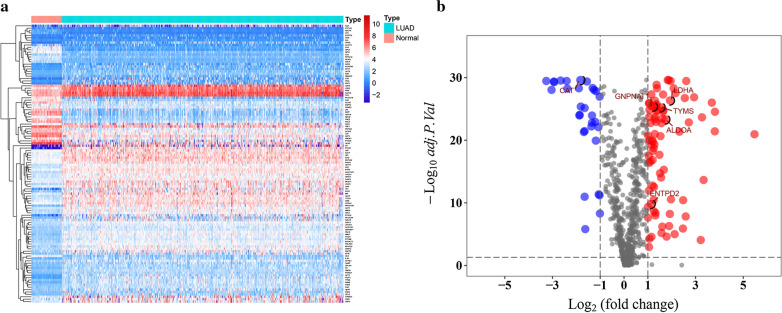
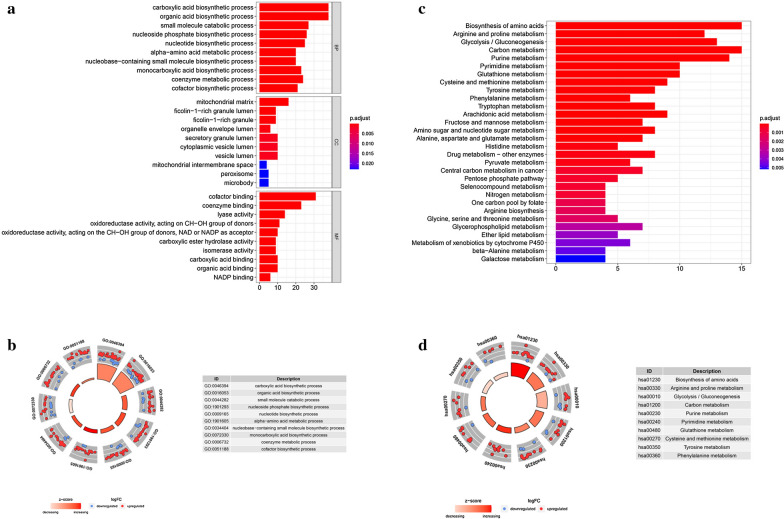
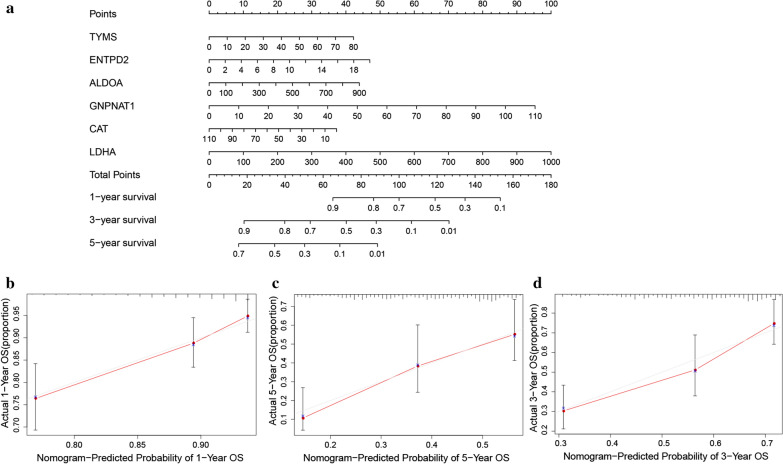
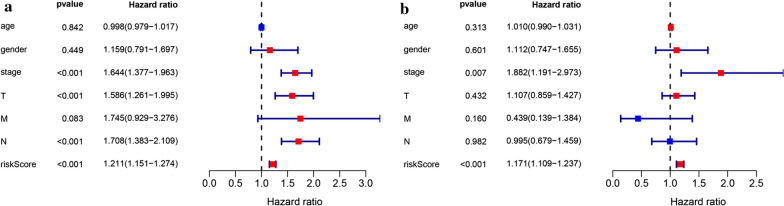
Methods: The gene sequencing data of LUAD samples with clinical information and the metabolism-related gene set were obtained from The Cancer Genome Atlas (TCGA) and Molecular Signatures Database (MSigDB), respectively. The differentially expressed MRGs were identified by Wilcoxon rank sum test. Then, univariate cox regression analysis was performed to identify MRGs that related to overall survival (OS). A prognostic signature was developed by multivariate Cox regression analysis. Furthermore, the signature was validated in the GSE31210 dataset. In addition, a nomogram that combined the prognostic signature was created for predicting the 1-, 3- and 5-year OS of LUAD. The accuracy of the nomogram prediction was evaluated using a calibration plot. Finally, cox regression analysis was applied to identify the prognostic value and clinical relationship of the signature in LUAD.

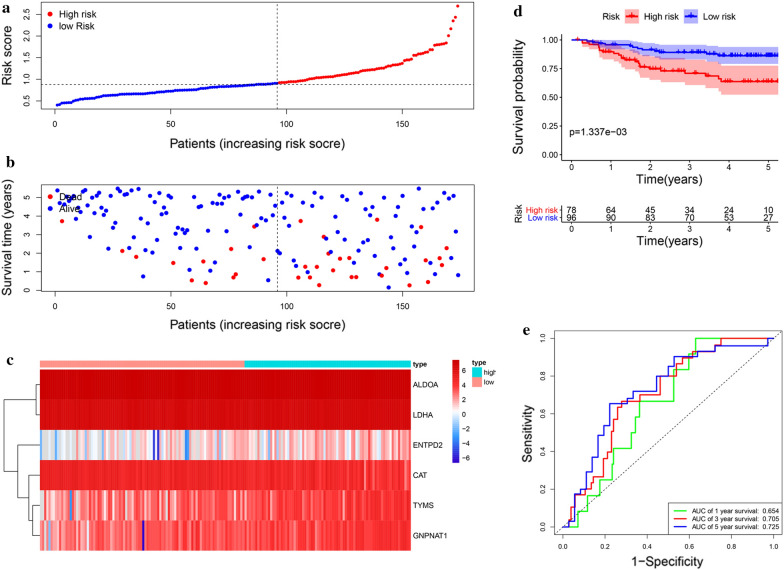
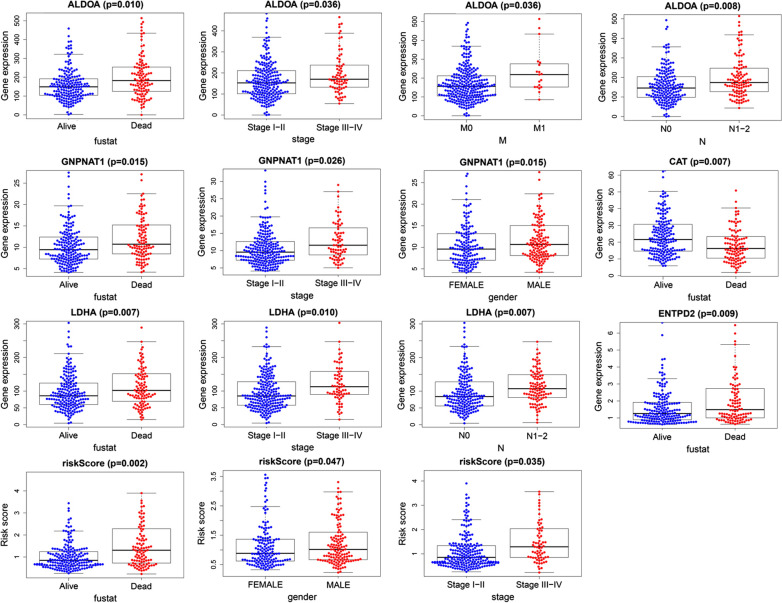
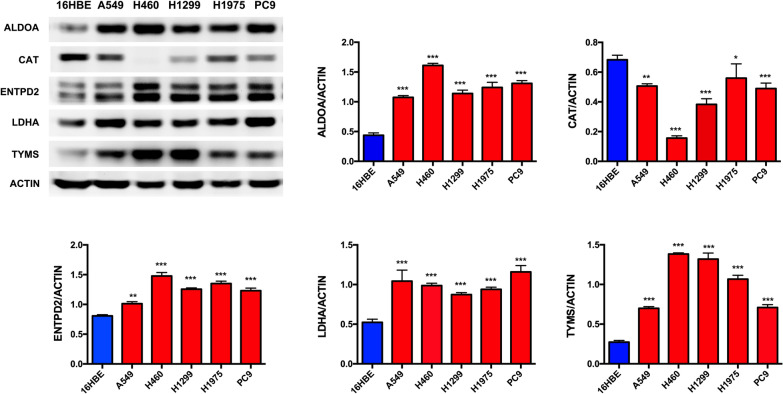
Results: A total of 116 differentially expressed MRGs were detected in the TCGA dataset. We found that 12 MRGs were most significantly associated with OS by using the univariate regression analysis in LUAD. Then, multivariate Cox regression analyses were applied to construct the prognostic signature, which consisted of six MRGs-aldolase A (ALDOA), catalase (CAT), ectonucleoside triphosphate diphosphohydrolase-2 (ENTPD2), glucosamine-phosphate N-acetyltransferase 1 (GNPNAT1), lactate dehydrogenase A (LDHA), and thymidylate synthetase (TYMS). The prognostic value of this signature was further successfully validated in the GSE31210 dataset. Furthermore, the calibration curve of the prognostic nomogram demonstrated good agreement between the predicted and observed survival rates for each of OS. Further analysis indicated that this signature could be an independent prognostic indicator after adjusting to other clinical factors. The high-risk group patients have higher levels of immune checkpoint molecules and are therefore more sensitive to immunotherapy. Finally, we confirmed six MRGs protein and mRNA expression in six lung cancer cell lines and firstly found that ENTPD2 might played an important role on LUAD cells colon formation and migration.

Conclusions: We established a prognostic signature based on MRGs for LUAD and validated the performance of the model, which may provide a promising tool for the diagnosis, individualized immuno-/chemotherapeutic strategies and prognosis in patients with LUAD.

Keywords: Lung adenocarcinoma; Metabolism‐related genes; Prognostic; The Cancer Genome Atlas.


Conflict of interest statement

All authors declare no conflict of interests.

Figures

Fig. 1
Fig. 1
Differentially expressed MRGs in LUAD. a Heatmap of MRGs between LUAD and normal lung tissues in TCGA database; The color from blue to red represents the progression from low expression to high expression. b Volcano plot of MRGs in TCGA database; The red dots in the plot represents upregulated genes and blue dots represents downregulated genes with statistical significance. Gray dots represent no differentially expressed genes
Fig. 2
Fig. 2
Gene functional enrichment analysis of differentially expressed MRGs. a The top 30 significant terms of GO function enrichment. BP biological process, CC cellular component, MF molecular function. b The GO circle shows the scatter map of the logFC of the specified gene. c The top 30 significant terms of KEGG analysis. The KEGG circle shows the scatter map of the logFC of the specified gene. The higher the Z-score value indicated, the higher expression of the enriched pathway
Fig. 3
Fig. 3
Establishment of metabolism-related prognostic signature . a Identified these differentially expressed MRGs related to the LUAD risks by univariate cox regression analysis. P values < 0.001 were considered to be statistically significant. b Screening of optimal parameter (lambda) at which the vertical lines were drawn. c Lasso coefficient profiles of the seventeen MRGs with non-zero coefficients determined by the optimal lambda. d Multivariate cox analysis to developing a prognostic index based on these MRGs
Fig. 4
Fig. 4
Construction of the metabolism-based prognostic risk signature in the TCGA cohort. The risk score distribution of LUAD patients; Survival status and duration of patients; c Heatmap of the metabolism-related genes expression; d Survival curves for the low risk and high risk groups; e Time-independent receiver operating characteristic (ROC) analysis of risk scores for prediction the OS in the TCGA dataset
Fig. 5
Fig. 5
Validation of the metabolism-based prognostic risk signature in the GSE31210 cohort. The risk score distribution of LUAD patients; Survival status and duration of patients; Heatmap of the metabolism-related genes expression; Survival curves for the low risk and high risk groups; Time-independent ROC analysis of risk scores for prediction the overall survival in the GSE31210 dataset
Fig. 6
Fig. 6
Construction of a nomogram based on the metabolism-related signature in the TCGA cohort. a The nomogram based on the signature in LUAD patients at 1, 3, and 5 years. b–d Calibration curves of nomogram for the signature at 1, 3, and 5 years
Fig. 7
Fig. 7
Comparison of the crucial genes mRNA levels in paired adjacent normal tissues and LUAD tissues from TCGA. a ALDOA, CAT, c ENTPD2, d GNPNAT1, LDHA, TYMS
Fig. 8
Fig. 8
Verification of hub MRGs expression in LUAD and normal lung tissue using the HPA database. a ALDOA, CAT, c ENTPD2, d GNPNAT1, e LDHA, TYMS
Fig. 9
Fig. 9
Univariate (a) and multivariate (b) independent prognostic analysis of independent risk factors for OS in patients with LUAD
Fig. 10
Fig. 10
Relationships between MRGs expression and clinicopathological factors in LUAD (P < 0.05)
Fig. 11
Fig. 11
Assessing the immuno-/chemotherapeutic response of the risk subtypes for LUAD patients. a The expression of immune checkpoint molecules (PD-L1, PD-L2, CTLA-4 and PD-1) between low-risk group and high-risk group; b The IC50 indicated the efficiency of chemotherapy to low- and high-risk groups by cisplatin, paclitaxel, docetaxel and gefitinib. * p < 0.05, ** p < 0.01, *** p < 0.001
Fig. 12
Fig. 12
Validation of MRGs protein expression by western blot. * p < 0.05, ** p < 0.01, *** p < 0.001
Fig. 13
Fig. 13
Validation of MRGs mRNA expression by real-time PCR. a mRNA expression of CAT in 6 lung cancer cells; b mRNA expression of ENTPD2 in 6 lung cancer cells; mRNA expression of LDHA in 6 lung cancer cells; ** p < 0.01, *** p < 0.001
Fig. 14
Fig. 14
Validation the function of ENTPD2 by colon assay and migration. a Confirm of POM1 inhibited ENTPD2 expression by western blot; b Inhibit ENTPD2 could inhibit the clone formation in lung adenocarcinoma cells; c Inhibit ENTPD2 could inhibit cell migration in lung adenocarcinoma cells. * p < 0.05, ** p < 0.01, *** p < 0.001

Similar articles

Cited by

References

    1. Siegel RL, Miller KD, Jemal A. Cancer statistics, 2019. Cancer J Clin. 2019;69(1):7–34. doi: 10.3322/caac.21551. - DOI - PubMed
    1. Travis WD. Reporting lung cancer pathology specimens. Impact of the anticipated 7th Edition TNM Classification based on recommendations of the IASLC Staging Committee. Histopathology. 2009;54(1):3–11. doi: 10.1111/j.1365-2559.2008.03179.x. - DOI - PubMed
    1. Ferlay J, Colombet M, Soerjomataram I, Mathers C, Parkin DM, Pineros M, Znaor A, Bray F. Estimating the global cancer incidence and mortality in 2018: GLOBOCAN sources and methods. Int J Cancer. 2019;144(8):1941–53. doi: 10.1002/ijc.31937. - DOI - PubMed
    1. Cancer Genome Atlas Research N Author Correction: Comprehensive molecular profiling of lung adenocarcinoma. Nature. 2018;559(7715):E12–2. doi: 10.1038/s41586-018-0228-6. - DOI - PubMed
    1. Paez JG, Janne PA, Lee JC, Tracy S, Greulich H, Gabriel S, Herman P, Kaye FJ, Lindeman N, Boggon TJ, et al. EGFR mutations in lung cancer: Correlation with clinical response to gefitinib therapy. Science. 2004;304(5676):1497–500. doi: 10.1126/science.1099314. - DOI - PubMed

LinkOut - more resources