. 2021 Apr;9(4):e002071.
doi: 10.1136/jitc-2020-002071.

HLA Ligand Atlas: a benign reference of HLA-presented peptides to improve T-cell-based cancer immunotherapy

Affiliations

HLA Ligand Atlas: a benign reference of HLA-presented peptides to improve T-cell-based cancer immunotherapy

Ana Marcu et al. J Immunother Cancer. 2021 Apr.

Abstract

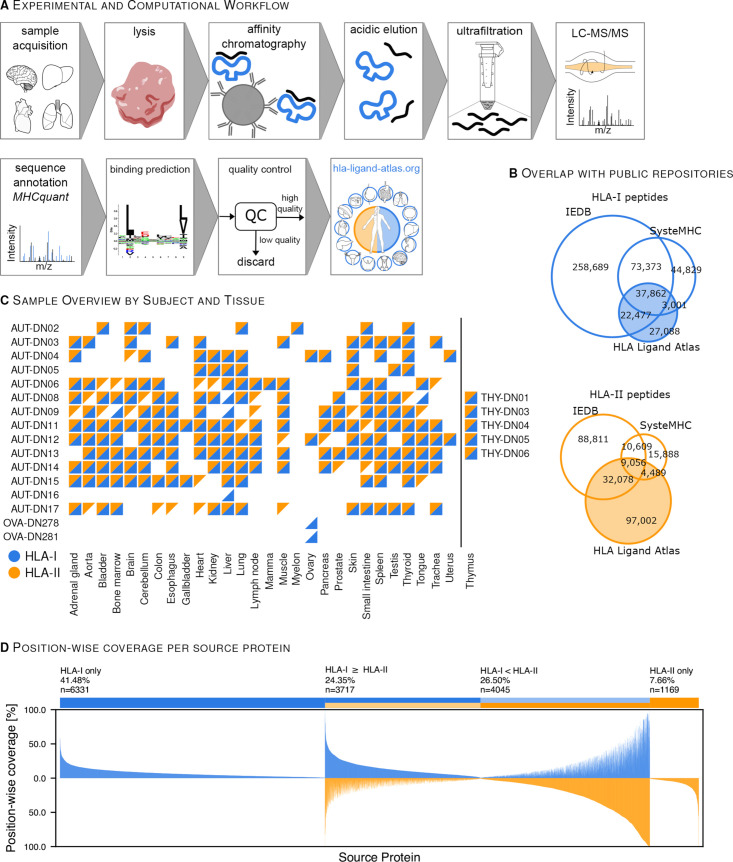
Background: The human leucocyte antigen (HLA) complex controls adaptive immunity by presenting defined fractions of the intracellular and extracellular protein content to immune cells. Understanding the benign HLA ligand repertoire is a prerequisite to define safe T-cell-based immunotherapies against cancer. Due to the poor availability of benign tissues, if available, normal tissue adjacent to the tumor has been used as a benign surrogate when defining tumor-associated antigens. However, this comparison has proven to be insufficient and even resulted in lethal outcomes. In order to match the tumor immunopeptidome with an equivalent counterpart, we created the HLA Ligand Atlas, the first extensive collection of paired HLA-I and HLA-II immunopeptidomes from 227 benign human tissue samples. This dataset facilitates a balanced comparison between tumor and benign tissues on HLA ligand level.

Methods: Human tissue samples were obtained from 16 subjects at autopsy, five thymus samples and two ovary samples originating from living donors. HLA ligands were isolated via immunoaffinity purification and analyzed in over 1200 liquid chromatography mass spectrometry runs. Experimentally and computationally reproducible protocols were employed for data acquisition and processing.

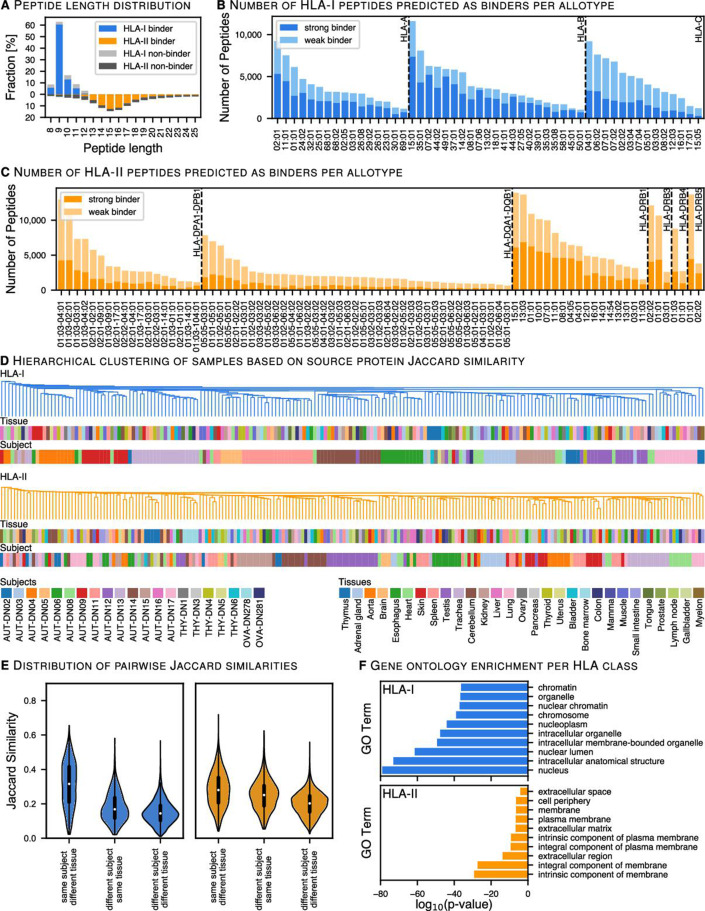
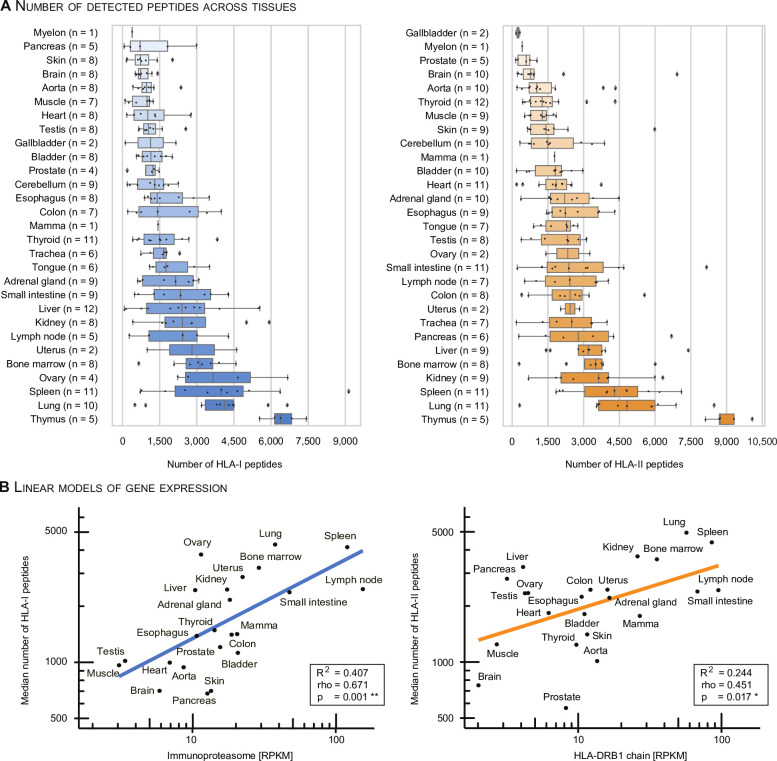
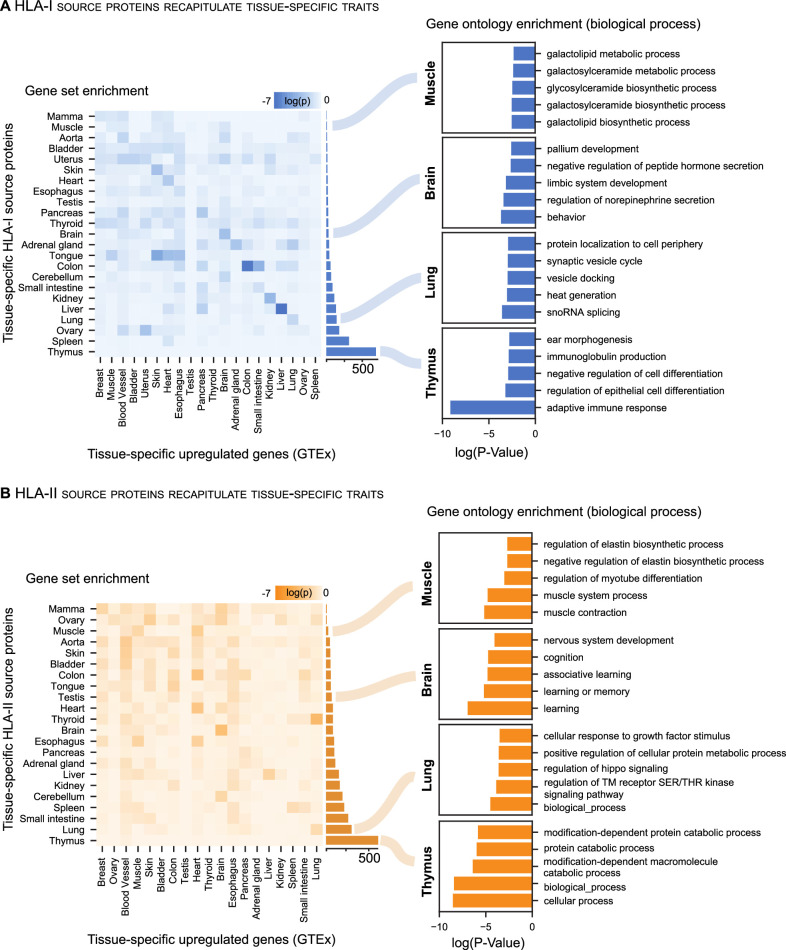
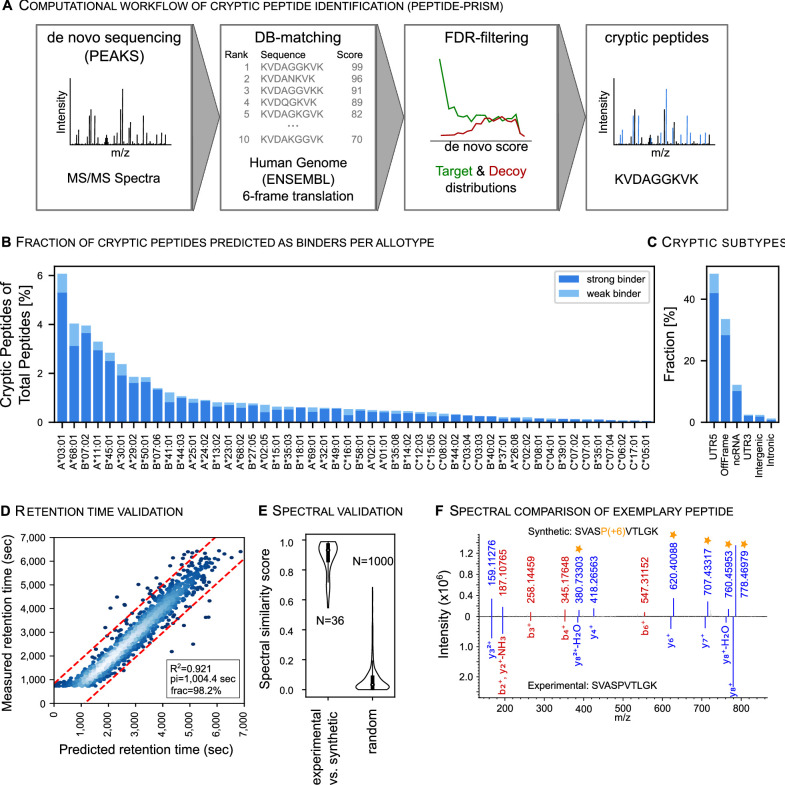
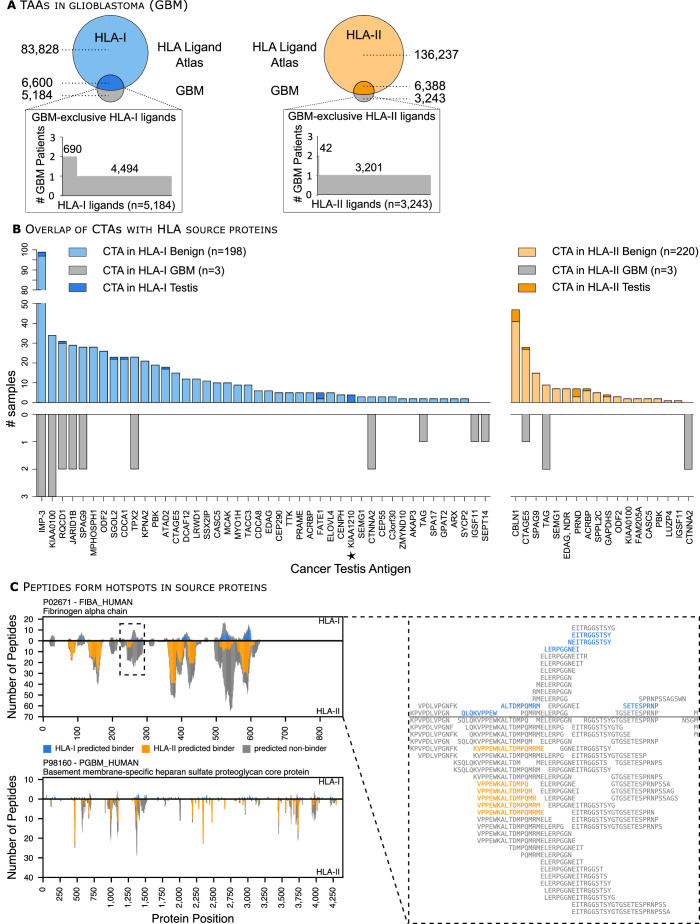
Results: The initial release covers 51 HLA-I and 86 HLA-II allotypes presenting 90,428 HLA-I- and 142,625 HLA-II ligands. The HLA allotypes are representative for the world population. We observe that immunopeptidomes differ considerably between tissues and individuals on source protein and HLA-ligand level. Moreover, we discover 1407 HLA-I ligands from non-canonical genomic regions. Such peptides were previously described in tumors, peripheral blood mononuclear cells (PBMCs), healthy lung tissues and cell lines. In a case study in glioblastoma, we show that potential on-target off-tumor adverse events in immunotherapy can be avoided by comparing tumor immunopeptidomes to the provided multi-tissue reference.

Conclusion: Given that T-cell-based immunotherapies, such as CAR-T cells, affinity-enhanced T cell transfer, cancer vaccines and immune checkpoint inhibition, have significant side effects, the HLA Ligand Atlas is the first step toward defining tumor-associated targets with an improved safety profile. The resource provides insights into basic and applied immune-associated questions in the context of cancer immunotherapy, infection, transplantation, allergy and autoimmunity. It is publicly available and can be browsed in an easy-to-use web interface at https://hla-ligand-atlas.org .

Keywords: adaptive immunity; antigen presentation; antigens; carbohydrate; immunotherapy; translational medical research; tumor-associated.


Conflict of interest statement

Competing interests: LB, DJK, ML and LKF are employees of Immatics Biotechnologies. LB, DJK, MWL and SS are inventors of patents owned by Immatics Biotechnologies. MWL has acted as a paid consultant in cancer immunology for Boehringer Ingehlheim Pharma & Co. KG. H-GR is shareholder of Immatics Biotechnologies and Curevac AG.

Figures

Figure 1
Figure 1
The HLA Ligand Atlas: content and scope of the data resource. (A) The high-throughput experimental and computational workflow steps used to analyze thousands of HLA-I and HLA-II peptides isolated from benign tissues. The resulting HLA-I and HLA-II immunopeptidomes are comprised in the searchable web resource: https://hla-ligand-atlas.org. See online supplemental figure S1 for details of the quality control workflow. See online supplemental figure S2 for proof of principle using autopsy tissues. (B) HLA-I and HLA-II peptides expand the know immunopeptidome as curated in the public repositories SysteMHC and IEDB. (C) Sample matrix: HLA-I- (blue triangles) and HLA-II samples (orange triangles) included in the HLA Ligand Atlas cover 29 different tissues obtained from 21 human subjects. See online supplemental table S1 for patient characteristics. (D) Position-wise coverage (%) of identified source proteins by HLA ligands binned into four groups: (1) exclusively covered by HLA-I peptides, (2) exclusively covered by HLA-II peptides and (3–4) covered by both and separated into higher position-wise coverage by either HLA-I or HLA-II peptides. HLA, human leucocyte antigen; IEDB, immune epitope database; LC-MS/MS, liquid chromatography mass spectrometry.
Figure 2
Figure 2
Source proteins and HLA allotype coverage characteristics of HLA ligands. (A) Length distribution of identified HLA-I and HLA-II peptides from all samples was analyzed. HLA-II peptide lengths are mirrored on the negative side of the x-axis. (B, C) Global overview of HLA-I predicted binders distributed across HLA molecules. HLA binding prediction was performed with NetMHCpan-4.1 (% binding rank ≤2) and SYFPEITHI (Score >50%), while multiple HLA allotypes per peptide were allowed as long as their scores met the aforementioned thresholds. HLA binding prediction for HLA-II ligands was performed with NetMHCIIpan-4.0 and MixMHC2pred (% binding rank ≤5 for both). (D) Pairwise hierarchical clustering of samples based on the Jaccard similarity between HLA-I (blue) and HLA-II (orange) source proteins. The dendrogram illustrates the nearest neighbor based on the similarity between tissues and subjects. (E) Violin plots illustrate the distribution of the Jaccard similarity index for each pairwise comparison between the same subject—different tissues; different subjects—the same tissue and different subject—different tissues. (F) Gene ontology (GO) term enrichment of cellular components was performed for HLA-I and HLA-II source proteins. Top10 enriched genes with respect to their log10 p value (Fisher’s exact test) differentiate between intracellular and extracellular antigen processing pathways. HLA, human leucocyte antigen.
Figure 3
Figure 3
Tissues exhibit a gradual separation based on the immunopeptidome yield. (A) The number of identified HLA-I and HLA-II peptides per sample (subject and tissue combinations) was sorted and plotted by median immunopeptidome yield per tissue. Boxes span the inner two quantiles of the distribution and whiskers extend by the same length outside the box. Remaining outlier samples are indicated as black diamonds. The number of subjects contributing to each tissue is illustrated on the y-axis in parenthesis. (B) A linear model was used to correlate the log transformed HLA-I and HLA-II median peptide yields with log transformed median gene expression counts (RPKM) of the immunoproteasome and HLA-DRB1 per tissue. Corresponding R2, p value (F-statistic) and spearman rho are indicated in the bottom right box. HLA, human leucocyte antigen.
Figure 4
Figure 4
Small subsets of source proteins are tissue exclusive. (A, B) Gene set enrichment (left) was tested for each tissue by correlating unique HLA-I and HLA-II source proteins per tissue with upregulated genes as annotated in GTEx. Heatmaps depict log10 p values (Fisher’s exact test) for each pairwise comparison. The number of tissue-specific HLA-I and HLA-II source proteins is depicted through the bar plot for each tissue on the right-hand side of the heatmaps. In addition, GO term enrichment (right) of biological processes was performed using the panther DB webservice for selected tissues with the same set of HLA-I and HLA-II tissue-specific source proteins. Top five enriched terms with respect to their log10 p value (Fisher’s exact test) were selected. DB, database; GO, gene ontology; HLA, human leucocyte antigen.
Figure 5
Figure 5
Cryptic peptides are part of the benign immunopeptidomes. (A) Spectra were searched with Peptide-PRISM to identify peptides of cryptic origin. Briefly, de novo sequencing was performed, and top 10 sequences per spectrum were queried against a database consisting of the three-frame translated transcriptome (Ensemble 90) and the six-frame translated human genome (HG38). Target-Decoy search was performed per database stratum, separately for canonical and cryptic peptides. (B) The HLA-allotype distribution of cryptic peptides was plotted in relation to cryptic and canonical peptides predicted to bind to the respective HLA allotype across all subjects and tissues. (C) Distribution of identified cryptic peptides categorized into multiple non-coding genomic regions. (D) Linear model correlating measured retention times (RT) of cryptic peptides with their predicted RTs trained on canonical peptide RTs. Corresponding R2, pi (width of the prediction interval—red dashed lines) and frac (the number of peptides falling into the prediction interval) are indicated in the bottom right. (E) 36 cryptic peptides were selected for spectral validation with synthetic peptides. The similarity between the synthetic and experimental spectrum was computed by correlation scores. (F) Exemplary spectral comparison of the cryptic peptide SVASPVTLGK and its synthesized heavy isotope-labeled counterpart (P+6). Matching b (red) and y ions (blue) are indicated as well as the isotope mass shifted ions (orange stars) of the synthesized peptide. FDR, false discovery rate; HLA, human leucocyte antigen.
Figure 6
Figure 6
HLA Ligand Atlas data enables prioritization of tumor-associated antigens (TAAs) and HLA ligands form hotspots in source proteins. (A) The size-proportional Venn diagram illustrates the overlap between the pooled glioblastoma (GBM) and benign HLA-I and -II immunopeptidomes, respectively. The waterfall plots show the number of glioblastoma-associated HLA-I ligands and their frequency among the three GBM patients analyzed. (B) Published CTAs are presented as HLA-I or HLA-II ligands on benign tissues, including testis but also in glioblastoma tumors. The number of identified samples either from the HLA Ligand Atlas or the glioblastoma dataset is depicted on the x-axis, provided that each CTA has been identified with at least two different HLA ligands. The CTA KIA1210 was identified exclusively on HLA-I source proteins in testis and is marked with an asterisk. (C) The position-wise HLA ligand coverage profiles as available in the HLA Ligand Atlas web interface for two exemplary proteins (left), the fibrinogen alpha chain (Uniprot ID P02671, length 866 aa, top) and the basement membrane-specific heparan sulfate proteoglycan core protein (Uniprot ID P98160, length 4391 aa, bottom) are shown, illustrating the spatial clustering of HLA ligands into hotspots. For P02671 a close-up of such a cluster is shown in form of a multiple sequence alignment of the identified peptides (right). CTAs, cancer testis antigens; HLA, human leucocyte antigen, GBM, glioblastoma.

References

    1. Venter JC, Adams MD, Myers EW, et al. . The sequence of the human genome. Science 2001;291:1304–51. 10.1126/science.1058040 - DOI - PubMed
    1. Lander ES, Linton LM, Birren B, et al. . Initial sequencing and analysis of the human genome. Nature 2001;409:860–921. 10.1038/35057062 - DOI - PubMed
    1. Melé M, Ferreira PG, Reverter F, et al. . Human genomics. the human transcriptome across tissues and individuals. Science 2015;348:660–5. 10.1126/science.aaa0355 - DOI - PMC - PubMed
    1. Ardlie KG, DeLuca DS, Segrè A, et al. . Human genomics. The Genotype-Tissue expression (GTEx) pilot analysis: multitissue gene regulation in humans. Science 2015;348:648–60. 10.1126/science.1262110 - DOI - PMC - PubMed
    1. Uhlén M, Fagerberg L, Hallström BM, et al. . Proteomics. Tissue-based map of the human proteome. Science 2015;347:1260419. 10.1126/science.1260419 - DOI - PubMed

Publication types

MeSH terms