. 2021 Apr 16;372(6539):eabb1590.
doi: 10.1126/science.abb1590.

An intercrypt subpopulation of goblet cells is essential for colonic mucus barrier function

Affiliations

An intercrypt subpopulation of goblet cells is essential for colonic mucus barrier function

Elisabeth E L Nyström et al. Science. .

Abstract

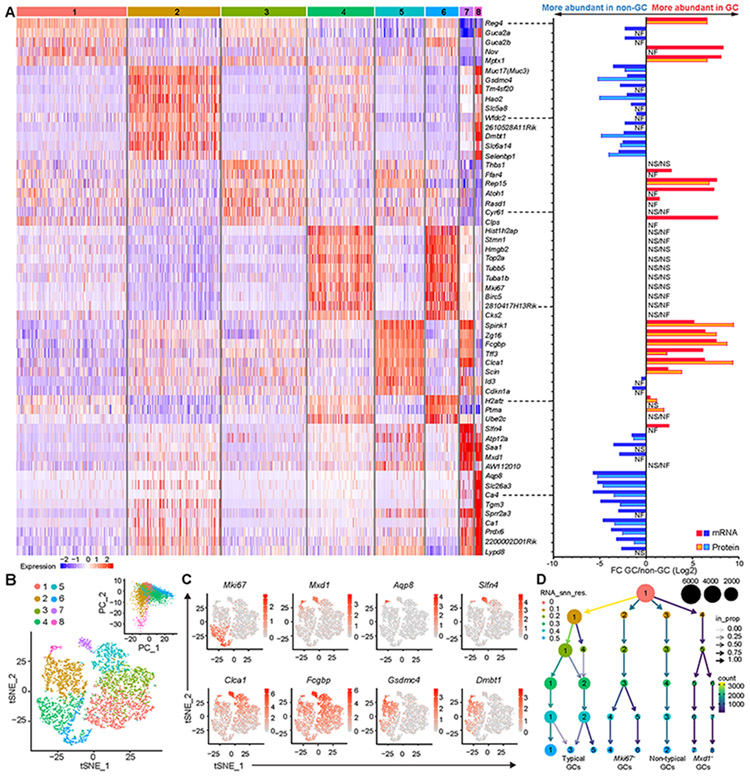
The intestinal mucus layer, an important element of epithelial protection, is produced by goblet cells. Intestinal goblet cells are assumed to be a homogeneous cell type. In this study, however, we delineated their specific gene and protein expression profiles and identified several distinct goblet cell populations that form two differentiation trajectories. One distinct subtype, the intercrypt goblet cells (icGCs), located at the colonic luminal surface, produced mucus with properties that differed from the mucus secreted by crypt-residing goblet cells. Mice with defective icGCs had increased sensitivity to chemically induced colitis and manifested spontaneous colitis with age. Furthermore, alterations in mucus and reduced numbers of icGCs were observed in patients with both active and remissive ulcerative colitis, which highlights the importance of icGCs in maintaining functional protection of the epithelium.


Figures

Fig. 1.
Fig. 1.. Multi-omics analysis of purified GCs from the distal colon (DC) and the distal small intestine (Si8).
(A) Volcano plots of transcriptome and proteome in GC and non-GC populations. (B) Venn diagram indicating the number of genes and proteins associated with each population using fold change (FC) values ≥ 2 and adjusted-p value ≤ 0.05 (protein) or ≤ 0.01 (mRNA). (C) Heat maps of the 50 genes and proteins most differentially expressed in the GCs compared to non-GCs. (D) Biological processes upregulated in GCs according to Gene Ontology (GO) enrichment analysis. Four replicates (pool of two mice per replicate).
Fig. 2.
Fig. 2.. Different clusters identified among the Muc2+ cells in the distal colon by single-cell analysis.
(A) Left panel: Heat map of up to 10 enriched genes per cluster; Right panel: mRNA and protein FC of GC to non-GC genes displayed in the heat map. (B) tSNE plot of colonic GCs grouped in eight clusters and principal component analysis (PCA) of cluster diversity. (C) tSNE plots highlighting expression and distribution of selected genes. (D) Cluster tree showing the four main subgroups of GCs during the clustering process. Two replicates (two mice per replicate) were combined for the analysis. FC: Fold change. NS: Not significant; NF: Not found.
Fig. 3.
Fig. 3.. Pseudotime analysis unveils two trajectories of GCs in the distal colon.
(A) Trajectory and Partition-based graph abstraction of colonic GCs. Two replicates (2 mice per replicate) were combined. (B) Expression of selected genes along the described trajectories. (C) mRNA-in situ hybridization of genes enriched in different clusters counterstained with Muc2, Epcam for cell borders and Hoechst for DNA. Scale bars = 25 μm. (D) tSNE plot, scatter plot of the bulk RNA-seq data of genes significantly enriched in the canonical and non-canonical GC populations, and biological processes upregulated in canonical GCs compared to non-canonical GCs according to GO enrichment analysis. (E) tSNE plots highlighting expression of sentinel GC signaling genes and genes dysregulated during inflammation.
Fig. 4.
Fig. 4.. Gene expression in icGCs.
(A) Biological processes upregulated in the surface located GCs (Mxd1+) compared to crypt-residing GCs according to GO enrichment analysis. (B, C, D) Violin plots of gene expression related to response to bacteria (B) protein transport (C) and processing of Muc2 (D) in the different clusters. (E) Staining with WGA, UEA1, the nonO-glycosylated Muc2 precursor and Hoechst for DNA in a colonic cross section. Arrowheads indicate crypt-opening GC (yellow) and an icGC (pink). Scale bars = 20 μm, and 10 μm in magnification; n = 24. (F) Mouse colonic section stained with AB-PAS or mature Muc2 with icGCs indicated (pink arrowheads). Epithelial surface (dashed line), scale bars = 50 and 20 μm (left and right panel in AB-PAS). (G) Violin plots of mucus gene expression in the different clusters. (H) Violin and tSNE plots showing expression of Spdef in GCs.
Fig. 5
Fig. 5. Colonic mucus organization and penetrability.
(A) UEA1 and WGA-stained flushed mouse colonic mucus in x/z-projection with marked (white arrowheads) crypt-openings. Color code arrowheads match images in B. (B) x/y projections at different z-stacks levels as indicated in A. Magnification of the mixed zone mucus (yellow arrowheads mark WGA and UEA1 fusion points); n = 30. (C) Intensity profile of UEA1 and WGA along a straight line in tissue proximate mucus (Fig. S9). Normalized raw data in pale color, crypt-openings (arrows); n = 17. (D) Isosurface overlay of UEA1 and WGA-stained mucus secreted from icGCs (pink arrowheads) or a crypt-opening (yellow arrowhead). (E) x/y and x/z projections of 0.2 μm fluorescent beads in WGA-stained colonic mucus. Areas with low bead concentration (dashed line), underlying crypt-openings (purple spheres), z-position for x/y projections (arrowhead); n = 6. Scale bars: 50 μm (B, E), 25 μm (A, B magnification) and 20 μm (D).
Fig. 6
Fig. 6. icGC alterations in Spdef−/− colon.
(A) Fold change (FC) expression of single GC cluster (color bars) marker genes in Spdef−/− versus WT with adjusted p-values. (B) FC expression among the previously defined single cell clusters (left) of the most up- and down-regulated genes in Spdef−/− compared to WT GCs obtained by bulk RNA seq with adjusted p-values (right). (C) UEA1, cell membrane and DNA staining of whole-mounted colonic tissue from 7 and 13 week-old WT and Spdef−/− mice. Magnified areas (white boxes), apical surface of icGCs (arrowheads), scale bars = 20 μm. (D) Quantification of the number of icGCs per mm2 in whole-mounted colons from WT and Spdef−/− mice. Mean ± SD, analyzed by 2-way ANOVA with Sidak’s multiple comparison test; n= 4 - 8. (E) TEM micrographs of icGCs in WT and Spdef−/− colon with magnifications. Scale bars = 2 μm; n = 4. (F) SEM scans of the icGCs and the epithelial surface in WT and Spdef−/− distal colon. Identified GC openings (red arrowheads), scale bars = 1 μm (upper) 20 μm (lower), n = 4. (G) In vivo labeling for 2 and 4 h by GalNAz detected by Alkyne-TAMRA on colonic sections of 13-week old WT and Spdef−/− mice. Scale bar = 20 μm; n = 4.
Fig. 7
Fig. 7. Age-dependent loss of intercrypt mucus and colitis in Spdef−/− mice.
(A) UEA1- and WGA-stained Spdef−/− colonic mucus in x/z-projection. Crypt-openings (white arrowheads), crypt plumes (dashed line). Color code arrowheads match images in B. (B) x/y projections at different z-stack levels as indicated in A. Magnification of mucus from the crypt plumes expanding to form the mucus surface mesh (arrowhead); n = 12. (C) Isosurface overlay of UEA1 and WGA. Underlying crypt-openings marked by green spheres. (D) Intensity profile of UEA1 and WGA in tissue proximate mucus (Fig. S12). Normalized raw data (pale color), crypt openings (arrows); n = 3. (E) 1 μm beads on WT and Spdef−/− colonic mucus. Mucus surfaces (dashed lines), beads at tissue (arrowhead); n = 4 - 5. (F) Normalized bead penetrability; n = 4 - 5. (G) Bacteria FISH, UEA1 and WGA in sections from WT and Spdef−/− colon; n = 7. (H) Colitis score of Spdef−/− and WT mice treated with 3% DSS; n = 3 - 13 (I) Histological colitis score in 26 week-old WT and Spdef−/− mice. Normal score range of 6-19 week-old WT (n = 14, data not shown) was set as the colitis cut-off (dashed line). (J) AB-PAS stained colonic sections from 26 week-old WT and Spdef−/− mice. Infiltrating inflammatory cells (arrowheads); n = 7. (K) Bacteria FISH in sections from 26 week-old WT and Spdef−/− animals. Epithelial surface (dashed line), bacteria at the epithelium (arrowheads); n = 4. Scale bars = 50 μm. * in images indicate shrinkage artifacts due to fixation. Graphs shows mean ± SD analyzed by 2-way ANOVA with Tukey’s multiple comparison test (F and H) or unpaired Student’s t-test (I).
Fig. 8
Fig. 8. Mucus alterations and loss of icGCs in UC patiets.
(A, B) Lectin (A) and nonO-glycosylated MUC2 immunostaining (B) in a human sigmoid colon cross section. Arrowheads: crypt-opening GC (yellow) and icGC (pink); n = 12. (C) Whole-mounted colonic tissue from control (Ctrl) and UC patients. The outer border of the crypt (dashed yellow line). (D, E, F) Number of icGCs per crypt (D), number of GCs (normalized to the relative area for each segment) at different relative positions along the crypt center-border axis (E), and GC shedding score (F) in Ctrl, UCr and UCa colonic biopsies; n= 4 - 9. (G) GC shedding (gray arrowheads) in a fixed whole-mounted UCr biopsy. Position for x/z projection (pink arrowhead). (H) Biopsies from human sigmoid colon stained ex vivo with LTL, WGA and LEL. Crypt plumes (dashed lines), level of corresponding projection (arrowhead), n = 9. (I) Mucus penetrability of 1.0 and 0.2 μm fluorescent beads. Mucus without 0.2 μm beads (dashed line), crypt-openings (arrowheads); n = 3. (J) Mucus defect scores images in biopsies from UC patients. Mucus gaps (orange arrowhead), crypt openings (white arrowheads), and z-positions for x/y projections (color coded arrowheads). (K) Mucus defect score in Ctrl, UCr and UCa patients. Scale bars = 50 μm. Bars indicate median ± interquartile range. Statistical analysis was performed by Kruskal-Wallis analysis with Dunn’s multiple comparison test.

Comment in

References

    1. Rodriguez-Pineiro AM et al., Studies of mucus in mouse stomach, small intestine, and colon. II. Gastrointestinal mucus proteome reveals Muc2 and Muc5ac accompanied by a set of core proteins. Am. J. Physiol Gastrointest. Liver Physiol 305, G348–G356 (2013). - PMC - PubMed
    1. Ermund A, Schutte A, Johansson ME, Gustafsson JK, Hansson GC, Studies of mucus in mouse stomach, small intestine, and colon. I. Gastrointestinal mucus layers have different properties depending on location as well as over the Peyer's patches. Am. J. Physiol Gastrointest. Liver Physiol 305, G341–G347 (2013). - PMC - PubMed
    1. Bergstrom JH et al., Gram-positive bacteria are held at a distance in the colon mucus by the lectin-like protein ZG16. Proc. Natl. Acad. Sci. U. S. A 113, 13833–13838 (2016). - PMC - PubMed
    1. Jakobsson HE et al., The composition of the gut microbiota shapes the colon mucus barrier. EMBO Rep 16, 164–177 (2015). - PMC - PubMed
    1. Johansson ME et al., The inner of the two Muc2 mucin-dependent mucus layers in colon is devoid of bacteria. Proc. Natl. Acad. Sci. U. S. A 105, 15064–15069 (2008). - PMC - PubMed

Publication types

MeSH terms

Substances