. 2021 Apr 20;118(16):e2013452118.
doi: 10.1073/pnas.2013452118.

E2A-regulated epigenetic landscape promotes memory CD8 T cell differentiation

Affiliations

E2A-regulated epigenetic landscape promotes memory CD8 T cell differentiation

David M Schauder et al. Proc Natl Acad Sci U S A. .

Abstract

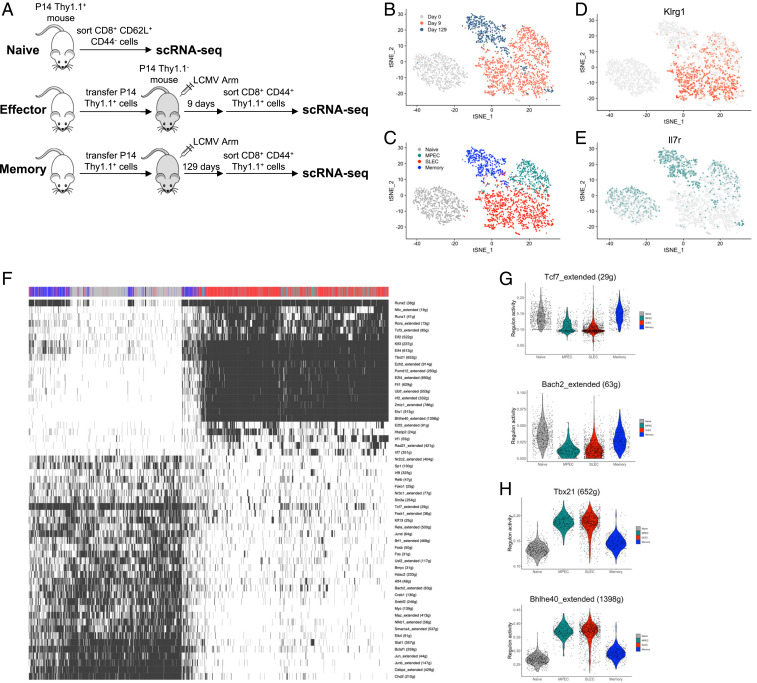
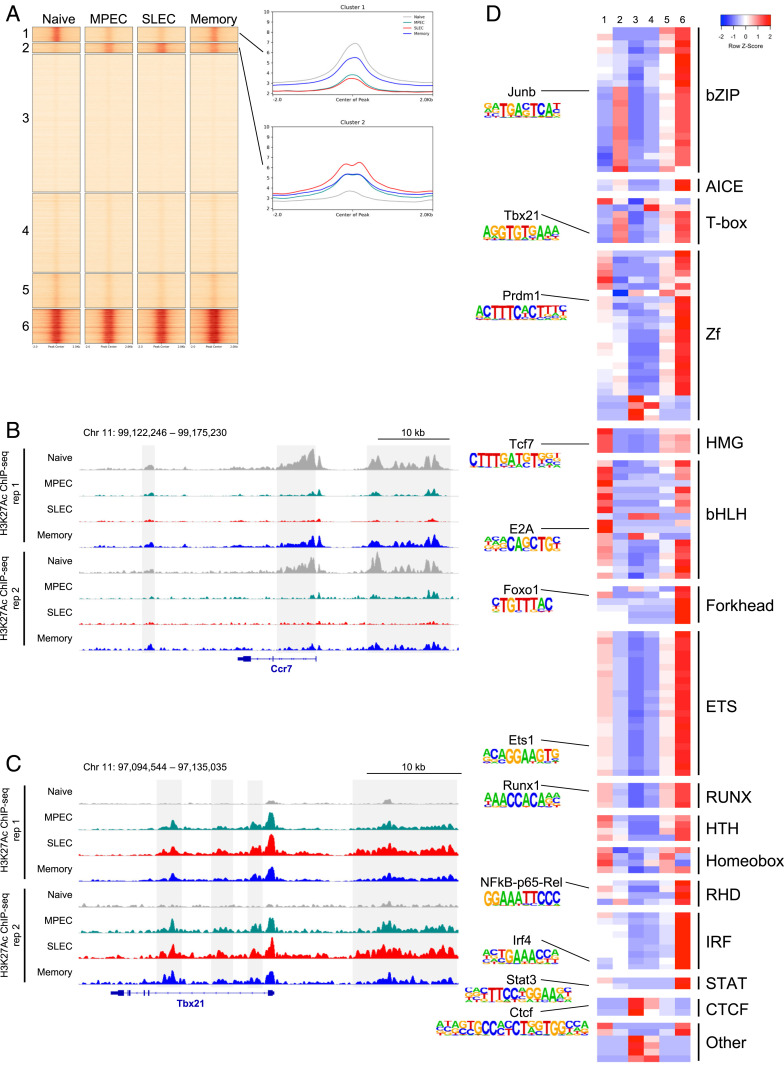
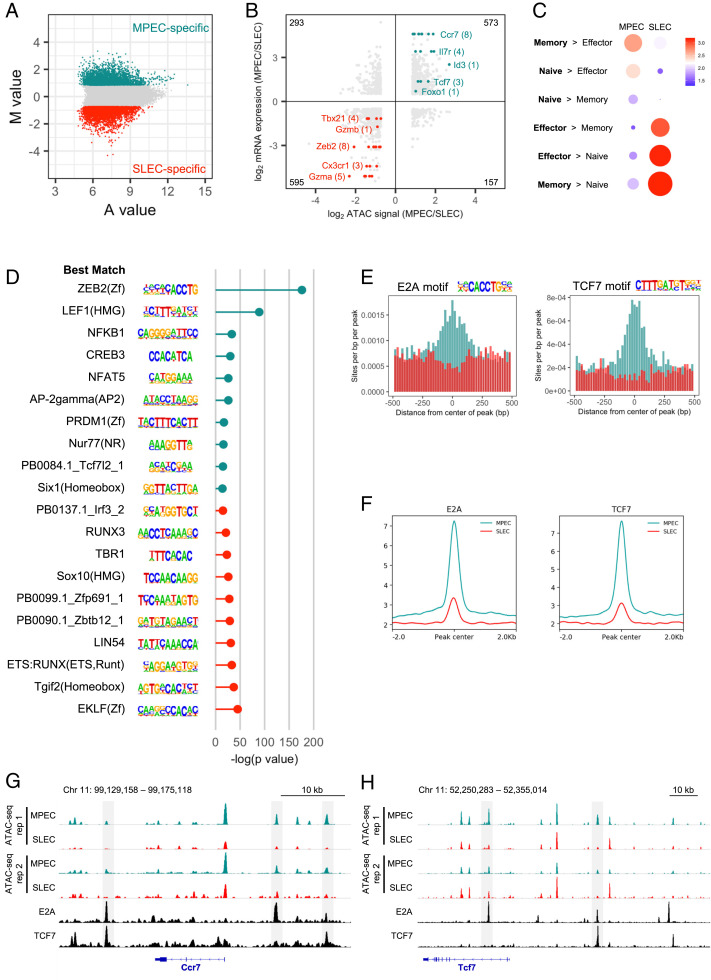
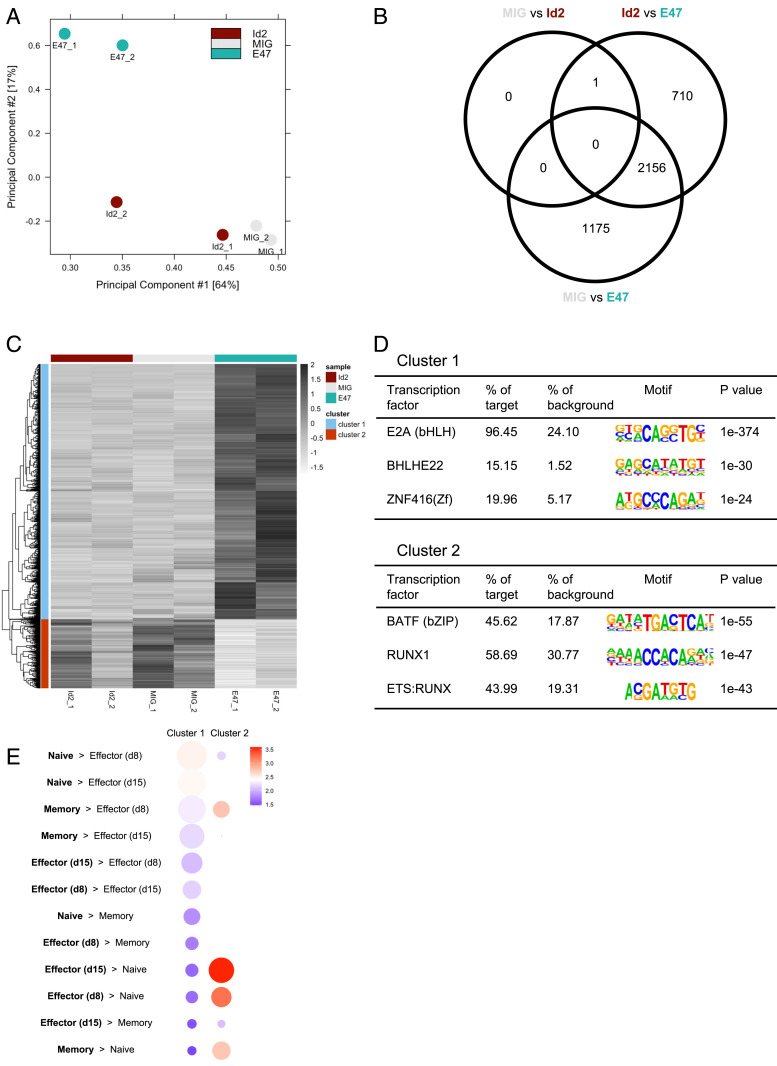
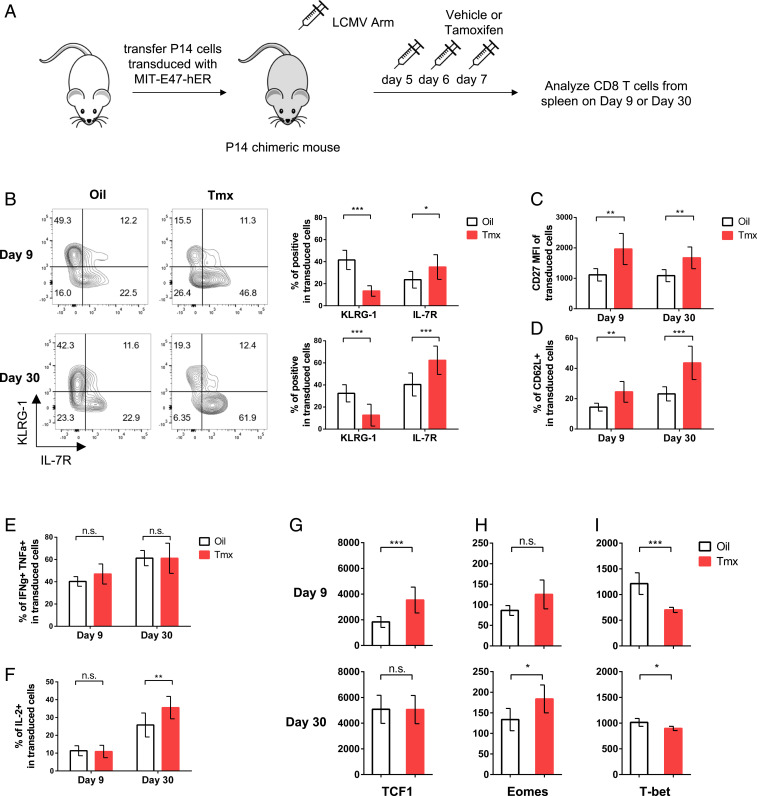
During an acute viral infection, CD8 T cells encounter a myriad of antigenic and inflammatory signals of variable strength, which sets off individual T cells on their own differentiation trajectories. However, the developmental path for each of these cells will ultimately lead to one of only two potential outcomes after clearance of the infection-death or survival and development into memory CD8 T cells. How this cell fate decision is made remains incompletely understood. In this study, we explore the transcriptional changes during effector and memory CD8 T cell differentiation at the single-cell level. Using single-cell, transcriptome-derived gene regulatory network analysis, we identified two main groups of regulons that govern this differentiation process. These regulons function in concert with changes in the enhancer landscape to confer the establishment of the regulatory modules underlying the cell fate decision of CD8 T cells. Furthermore, we found that memory precursor effector cells maintain chromatin accessibility at enhancers for key memory-related genes and that these enhancers are highly enriched for E2A binding sites. Finally, we show that E2A directly regulates accessibility of enhancers of many memory-related genes and that its overexpression increases the frequency of memory precursor effector cells and accelerates memory cell formation while decreasing the frequency of short-lived effector cells. Overall, our results suggest that effector and memory CD8 T cell differentiation is largely regulated by two transcriptional circuits, with E2A serving as an important epigenetic regulator of the memory circuit.

Keywords: CD8 T cell; LCMV; T cell memory; epigenetics; scRNA-seq.


Conflict of interest statement

The authors declare no competing interest.

Figures

Fig. 1.
Fig. 1.
scRNA-seq of CD8 T cells during acute viral infection. (A) Outline of scRNA-seq experiment. (B) t-SNE plot displaying relationship between naïve (day 0), effector (day 9), and memory (day 129) CD8 T cells during acute LCMV infection. (C) t-SNE plot displaying four clusters of CD8 T cells arising during acute LCMW infection. (D and E) t-SNE plots showing expression of Klrg1 (D) and Il7r (E), two classic markers of effector CD8 T cells with low and high potential to become memory CD8 T cells, respectively. (F) Cells were clustered based on binary regulon activity of the 56 regulons that are active in at least 1% of the cells and that correlated (absolute Pearson correlation > 0.30) with at least one other regulon. Cells are colored to indicate that a regulon is active (black) or inactive (white). (G and H) Violin plots showing distribution of continuous regulon activity in naïve and memory TF regulons (Tcf7 and Bach2) (G) or effector TF regulons (Tbx21 and Bhlhe40) (H).
Fig. 2.
Fig. 2.
Patterns of enhancer activity during memory CD8 T cell differentiation. (A) k-means clustering of H3K27Ac ChIP-seq signal at 120,019 nonpromoter chromatin accessible regions in naïve CD8 T cells, MPECs, SLECs, and memory CD8 T cells. On the right, the average H3K27Ac profile is shown for each of the four samples in clusters 1 and 2. (B and C) H3K27Ac ChIP-seq data are shown at the Ccr7 (B) and Tbx21 (C) loci. Enhancers showing representative patterns of activity are highlighted in gray. (D) Motif analysis was performed on the six clusters from A using the database of known TF motifs in HOMER. Each row displays the row-normalized −log P value, with red denoting high enrichment of a given motif in that cluster and blue denoting low enrichment.
Fig. 3.
Fig. 3.
E2A and TCF7 binding sites are enriched in enhancers maintained in an open state by MPECs but not SLECs. (A) MA plot showing M value (log2 read density in MPEC ÷ read density in SLEC) versus A value (0.5 × log2 read density in MPEC × read density in SLEC) of the merged set of MPEC and SLEC nonpromoter ATAC-seq peaks after normalization. The top 5,000 peaks are highlighted for MPECs (cyan) and SLECs (red). (B) The log2 ratio of normalized ATAC-seq signal is compared to the log2 ratio of RNA expression for MPECs and SLECs. Only the top 5,000 MPEC- and SLEC-specific nonpromoter ATAC-seq peaks that are associated with genes that are significantly differently expressed between MPECs and SLECs are included, with the total number in each quadrant noted in each corner. Some notable genes with higher ATAC-seq signal and RNA expression in MPECs (cyan) or SLECs (red) are highlighted, with the number of enhancers in parentheses. (C) Gene ontology analysis for the MPEC- and SLEC-specific enhancers was performed using GREAT (55) and compared to published microarray gene sets of naïve, day 8 effector, and memory P14 CD8 T cells (56). Circle size denotes significance of gene set enrichment. Color represents fold enrichment. (D) The top 10 significantly enriched de novo motifs for each subset are shown, along with their significance (−log P value), ranked from most MPEC-specific (Top) to most SLEC-specific (Bottom). On the left is the best match known motif according to HOMER. (E) The distributions of the E2A and TCF7 motifs in the top 5,000 MPEC- and SLEC-specific enhancers are shown for the regions ± 500 bp from the center of each enhancer. (F) E2A (SRR3984693) (57) and TCF7 (SRR1024054) (58) ChIP-seq enrichment was assessed at the top 5,000 MPEC- and SLEC-specific enhancers (cyan and red, respectively). (G and H) MPEC and SLEC ATAC-seq data and E2A and TCF7 ChIP-seq data are shown at the Ccr7 (G) and Tcf7 (H) loci. Highlighted in gray are enhancers with higher ATAC-seq signal in MPECs than SLECs as well as E2A and/or TCF7 peaks.
Fig. 4.
Fig. 4.
E2A regulates the accessibility of enhancers regulating memory T cell genes. (A) PCA plot comparing ATAC-seq signal in CD8 T cells transduced with empty MIG, MIG-Id2, and MIG-E47. (B) Venn diagram showing the number of enhancers with significantly different ATAC-seq signal in MIG versus MIG-E47, MIG versus MIG-Id2, and MIG-Id2 versus MIG-E47. (C) Heatmap showing hierarchical clustering of enhancers with significantly different ATAC-seq signal in the three groups. (D) Motif analysis with top three significantly enriched TF binding motifs in enhancers more open (Top) or more closed (Bottom) in E47 overexpressing cells. (E) Gene ontology analysis for cluster 1 and cluster 2 enhancers was performed using GREAT (55) and compared to published microarray gene sets of naïve, day 8 effector, day 15 effector, and memory P14 CD8 T cells (56). Circle size denotes significance of gene set enrichment. Color represents fold enrichment.
Fig. 5.
Fig. 5.
E2A activity promotes memory CD8 T cell formation. (A) Diagram showing experimental outline. (B) Representative flow cytometry plots and corresponding bar graphs showing frequencies of KLRG-1 and IL-7R expression in P14 cells transduced with MIT-E47-hER in mice that received vehicle control (empty box) or tamoxifen (Tmx) (red box) at day 9 (Top) or day 30 (Bottom) post-LCMV Armstrong infection. (C and D) Bar graphs show the mean fluorescence intensity (MFI) of CD27 and frequencies of CD62L expression in transduced P14 cells. (E and F) Bar graphs show the frequencies of IFN-γ/TNF-α double positive and IL-2-producing cells in transduced P14 cells. (GI) Bar graphs show the expression of TCF1, Eomes, and T-bet in transduced CD8 T cells at day 9 (Top) or day 30 (Bottom). Data (mean ± SD) are pooled from three independent experiments and analyzed using multiple t test (*P < 0.05; **P < 0.01; ***P < 0.001; n.s., not significant).

References

    1. Joshi N. S., et al., Inflammation directs memory precursor and short-lived effector CD8(+) T cell fates via the graded expression of T-bet transcription factor. Immunity 27, 281–295 (2007). - PMC - PubMed
    1. Kaech S. M., et al., Selective expression of the interleukin 7 receptor identifies effector CD8 T cells that give rise to long-lived memory cells. Nat. Immunol. 4, 1191–1198 (2003). - PubMed
    1. Schluns K. S., Kieper W. C., Jameson S. C., Lefrançois L., Interleukin-7 mediates the homeostasis of naïve and memory CD8 T cells in vivo. Nat. Immunol. 1, 426–432 (2000). - PubMed
    1. Huster K. M., et al., Selective expression of IL-7 receptor on memory T cells identifies early CD40L-dependent generation of distinct CD8+ memory T cell subsets. Proc. Natl. Acad. Sci. U.S.A. 101, 5610–5615 (2004). - PMC - PubMed
    1. Kaech S. M., Cui W., Transcriptional control of effector and memory CD8+ T cell differentiation. Nat. Rev. Immunol. 12, 749–761 (2012). - PMC - PubMed

Publication types

MeSH terms