. 2021 Apr 20;118(16):e2014893118.
doi: 10.1073/pnas.2014893118.

Predicting social tipping and norm change in controlled experiments

Affiliations

Predicting social tipping and norm change in controlled experiments

James Andreoni et al. Proc Natl Acad Sci U S A. .

Abstract

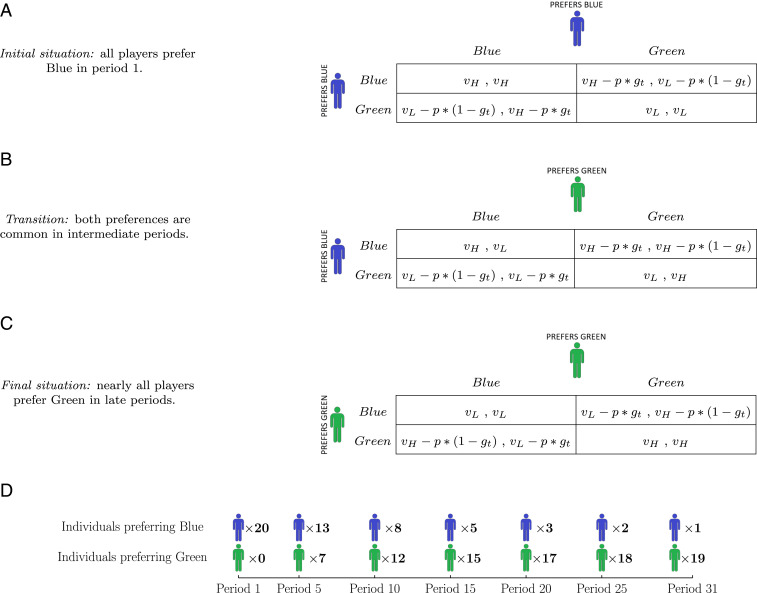
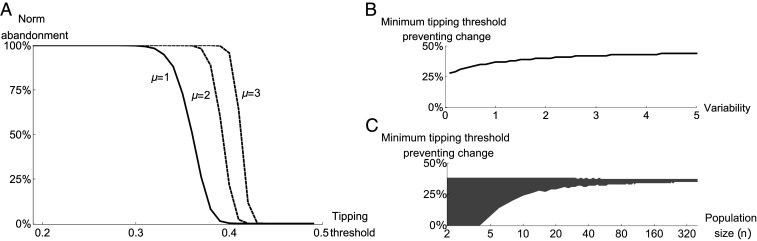
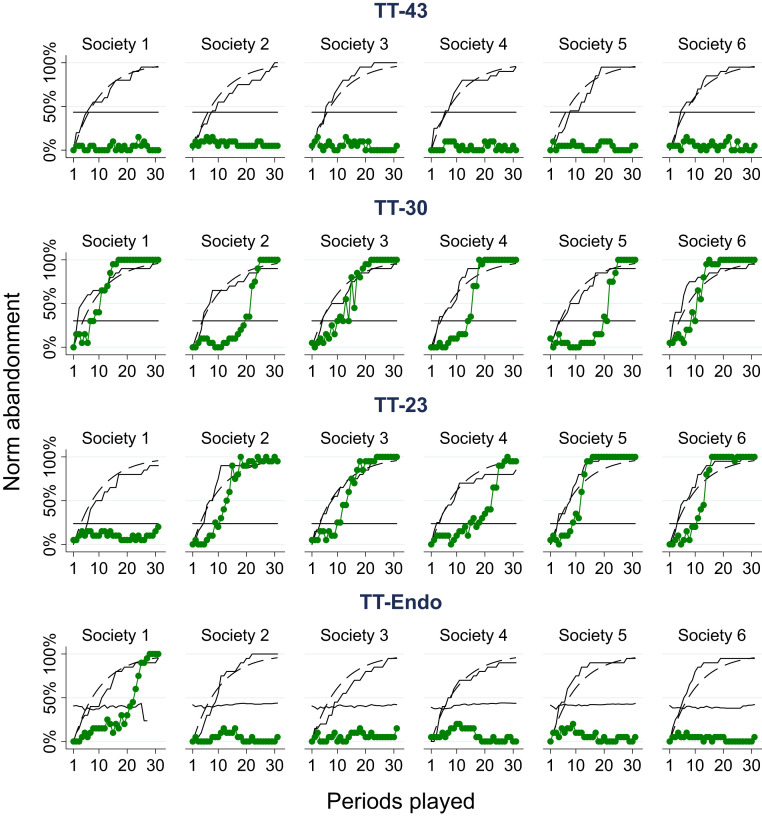
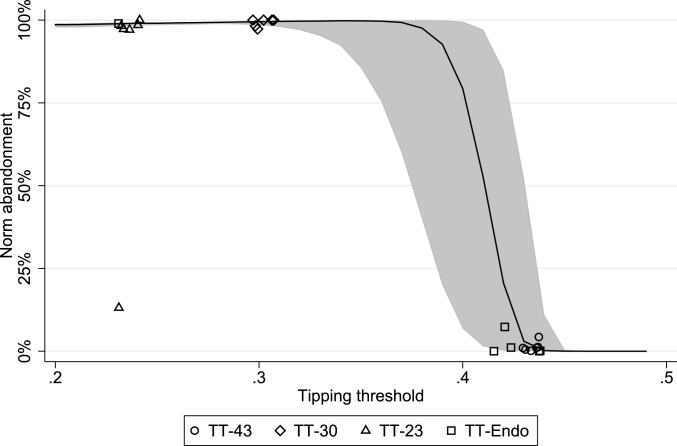
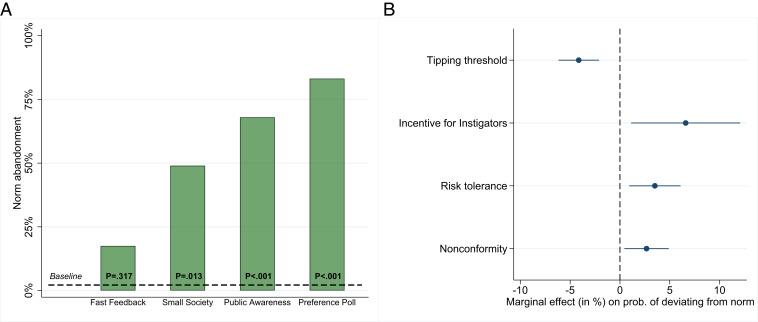
The ability to predict when societies will replace one social norm for another can have significant implications for welfare, especially when norms are detrimental. A popular theory poses that the pressure to conform to social norms creates tipping thresholds which, once passed, propel societies toward an alternative state. Predicting when societies will reach a tipping threshold, however, has been a major challenge because of the lack of experimental data for evaluating competing models. We present evidence from a large-scale laboratory experiment designed to test the theoretical predictions of a threshold model for social tipping and norm change. In our setting, societal preferences change gradually, forcing individuals to weigh the benefit from deviating from the norm against the cost from not conforming to the behavior of others. We show that the model correctly predicts in 96% of instances when a society will succeed or fail to abandon a detrimental norm. Strikingly, we observe widespread persistence of detrimental norms even when individuals determine the cost for nonconformity themselves as they set the latter too high. Interventions that facilitate a common understanding of the benefits from change help most societies abandon detrimental norms. We also show that instigators of change tend to be more risk tolerant and to dislike conformity more. Our findings demonstrate the value of threshold models for understanding social tipping in a broad range of social settings and for designing policies to promote welfare.

Keywords: conformity trap; laboratory experiment; social norms; threshold models; tipping points.


Conflict of interest statement

The authors declare no competing interest.

Figures

Fig. 1.
Fig. 1.
Social tipping game. Individuals are divided into experimental societies of 20 individuals in all but one condition. In each of the 31 periods, individuals are randomly matched into pairs with another society member and must choose between action Blue and Green, simultaneously and without communication. If they choose their (induced) preferred color, they earn a high reward, vH; otherwise, they earn a low reward, vL. Individuals in a pair have an incentive to coordinate on a color. Specifically, there is cost for miscoordinating, which is given by a penalty parameter, p, multiplied by the proportion of individuals in the society choosing the other color, where gt denotes the proportion of people choosing Green in period t. Induced preferences over Blue and Green change over time at a commonly known rate: An individual who still prefers Blue has a 10% probability of switching to preferring Green in each period. The changing preferences create three possible situations that are captured in AC. (A) In period 1, it is common knowledge that everyone prefers Blue. (B) After the first period, there is a probability that players with conflicting preferences are paired together. (C) By the end of the experiment, virtually all individuals prefer Green over Blue. (D) This panel illustrates the process of changing preferences by presenting the number of individuals expected to prefer Blue/Green in selected periods.
Fig. 2.
Fig. 2.
Theoretically predicted norm abandonment. (A) Probability of norm abandonment depending on the tipping threshold. The predictions are given for μ=1 (solid line), μ=2, and μ=3 (dashed lines), assuming σ=1. For all cases, successful change is predicted for tipping thresholds below 35%. An μ=1 seems plausible, as it implies that the average individual anticipates the existence of a tipping threshold and believes a deviation by him/her will bring society one step closer to it. Specifically, if γi=1, then in addition to the myopic payoff, π(Green), individual i associates an additional gain of v=vHvL for choosing Green, as i believes that society-wide coordination on the high benefit will occur one period earlier. Higher values of μ occur if the average individual has a personal preference for change or expects a deviation will accelerate change by more than one time period. (B) Robustness of predictions to different variability in γi (measured by σ) given μ=1. The minimum tipping threshold preventing change corresponds to the tipping threshold above which change is unlikely (below 50%). It lies between 30 and 40%, though the increasing trend shows that change is more likely in more heterogeneous societies. (C) Stability of predictions for different population sizes (n), holding constant μ=σ=1 (i.e., abstracting from the possibility that n could affect the distribution of γi). Shaded area shows the 99% CI based on 1,000 trials for each population size. The variability in the probability of change in different societies due to the stochastic nature of the model (i.e., different realized induced preferences and distributions of γi) is small when n>10.
Fig. 3.
Fig. 3.
Time series of norm abandonment for different tipping thresholds. Norm abandonment is shown as the line with circled markers. The tipping threshold is given by the horizontal line. The dashed concave line indicates the theoretically expected fraction of subjects preferring to abandon the norm; the solid increasing line is the corresponding realized fraction. Conditions TT-30 and TT-23 allow for fast and efficient change relative to TT-43 (P = 0.001 and P = 0.008, one-sided Fisher exact test). Condition TT-Endo leads to an average tipping threshold of 40% and allows for change in only one out of six experimental societies (P = 0.500, one-sided Fisher exact test).
Fig. 4.
Fig. 4.
Norm abandonment as a function of the tipping threshold. The tipping threshold is a critical determinant of the likelihood to observe change. Each marker represents the percentage of subjects in the last five periods that abandoned Blue in a given experimental society. Also shown is the theoretically predicted frequency of norm abandonment (solid line) and 99% CI (shaded area) from 10,000 simulated trials per tipping threshold based on the estimated parameters μ = 1.73 and σ=1.91 (Probit model with society random effects), see SI Appendix, section 3. The theoretical predictions correctly anticipate norm persistence or norm abandonment in 23 of the 24 societies (i.e., in 96% of instances). The model provides a similarly good fit when using a subset of the conditions to estimate μ and σ and use them to perform out-of-sample predictions (SI Appendix, Fig. S5).
Fig. 5.
Fig. 5.
Expectations and the willingness to instigate change. (A) Bars show the probability of norm abandonment in the last five periods in the conditions aimed to induce change via expectations. P values are from linear panel regressions with society-clustered SEs, in which the comparison is with TT-43 (i.e., TT-43 is the baseline for this comparison). In all these conditions, the tipping threshold is identical to TT-43 (43%), showing that expectations are a crucial determinant of change. (B) The average marginal effects in percentage points and 99% CIs on the probability of deviating from the norm when the tipping threshold has not been reached (random effects Probit model with society-clustered SEs) are shown. Only individuals who have already experienced a preference switch are included, as individuals who prefer the status quo rarely attempt to instigate change (SI Appendix, Fig. S8). The higher the tipping threshold the less likely individuals are to deviate from the norm. Instigators of change tend to be more risk tolerant and more nonconformist.
Fig. 6.
Fig. 6.
Empirical validity of the key behavioral assumption of threshold models. (A) When an individual chooses Green for the first time, it reveals a switching threshold that is at most equal to the proportion of others who chose Green in the last observable period and at least equal to the highest proportion of others choosing Green in any prior period. A choice in any period is classified as inconsistent with a unique individual switching threshold if an individual 1) chooses Blue even though the last observed proportion of others choosing Green was greater than the upper bound of the revealed switching threshold or 2) chooses Green even though this proportion was smaller than the lower bound of the revealed switching threshold. Data only include cases in which societies eventually abandoned the Blue norm, as otherwise the switching threshold of most individuals is not observed. We find that the threshold model accurately characterizes the behavior of most individuals. (B) Choices that are inconsistent with the existence of a unique individual switching threshold are most common during the transition from Blue to Green, which typically gained momentum around period 10 (Fig. 3 and SI Appendix, Fig. S6).

Similar articles

Cited by

References

    1. Bicchieri C., The Grammar of Society: The Nature and Dynamics of Social Norms (Cambridge University Press, 2006).
    1. Fehr E., Fischbacher U., Social norms and human cooperation. Trends Cogn. Sci. 8, 185–190 (2004). - PubMed
    1. Young H. P., The evolution of social norms. Annu. Rev. Econ. 7, 359–387 (2015).
    1. Fehr E., Schurtenberger I., Normative foundations of human cooperation. Nat. Hum. Behav. 2, 458–468 (2018). - PubMed
    1. Bertrand M., Kamenica E., Pan J., Gender identity and relative income within households. Q. J. Econ. 130, 571–614 (2015).

Publication types

LinkOut - more resources