Randomized Controlled Trial
. 2021 Apr 16;6(1):145.
doi: 10.1038/s41392-021-00541-3.

Clinical effect and antiviral mechanism of T-705 in treating severe fever with thrombocytopenia syndrome

Affiliations
Randomized Controlled Trial

Clinical effect and antiviral mechanism of T-705 in treating severe fever with thrombocytopenia syndrome

Hao Li et al. Signal Transduct Target Ther. .

Abstract

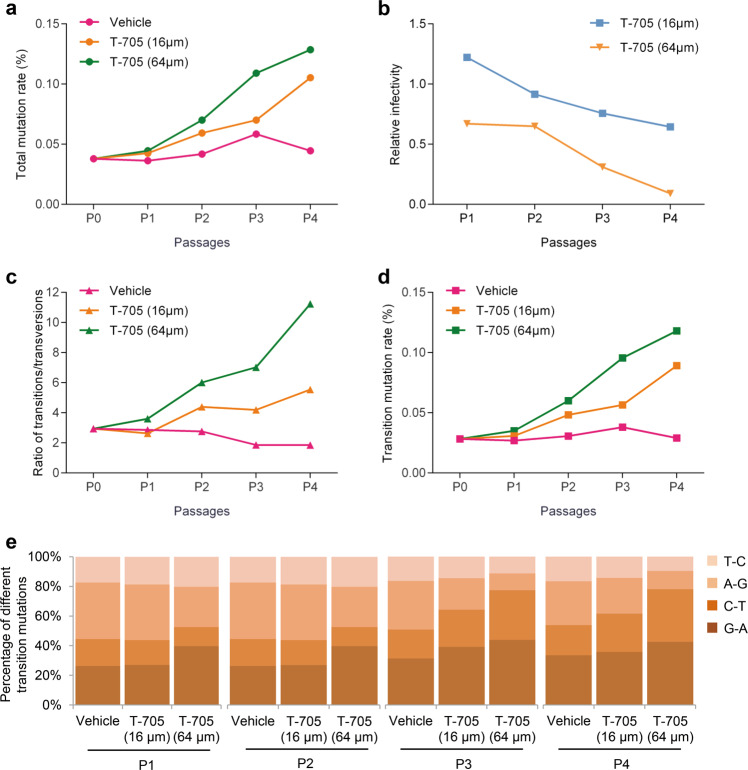
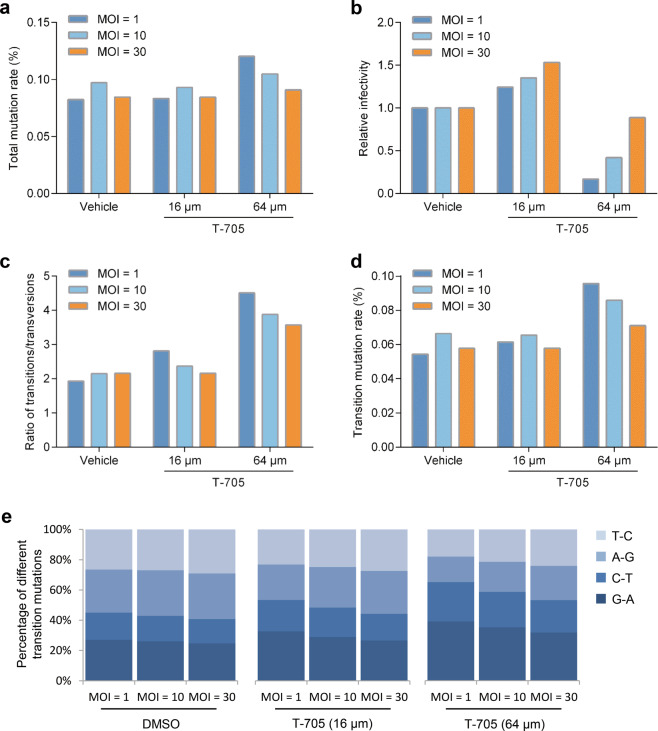
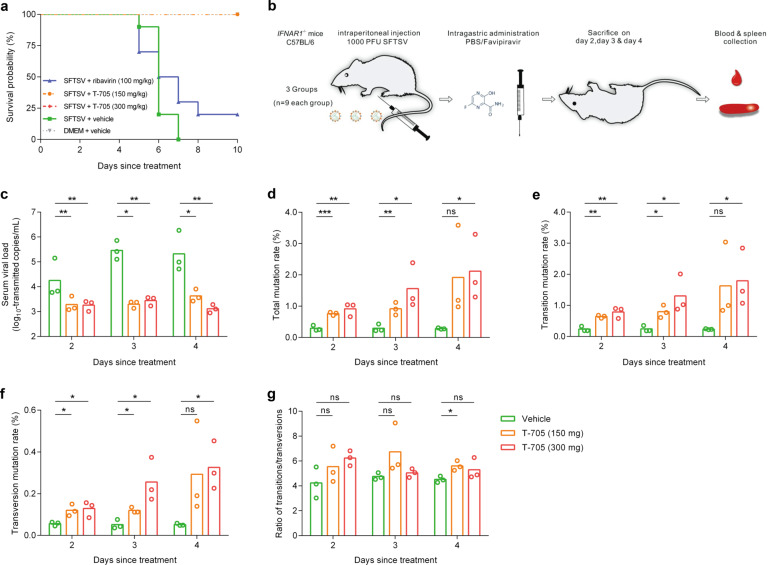
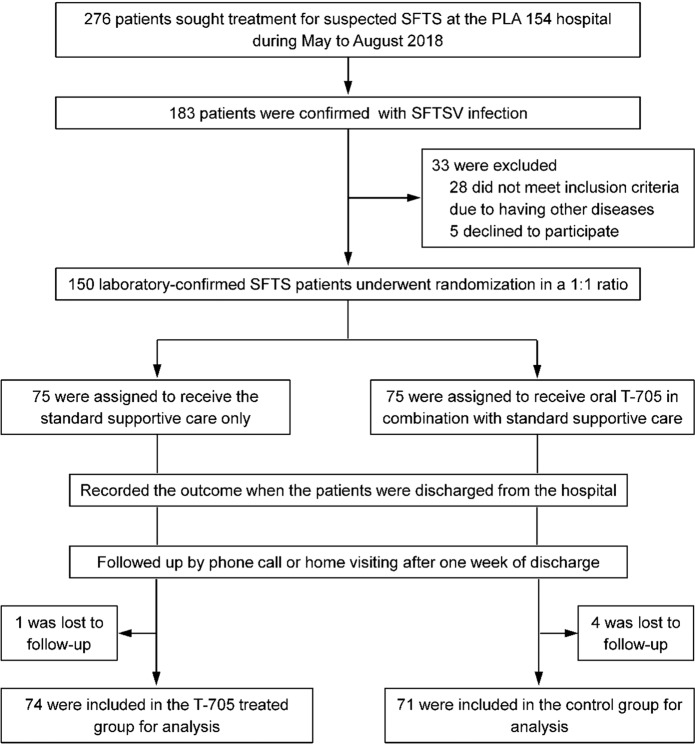
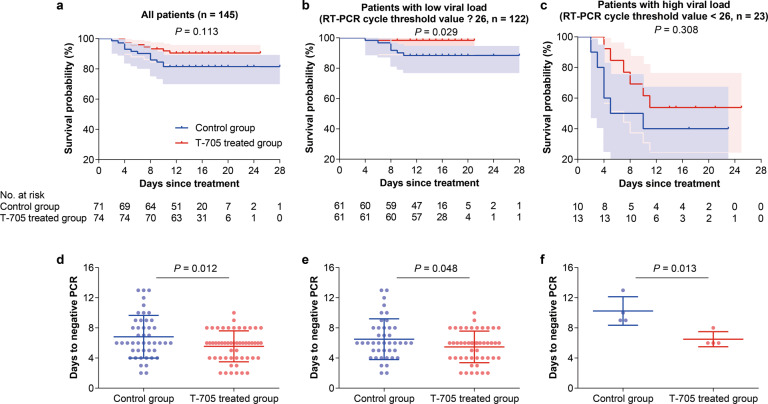
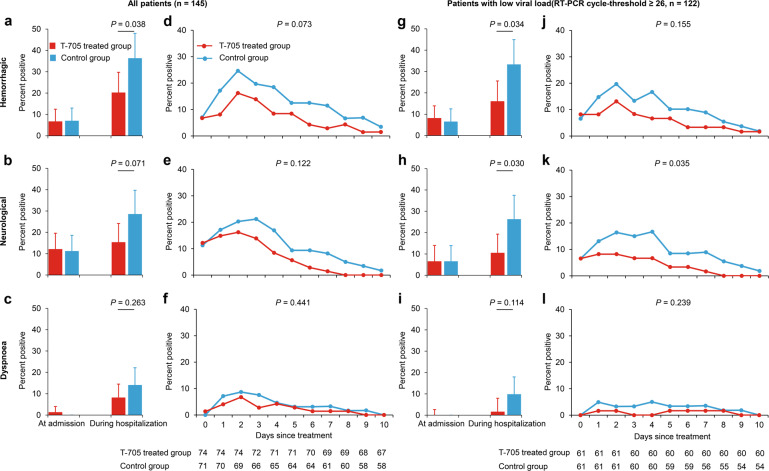
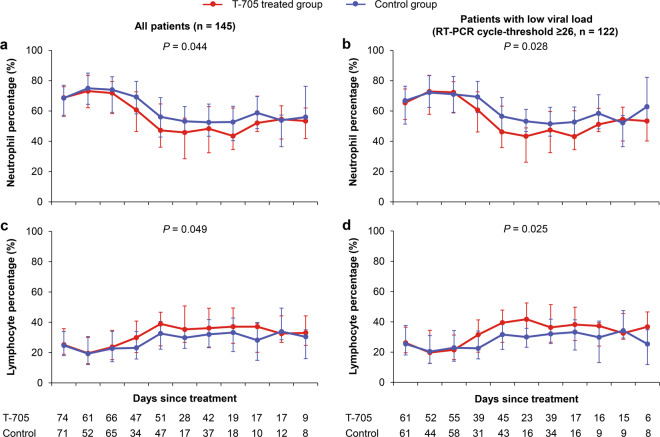
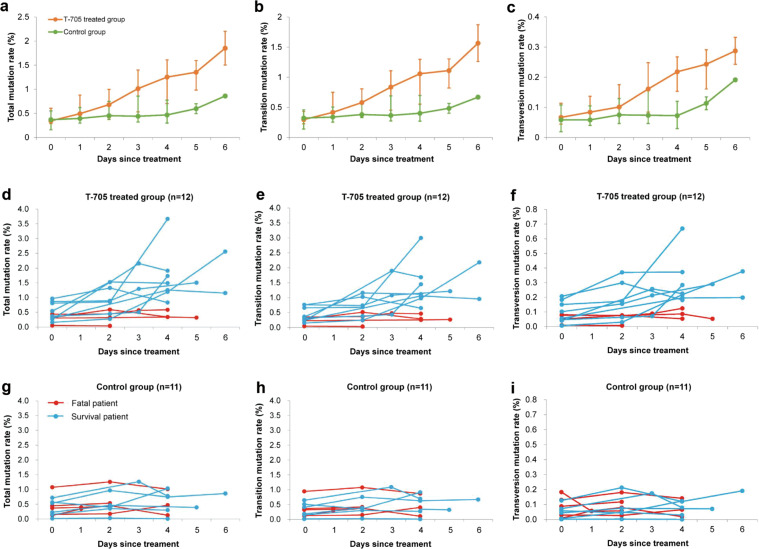
Severe fever with thrombocytopenia syndrome (SFTS) virus (SFTSV) is an emerging tick-borne virus with high fatality and an expanding endemic. Currently, effective anti-SFTSV intervention remains unavailable. Favipiravir (T-705) was recently reported to show in vitro and in animal model antiviral efficacy against SFTSV. Here, we conducted a single-blind, randomized controlled trial to assess the efficacy and safety of T-705 in treating SFTS (Chinese Clinical Trial Registry website, number ChiCTR1900023350). From May to August 2018, laboratory-confirmed SFTS patients were recruited from a designated hospital and randomly assigned to receive oral T-705 in combination with supportive care or supportive care only. Fatal outcome occurred in 9.5% (7/74) of T-705 treated patients and 18.3% (13/71) of controls (odds ratio, 0.466, 95% CI, 0.174-1.247). Cox regression showed a significant reduction in case fatality rate (CFR) with an adjusted hazard ratio of 0.366 (95% CI, 0.142-0.944). Among the low-viral load subgroup (RT-PCR cycle threshold ≥26), T-705 treatment significantly reduced CFR from 11.5 to 1.6% (P = 0.029), while no between-arm difference was observed in the high-viral load subgroup (RT-PCR cycle threshold <26). The T-705-treated group showed shorter viral clearance, lower incidence of hemorrhagic signs, and faster recovery of laboratory abnormities compared with the controls. The in vitro and animal experiments demonstrated that the antiviral efficacies of T-705 were proportionally induced by SFTSV mutation rates, particularly from two transition mutation types. The mutation analyses on T-705-treated serum samples disclosed a partially consistent mutagenesis pattern as those of the in vitro or animal experiments in reducing the SFTSV viral loads, further supporting the anti-SFTSV effect of T-705, especially for the low-viral loads.


Conflict of interest statement

The authors declare no competing interests.

Figures

Fig. 1
Fig. 1
Infectivity and mutation analysis of SFTSV in four passages of cell culture supernatant from cells treated with different concentrations of T-705. SFTSV strain HNXY2017-66 was serial passaged in T-705 or vehicle-treated Vero cells for four passages (P1–P4). The cell culture supernatant was collected for the NGS and mutation analysis of the SFTSV genome. Total mutation rates (a), ratios of transitions/transversions (c), transition mutation rates (d), and percentages of different transition mutations (e) were calculated. Viral titer and viral genome copy number in the supernatant were also measured, and relative viral infectivity (viral titer/viral genome copy number) is shown (b)
Fig. 2
Fig. 2
Infectivity and mutation analysis of SFTSV in cell culture supernatant from cells infected with different MOIs of SFTSV. Vero cells were infected with SFTSV strain HNXY2017-66 at MOIs of 1, 10, and 30, and treated with vehicle or different concentrations of T-705. At 24 h post infection, the cell culture supernatant was collected. SFTSV genome in the supernatant was extracted and subjected to NGS analysis. Total mutation rates (a), ratios of transitions/transversions (c), transition mutation rates (d), and percentages of different transition mutations (e) were calculated. Viral titer and viral genome copy number in the supernatant were also measured, and relative viral infectivity (Viral titer/viral genome copy number) is shown (b)
Fig. 3
Fig. 3
The NGS and mutation analysis of SFTSV genome in serum samples collected from IFNAR−/− C57BL/6 mouse treated with or without T-705. a Kaplan–Meier curves for the T-705 treatment effect on the probability of survival in IFNAR/ C57BL/6 mouse. IFNAR/− C57BL mice were divided into five groups: SFTSV + vehicle group (five female and five male mice), SFTSV + T-705 group I (300 mg/kg/d, five female and five male mice), SFTSV + T-705 group II (150 mg/kg/d, five female and five male mice), SFTSV + ribavirin (100 mg/kg/d, five female and five male mice), and DMEM + T-705 group (300 mg/kg/d, three female and three male mice). b Flowchart of next-generation sequencing (NGS) of SFTSV genome in spleen and serum samples collected from IFNAR/ C57BL/6 mouse. Three IFNAR−/− C57BL/6 mice from each group were sacrificed on days 2, 3, and 4 post infection, respectively. Serum and spleen samples were collected, and RNA was extracted for NGS analysis. Copy number of SFTSV genome in serum (c), the total mutation rates (d), transition mutation rates (e), transversion mutation rates (f), and ratios of transitions/transversions (g) were also calculated
Fig. 4
Fig. 4
Enrollment, randomization, and follow-up of the study patients. We screened 276 SFTS suspected patients and identified 183 with laboratory-confirmed SFTSV infection. Thirty-three patients were excluded, and 150 were enrolled and randomly assigned to two groups (75 patients in each group). Five patients were lost to follow-up, and eventually 145 were included for analysis
Fig. 5
Fig. 5
Effect of T-705 treatment on survival time and viral clearance. ac Kaplan-Meier curves for T-705 treatment effect on the probability of survival. Kaplan–Meier survival curves with 95% confidence bands are shown by treatment arm for all 145 patients (a), for 122 patients (b) with low-baseline viral loads (RT-PCR cycle-threshold value ≥26), and for 23 patients (c) with high-baseline viral loads (RT-PCR cycle-threshold value <26). df The days to viral clearance of SFTSV RNA. The mean (standard deviation) days to viral clearance are shown for all patients (d), for patients (e) with low-baseline viral loads, and for patients (f) with high-baseline viral loads
Fig. 6
Fig. 6
The percentage of patients presenting severe complications. ac, gi The incidences of severe complications at admission and during hospitalization. The percentages of patients presenting hemorrhagic signs (a, g), neurological symptoms (b, h), and dyspnea (c, i) are shown at each time point by treatment arm for all patients (n = 145) and for patients with low-baseline viral loads (RT-PCR cycle-threshold value ≥26, n = 122). The bars indicate the 95% confidence intervals (only the upper half is shown). df, jl The daily percentage of severe complications in the patients. The mean percentages of neurological symptoms, hemorrhagic signs, and dyspnea are shown over time for all the patients (df) and the patients (jl) with low-baseline viral loads (RT-PCR cycle-threshold value ≥26). The numbers of patients who contributed to the at-risk population at each time point are shown under the x axis. The difference of these severe complications was analyzed over time (the curves) by using the generalized estimating equation model
Fig. 7
Fig. 7
The kinetics of key laboratory parameters in the patients. The median (quartile range) values of neutrophil percentage and lymphocyte percentage are shown over time for all the patients (n = 145, a and c), and the patients (n = 122, b and d) with low-baseline viral loads (RT-PCR cycle-threshold value ≥26). The numbers of patients who contributed to the at-risk population at each time point are shown under the x axis. The difference of these severe complications was analyzed over time (the curves) by using the generalized estimating equation model
Fig. 8
Fig. 8
The kinetics of the viral mutation in SFTS patients. A total of 40 samples were obtained from 12 patients receiving T-705 treatment (4 fatal and 8 survival) and 34 samples were obtained from 11 controls (5 fatal and 6 survival). The mean total mutation rates, transition mutation rates, and transversion rates, and ratio of transitions/transversions are shown over time for the two groups (a, b, c). The daily value of total mutation rate, transition mutation rate, and transversion rate was shown over time for each patient in the T-705 treated group (d, e, f) and the control group (g, h, i)

References

    1. Yu XJ, et al. Fever with thrombocytopenia associated with a novel bunyavirus in China. The. N. Engl. J. Med. 2011;364:1523–1532. doi: 10.1056/NEJMoa1010095. - DOI - PMC - PubMed
    1. Kim KH, et al. Severe fever with thrombocytopenia syndrome, South Korea, 2012. Emerg. Infect. Dis. 2013;19:1892–1894. doi: 10.3201/eid1911.130792. - DOI - PMC - PubMed
    1. Takahashi T, et al. The first identification and retrospective study of severe fever with thrombocytopenia syndrome in Japan. J. Infect. Dis. 2014;209:816–827. doi: 10.1093/infdis/jit603. - DOI - PMC - PubMed
    1. Li H, et al. Epidemiological and clinical features of laboratory-diagnosed severe fever with thrombocytopenia syndrome in China, 2011-17: a prospective observational study. Lancet Infect. Dis. 2018;18:1127–1137. doi: 10.1016/S1473-3099(18)30293-7. - DOI - PubMed
    1. Tran XC, et al. Endemic severe fever with thrombocytopenia syndrome, Vietnam. Emerg. Infect. Dis. 2019;25:1029–1031. doi: 10.3201/eid2505.181463. - DOI - PMC - PubMed

Publication types