. 2021 Apr 15;12(1):2277.
doi: 10.1038/s41467-021-22266-1.

Single cell regulatory landscape of the mouse kidney highlights cellular differentiation programs and disease targets

Affiliations

Single cell regulatory landscape of the mouse kidney highlights cellular differentiation programs and disease targets

Zhen Miao et al. Nat Commun. .

Abstract

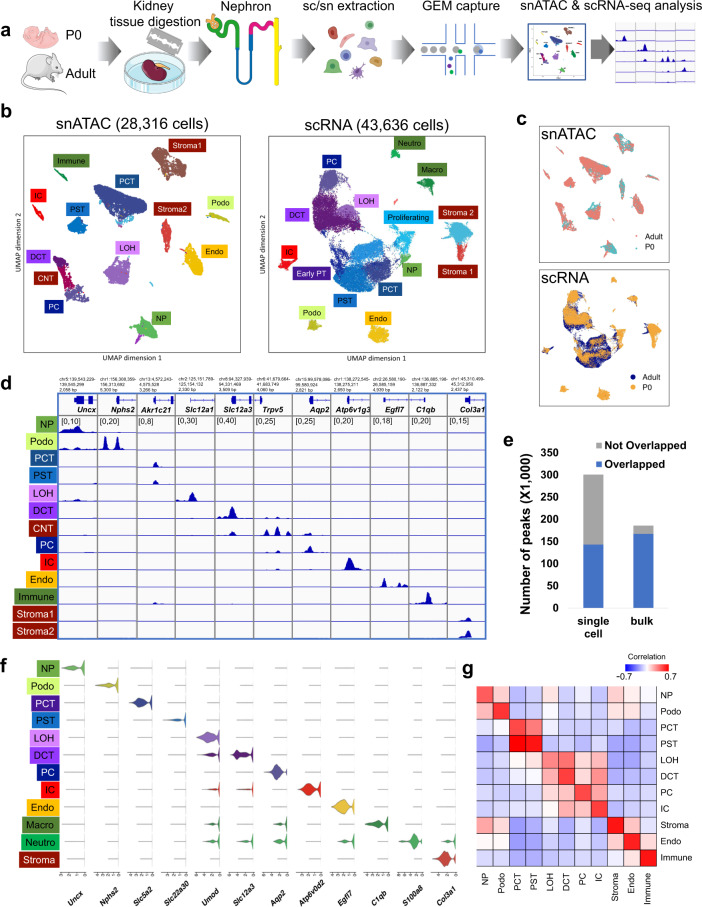
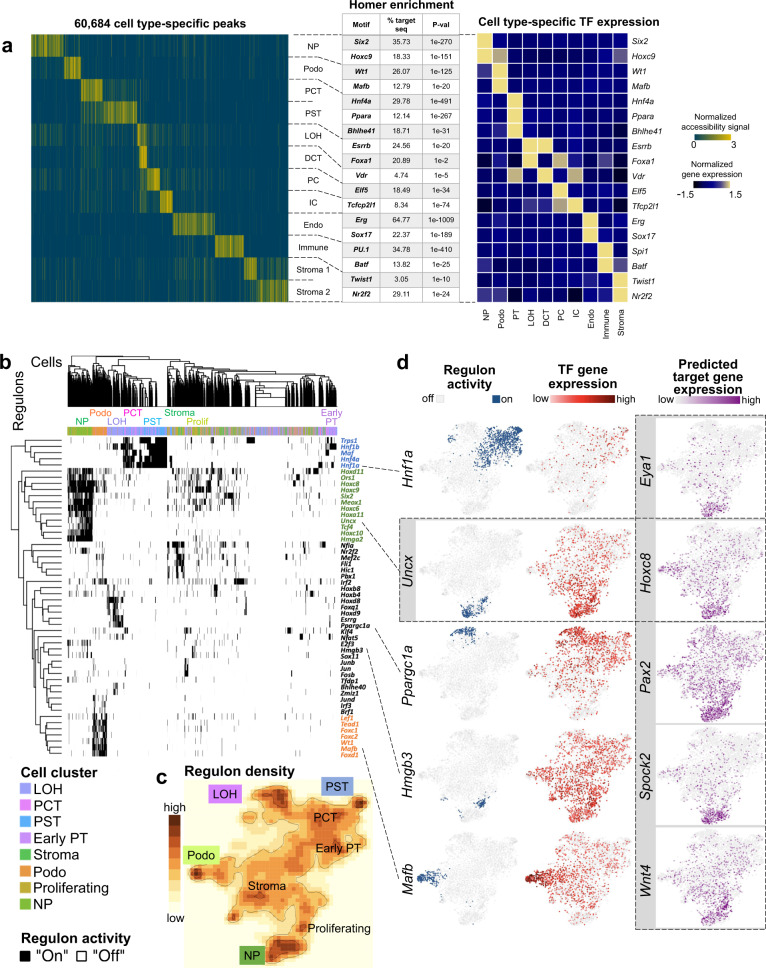
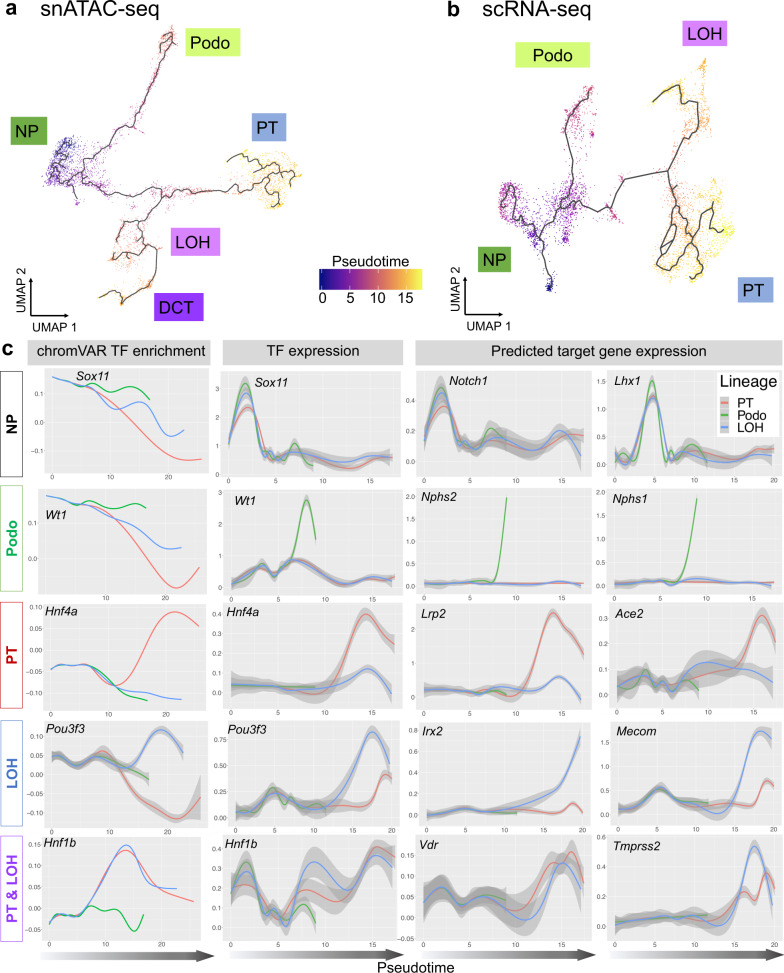
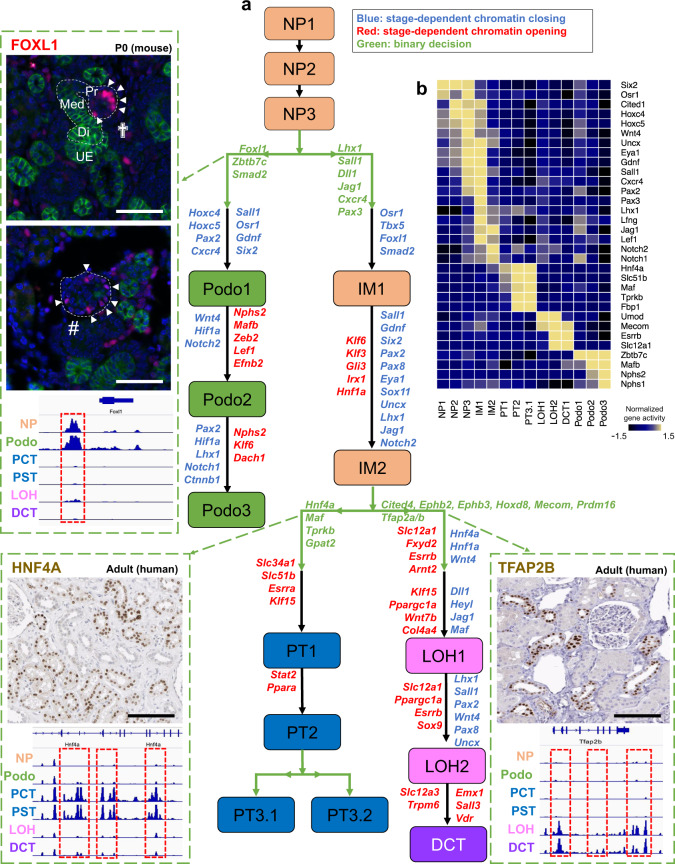
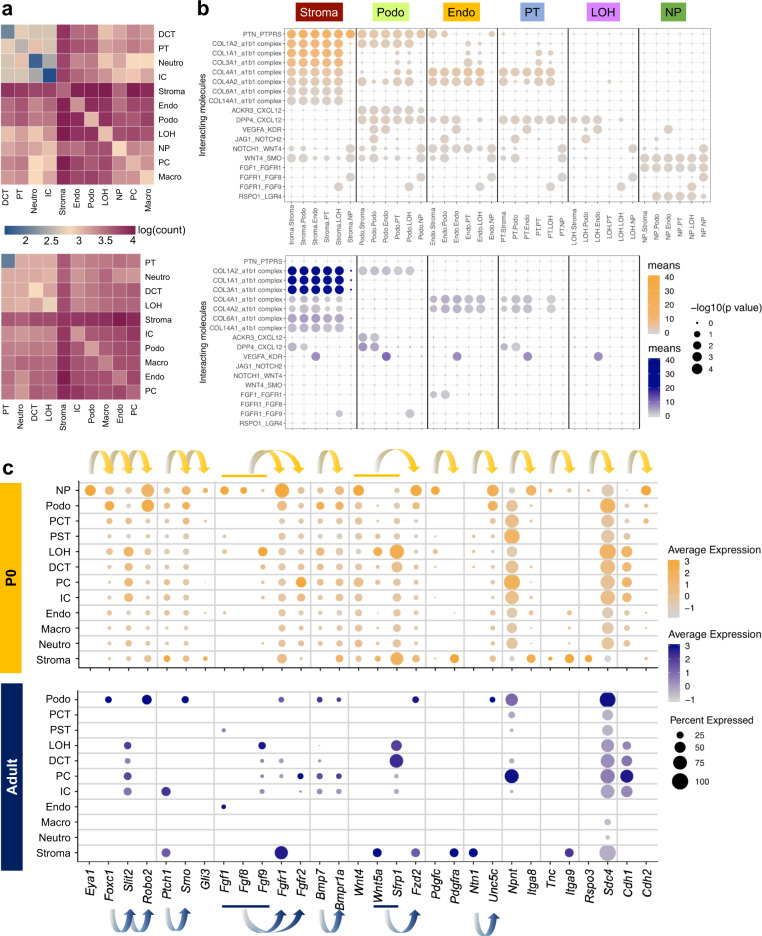
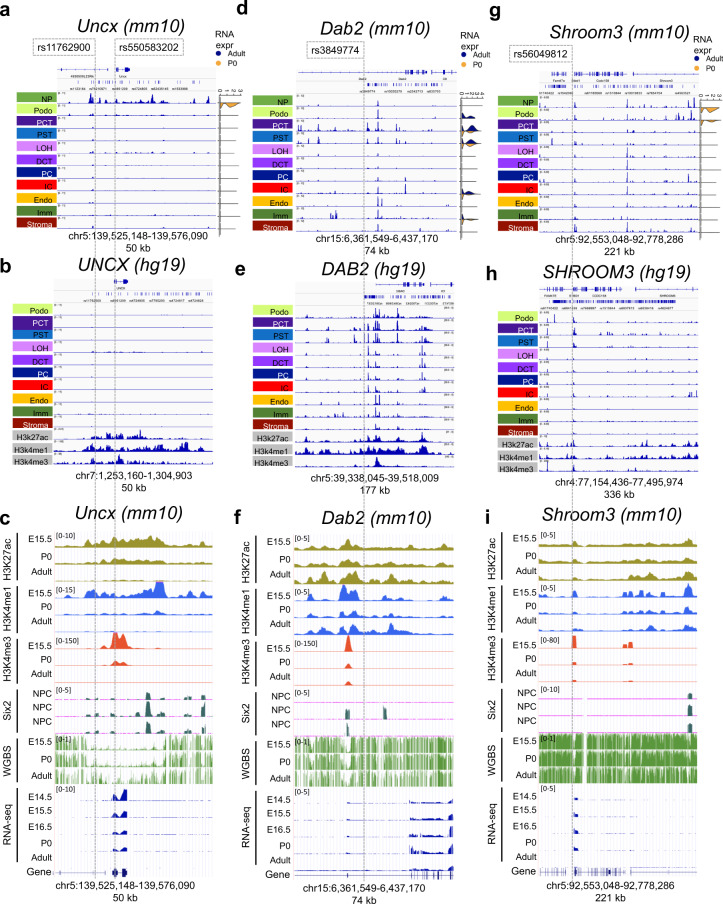
Determining the epigenetic program that generates unique cell types in the kidney is critical for understanding cell-type heterogeneity during tissue homeostasis and injury response. Here, we profile open chromatin and gene expression in developing and adult mouse kidneys at single cell resolution. We show critical reliance of gene expression on distal regulatory elements (enhancers). We reveal key cell type-specific transcription factors and major gene-regulatory circuits for kidney cells. Dynamic chromatin and expression changes during nephron progenitor differentiation demonstrates that podocyte commitment occurs early and is associated with sustained Foxl1 expression. Renal tubule cells follow a more complex differentiation, where Hfn4a is associated with proximal and Tfap2b with distal fate. Mapping single nucleotide variants associated with human kidney disease implicates critical cell types, developmental stages, genes, and regulatory mechanisms. The single cell multi-omics atlas reveals key chromatin remodeling events and gene expression dynamics associated with kidney development.


Conflict of interest statement

The authors declare no competing interests.

Figures

Fig. 1
Fig. 1. snATAC-seq and scRNA-seq identified major cell types in developing and adult mouse kidney.
a Schematics of the study design. Kidneys from P0 and adult mice were processed for snATAC-seq and scRNA-seq followed by data processing and analysis including cell type identification and peak calling; artwork own production and from https://smart.servier.com, license https://creativecommons.org/licenses/by-sa/3.0/). b UMAP embeddings of snATAC-seq data and scRNA-seq data. Using marker genes, cells were annotated into nephron progenitors (NP), collecting duct intercalated cells (IC), collecting duct principal cells (PC), proximal convoluted and straight tubule (PCT and PST), loop of Henle (LOH), distal convoluted tubules (DCT), stromal cells (Stroma), podocytes (Podo), endothelial cells (Endo), and immune cells (Immune). In scRNA-seq data, the same cell types were identified, with an additional proliferative population and immune cells were clustered into neutrophils and macrophages. c UMAP embeddings of snATAC-seq and scRNA-seq data colored by P0 and adult batches. d Genome browser view of read density in each snATAC-seq cluster at cell type marker gene transcription start sites. Additional marker gene examples are shown in Supplementary Fig. 3a. e Comparison of peaks identified from snATAC-seq data and bulk ATAC-seq data. Peaks that are identified in both datasets are colored blue, and peaks that are dataset-specific are gray. f Violin plots showing cell type-specific gene expression in scRNA-seq data. g Heatmap showing Pearson’s correlation coefficients between snATAC-seq gene activity scores and gene expression values in P0 data. Each row represents a cell type in scRNA-seq data and each column represents a cell type in snATAC-seq data. The correlation of the adult dataset is shown in Supplementary Fig. 3b.
Fig. 2
Fig. 2. Cell type-specific gene regulatory landscape of the mouse kidney.
a Left panel: Heatmap showing all cell type-specific differentially accessible peaks (DAPs) (yellow: open chromatin, blue: closed chromatin) (peak loci are provided in Supplementary Data 5). Middle panel: Examples of cell type-specific motif enrichment analysis using Homer (full results are shown in Supplementary Data 6). Right panel: TF expression z-score heatmap that corresponds to the motif enrichment in each cell type. b Heatmap of cell type-specific regulons, as inferred by SCENIC algorithm. Regulon activity was binarized to “on” (black) or “off” (white). c tSNE representation of regulon density as a surrogate for stability of regulon states, as inferred by SCENIC algorithm. d tSNE depiction of regulon activity (“on-blue”, “off-gray”) and TF gene expression (red scale) of exemplary regulons for proximal tubule (Hnf1a), nephron progenitors (Uncx), loop of Henle (Ppargc1a), proliferating cells (Hmgb3), and podocytes (Mafb). Examples of target gene expression of the Uncx regulon (Eye1, Hoxc8, Pax2, Spock2, and Wnt4) are shown in purple scale. Expression of target genes of Hnf1a, Six2, Ppargc1a, Hmgb3, and Mafb is shown in Supplementary Fig. 15a.
Fig. 3
Fig. 3. The cellular trajectory of nephron progenitor differentiation.
a UMAP representation of snATAC-seq nephron progenitor differentiation trajectory towards podocytes, proximal tubule, loop of Henle and distal convoluted tubule, respectively, as inferred by Cicero. Cells are colored by pseudotime. b UMAP representation of scRNA-seq nephron progenitor differentiation trajectory towards podocytes, proximal tubule and loop of Henle, respectively, as inferred by Monocle3. Cells are colored by pseudotime. c Pseudotime-dependent chromatin accessibility and gene expression changes along the proximal tubule (red), podocyte (green), and loop of Henle (blue) cell lineages. The first column shows the dynamics of chromVAR TF enrichment score, the second column shows the dynamics of TF gene expression values and the third and fourth column represent the dynamics of SCENIC-reported target gene expression values of corresponding TFs, respectively. Error bars denote 95% confidence intervals of local polynomial regression fitting. Additional examples are given in Supplementary Fig. 18b.
Fig. 4
Fig. 4. Chromatin dynamics of nephron progenitor differentiation.
a Di-graph representing cell type and lineage divergence, as derived from Cicero trajectory inference. Nephron progenitors (NP), podocytes (Podo), intermediate stage (IM), proximal tubule (PT), loop of Henle (LOH), and distal convoluted tubule (DCT) are connected with their developmental precursor stages and represented by ascending numbering. Arrows represent cell differentiation along respective trajectories. Genes listed next to the trajectories were derived from analyzing gene enrichment of differentially assessible peaks (DAPs) between two stages. Genes colored red were derived from the opening DAPs between two stages, genes colored blue were derived from the closing DAPs between two stages, and genes colored green were derived from opening DAPs between two branches. Three important genes, Foxl1, Hnf4a, and Tfap2b are shown along with their cell type-specific accessibility peaks and immunostaining results. Peaks that were open during the development of specific cell types are shown in red boxes. Immunofluorescence staining of P0 mouse kidney shows FOXL1 in red in the proximal part (Pr) of late S-shaped bodies (cross) and in podocytes within primitive glomeruli (#); green staining denotes E-Cadherin, blue DAPI; Med, medial part of S-shaped body; Di, distal part of S-shaped body; UE, ureteric epithelium; images are representative of three independent experiments, scale bars = 25 µm. HNF4A and TFAP2B in human adult kidney samples (images CAB019417 and HPA034683, respectively, taken from the Human Protein Atlas version 19.3, http://www.proteinatlas.org, https://creativecommons.org/licenses/by-sa/3.0/) are visualized by immunohistochemistry in brown, scale bar = 25 µm. In addition, gene expression changes along the three trajectories of genes that were identified by GREAT analysis to be nearby chromatin closing and opening events demonstrated to be consistent to chromatin information, examples are visualized in the top right subpanel. b Heatmap showing normalized gene activity scores of lineage marker genes in the 15 developmental stages.
Fig. 5
Fig. 5. Cell–cell communication analysis in the developing and adult mice highlighted the critical role of stroma in driving cell differentiation.
a Heatmaps showing the number of cell-cell interactions in the scRNA-seq dataset of P0 (top) and adult (bottom) kidneys, as inferred by CellPhoneDB. Dark blue and dark red colors denote low and high numbers of cell–cell interactions, respectively. b CellPhoneDB-derived measures of cell–cell interaction scores and p values. Each row shows a ligand-receptor pair, and each column shows the two interacting cell types, which is binned by cell type. Columns are sub-ordered by first interacting cell type into stroma, podocytes, endothelial cells, proximal tubule, loop of Henle, and nephron progenitors. Color scale denotes the mean values for all the interacting partners, where mean value refers to the total mean of the individual partner average expression values in the interacting cell type pairs. Orange scale denotes P0, blue scale denotes adult. Dot size denotes corresponding p values of the (one-sided) permutation test with 1000 permutations. c Dot plots of RNA expression of important cell–cell communication candidates within the Gdnf-Ret, Sonic hedgehog, Fgf, Bmp, Wnt, and other pathways in both P0 (top) and adult (bottom) kidney. Dot size denotes percentage of cells expressing the marker. Color scale represents average gene expression values, orange denotes P0, blue denotes adult. Arrows indicate ligand–receptor pairs.
Fig. 6
Fig. 6. Single cell level chromatin accessibility highlighted human kidney GWAS target genes and cell types.
a, d, g Genome browser view of Shroom3, Dab2, and Uncx loci; from top to bottom: mouse orthologue of eGFR GWAS significant SNPs (after lift-over) mouse kidney single nuclei chromatin accessibility for nephron progenitors (NP), podocytes (Podo), proximal convoluted and straight tubules (PCT and PST), loop of Henle (LOH), distal convoluted tubule (DCT), collecting duct intercalated cells (IC), collecting duct principal cell types (PC), endothelial cells (Endo), immune cells (Immune) and stromal cells (Stroma). Data range in all tracks is set to the same scale. Examples of cell type-specific accessible chromatin overlapped with significant SNPs are highlighted with dashed lines. Right subpanel shows violin plots of cell type-specific gene expression in P0 (orange) and adult (blue) kidneys in the scRNA-seq dataset. b, e, h Corresponding genome browser views in adult human (hg19) kidney snATAC-seq data; from top to bottom: eGFR GWAS significant SNPs, adult human kidney single nuclei chromatin accessible landscape, whole kidney H3K27ac, H3K4me1, and H3K4me3 ChIP-seq tracks. The genomic location in human was matched to the mouse orthologue. Note that for DAB2 (f), the image was mirrored to facilitate comparison along genomic read direction. Alternative genome browser views at more zoomed-in locations are available in Supplementary Fig. 23. c, f, i Whole mouse kidney epigenomics tracks from E14.5, E15.5, E16.5, P0, and adult mice. From top to bottom: H3K27ac, H3K4me1, H3K4me3, and Six2 ChIP-seq; whole genome bisulfate sequencing (WGBS); and bulk RNA-seq. The bottom Refseq visualization corresponds to the Refseq track at the top in a, d, g, respectively. Six2 binding signal in nephron progenitor cells.

References

    1. Reidy K, Kang HM, Hostetter T, Susztak K. Molecular mechanisms of diabetic kidney disease. J. Clin. Invest. 2014;124:2333–2340. doi: 10.1172/JCI72271. - DOI - PMC - PubMed
    1. Costantini F, Kopan R. Patterning a complex organ: branching morphogenesis and nephron segmentation in kidney development. Dev. Cell. 2010;18:698–712. doi: 10.1016/j.devcel.2010.04.008. - DOI - PMC - PubMed
    1. Park JS, et al. Six2 and Wnt regulate self-renewal and commitment of nephron progenitors through shared gene regulatory networks. Dev. Cell. 2012;23:637–651. doi: 10.1016/j.devcel.2012.07.008. - DOI - PMC - PubMed
    1. Harding SD, et al. The GUDMAP database–an online resource for genitourinary research. Development. 2011;138:2845–2853. doi: 10.1242/dev.063594. - DOI - PMC - PubMed
    1. Wu H, et al. Comparative analysis and refinement of human PSC-derived kidney organoid differentiation with single-cell transcriptomics. Cell Stem Cell. 2018;23:869–881 e868. doi: 10.1016/j.stem.2018.10.010. - DOI - PMC - PubMed

Publication types

MeSH terms

LinkOut - more resources