

Separating individual contributions of major Siberian rivers in the Transpolar Drift of the Arctic Ocean
- PMID: 33859225
- PMCID: PMC8050230
- DOI: 10.1038/s41598-021-86948-y
Separating individual contributions of major Siberian rivers in the Transpolar Drift of the Arctic Ocean
Abstract
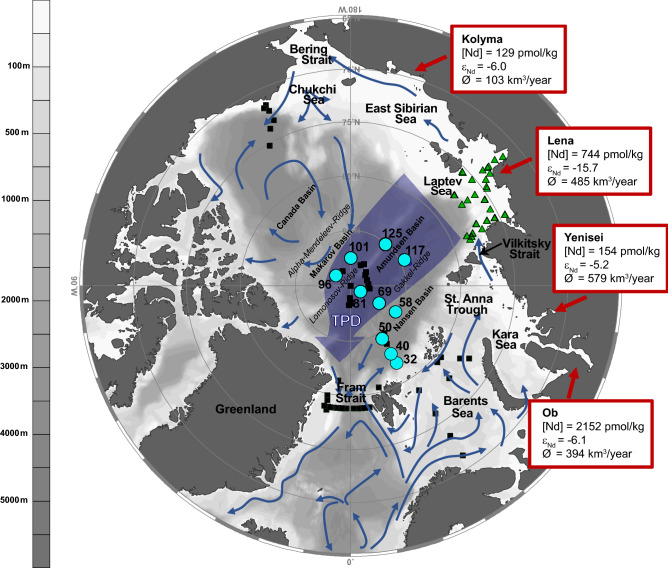
The Siberian rivers supply large amounts of freshwater and terrestrial derived material to the Arctic Ocean. Although riverine freshwater and constituents have been identified in the central Arctic Ocean, the individual contributions of the Siberian rivers to and their spatiotemporal distributions in the Transpolar Drift (TPD), the major wind-driven current in the Eurasian sector of the Arctic Ocean, are unknown. Determining the influence of individual Siberian rivers downstream the TPD, however, is critical to forecast responses in polar and sub-polar hydrography and biogeochemistry to the anticipated individual changes in river discharge and freshwater composition. Here, we identify the contributions from the largest Siberian river systems, the Lena and Yenisei/Ob, in the TPD using dissolved neodymium isotopes and rare earth element concentrations. We further demonstrate their vertical and lateral separation that is likely due to distinct temporal emplacements of Lena and Yenisei/Ob waters in the TPD as well as prior mixing of Yenisei/Ob water with ambient waters.
Conflict of interest statement
The authors declare no competing interests.
Figures
Similar articles
-
Dynamic ice-ocean pathways along the Transpolar Drift amplify the dispersal of Siberian matter.Nat Commun. 2025 Apr 14;16(1):3172. doi: 10.1038/s41467-025-57881-9. Nat Commun. 2025. PMID: 40229259 Free PMC article.
-
Freshwater transport between the Kara, Laptev, and East-Siberian seas.Sci Rep. 2020 Aug 3;10(1):13041. doi: 10.1038/s41598-020-70096-w. Sci Rep. 2020. PMID: 32747694 Free PMC article.
-
PCBs, PBDEs and pesticides released to the Arctic Ocean by the Russian rivers Ob and Yenisei.Environ Sci Technol. 2008 Jan 1;42(1):69-74. doi: 10.1021/es071673l. Environ Sci Technol. 2008. PMID: 18350877
-
Northern High-Latitude Organic Soils As a Vital Source of River-Borne Dissolved Iron to the Ocean.Environ Sci Technol. 2021 Jul 20;55(14):9672-9690. doi: 10.1021/acs.est.1c01439. Epub 2021 Jul 12. Environ Sci Technol. 2021. PMID: 34251212 Review.
-
Arctic climatechange and its impacts on the ecology of the North Atlantic.Ecology. 2008 Nov;89(11 Suppl):S24-38. doi: 10.1890/07-0550.1. Ecology. 2008. PMID: 19097482 Review.
Cited by
-
Dynamic ice-ocean pathways along the Transpolar Drift amplify the dispersal of Siberian matter.Nat Commun. 2025 Apr 14;16(1):3172. doi: 10.1038/s41467-025-57881-9. Nat Commun. 2025. PMID: 40229259 Free PMC article.
References
-
- Jones EP, Anderson LG, Jutterström S, Swift JH. Sources and distribution of fresh water in the East Greenland Current. Prog. Oceanogr. 2008;78:37–44. doi: 10.1016/j.pocean.2007.06.003. - DOI
-
- Wheeler PA, Watkins JM, Hansing RL. Nutrients, organic carbon and organic nitrogen in the upper water column of the Arctic Ocean: Implications for the sources of dissolved organic carbon. Deep. Res. Part II Top. Stud. Oceanogr. 1997;44:1571–1592. doi: 10.1016/S0967-0645(97)00051-9. - DOI
-
- Bauch D, et al. Origin of freshwater and polynya water in the Arctic Ocean halocline in summer 2007. Prog. Oceanogr. 2011;91:482–495. doi: 10.1016/j.pocean.2011.07.017. - DOI
-
- Middag R, de Baar HJW, Laan P, Klunder MB. Fluvial and hydrothermal input of manganese into the Arctic Ocean. Geochim. Cosmochim. Acta. 2011;75:2393–2408. doi: 10.1016/j.gca.2011.02.011. - DOI
-
- Klunder MB, Laan P, Middag R, De Baar HJW, Bakker K. Dissolved iron in the Arctic Ocean: Important role of hydrothermal sources, shelf input and scavenging removal. J. Geophys. Res. Ocean. 2012;117:1–17. doi: 10.1029/2011JC007133. - DOI
Publication types
LinkOut - more resources
Full Text Sources
Other Literature Sources
Miscellaneous
