. 2021 Apr 15;11(1):8279.
doi: 10.1038/s41598-021-87441-2.

Novel, non-invasive markers for detecting therapy induced neuroendocrine differentiation in castration-resistant prostate cancer patients

Affiliations

Novel, non-invasive markers for detecting therapy induced neuroendocrine differentiation in castration-resistant prostate cancer patients

Divya Bhagirath et al. Sci Rep. .

Abstract

Neuroendocrine prostate cancer (NEPC), a highly aggressive variant of castration-resistant prostate cancer (CRPC), often emerges upon treatment with androgen pathway inhibitors, via neuroendocrine differentiation. Currently, NEPC diagnosis is challenging as available markers are not sufficiently specific. Our objective was to identify novel, extracellular vesicles (EV)-based biomarkers for diagnosing NEPC. Towards this, we performed small RNA next generation sequencing in serum EVs isolated from a cohort of CRPC patients with adenocarcinoma characteristics (CRPC-Adeno) vs CRPC-NE and identified significant dysregulation of 182 known and 4 novel miRNAs. We employed machine learning algorithms to develop an 'EV-miRNA classifier' that could robustly stratify 'CRPC-NE' from 'CRPC-Adeno'. Examination of protein repertoire of exosomes from NEPC cellular models by mass spectrometry identified thrombospondin 1 (TSP1) as a specific biomarker. In view of our results, we propose that a miRNA panel and TSP1 can be used as novel, non-invasive tools to identify NEPC and guide treatment decisions. In conclusion, our study identifies for the first time, novel non-invasive exosomal/extracellular vesicle based biomarkers for detecting neuroendocrine differentiation in advanced castration resistant prostate cancer patients with important translational implications in clinical management of these patients that is currently extremely challenging.


Conflict of interest statement

The authors declare no competing interests.

Figures

Figure 1
Figure 1
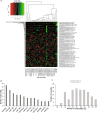
miRNA profiling of exosomes/EVs isolated from sera of CRPC-adenocarcinoma and CRPC-NE (treatment-induced) cases. (A) Representative NTA analyses for CRPC-Adeno (upper left panel) and CRPC-NE case (upper right panel). Particle size (left) and concentration (right) in CRPC-Adeno and CRPC-NE cases as determined by NTA analyses. (B) Western blot analyses for indicated exosomal markers in CRPC-Adeno and CRPC-NE cases. Samples 1–9 and 10–15 were run on two separate gels, with the partitioning indicated by solid black line. Samples derive from the same experiment and gels/blots were processed in parallel. Since CD63 and TSG101 fall in same size range, Western blots were initially probed with CD63 antibody. Following stripping, blots were re-probed with TSG101 antibody. (C) Heat map showing differentially expressed mature EV miRNAs in CRPC-adeno cases (n = 21) as compared to CRPC-NE (n = 6) cases. Heat map was generated by using R studio software, Version 1.1.463 (https://www.npackd.org/p/rstudio/1.1.463). Clusters (I-IV) are denoted by blue bars. (D) PCA plot showing EV-miRNA profiles in CRPC-Adeno and CRPC-NE cases.
Figure 2
Figure 2
Predominant dysregulation of miRNA isoforms in EVs from NEPC. (A) Heat map showing differentially expressed iso-miRs in EVs from CRPC-adeno cases (n = 21) as compared to CRPC-NE (n = 6 clinical tissues + NCI-H660 cell line). Heat map was generated by using R studio software, Version 1.1.463 (https://www.npackd.org/p/rstudio/1.1.463). (B) miRNA loci producing ≥ 3 differentially expressed iso-miRs in sequenced samples plotted as a function of number of observed iso-miRs. (C) Range of length of differentially expressed iso-miRs (14–24 nucleotides) and their abundance across sequenced EV miRNAs extracted from CRPC-Adeno and CRPC-NE samples.
Figure 3
Figure 3
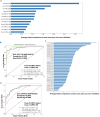
An EV-microRNA classifier of neuroendocrine differentiation in castration resistant prostate cancer. (A) Application of machine learning methods (random forest machine learning technique with leave-pair-out cross validation) to the NGS dataset of analyzed NE tissues + NCI-H660 cell line (CRPC-NE, n = 7) vs those with adenocarcinoma features (CRPC-Adeno, n = 21) yielded a ‘12 miRNA classifier’. miRNAs are listed in the order of feature importance as determined by these methods. (B) ROC curve analyses showing the ability of ‘EV-miRNA classifier’ to distinguish between class 0 (CRPC-Adeno) and class 1 (CRPC-NE). (C) An EV- miRNA classifier including isoforms of miRNAs as determined by random forest machine learning technique with leave-pair-out cross validation as applied to the NGS dataset of analyzed EVs from CRPC-NE (n = 6) + NCI-H660 cell line vs those from CRPC-Adeno patients (n = 21) including miRNA isoforms. miRNAs are listed in the order of feature importance. (D) ROC curve analyses showing the ability of ‘EV-miRNA classifier including iso-miRs’ to distinguish between class 0 (CRPC-Adeno) and class 1 (CRPC-NE).
Figure 4
Figure 4
EV miRNA alterations in prostate cancer tissues undergoing NED. (A) Scatter plot showing EV-miRNA alterations in CRCP-Adeno vs CRPC-NE tissues profiled by small RNA NGS. (B) Plot comparing miRNA signal intensities of tissue and corresponding serum EV samples in CRPC-Adenocracinoma vs CRPC-NE cases. (C) Machine learning method as applied to EV-miRNA alterations that were also observed in corresponding prostate cancer tissues. (D) ROC curve analyses showing the ability of two-EV-miRNA classifier to distinguish between class 0 (CRPC-Adeno) and class 1 (CRPC-NE). (E) Validation of two-EV-miRNA classifier in NEPC cellular model NCI-H660 compared to parental LNCaP-AR and LNCaP-AR ENZ resistant cells by real time PCR based expression profiling.
Figure 5
Figure 5
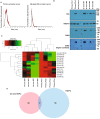
EV-miRNA profiling of de novo NEPC shows distinct miRNA alterations from treatment-induced NEPC. (A) Representative NTA analyses of EVs isolated from primary adenocarcinomas (left) and de novo NEPC (right). (B) Western blot analyses for exosomal markers in EVs isolated from primary adenocarcinomas and de novo NEPC. Following transfer of gel, blots were cut according to molecular weights. Upper parts of blots were probed with Alix antibody and lower parts were probed with TSG101 antibody. Since CD63 and TSG101 fall in same size range, following stripping, blots were re-probed with CD63 antibody. (C) Heat map showing differentially expressed miRNAs in EVs from de novo NEPC patients and those with primary adenocarcinomas. Heat map was generated by using R studio software, Version 1.1.463 (https://www.npackd.org/p/rstudio/1.1.463). (D) Venn diagram showing miRNA altered significantly in de novo NEPC vs treatment induced NEPC.
Figure 6
Figure 6
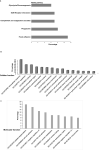
Mass spectrometric analyses of protein content of EVs from NEPC cellular models. Following extensive characterization of EVs, proteins were isolated from LNCaP-AR, LNCaP-AR-EnzR and NCI-H660 cells followed by mass spectrometric analyses by Shot gun approach and analyses by (DAVID) v 6.8 software to discover the association of identified proteins with biological processes, cellular components and KEGG pathways,. (A) KEGG pathways, impacted by proteins isolated from EVs of NCI-H660 cells as compared to EVs from LNCaP-AR cells. (B) Cellular fraction of EV proteins from NCI-H660 cells as compared to EVs from LNCaP-AR cells. (C) Molecular function of EV proteins from NCI-H660 cells as compared to EVs from LNCaP-AR cells.
Figure 7
Figure 7
Thrombospondin 1 as a novel, highly specific EV protein biomarker for neuroendocrine prostate cancer. (A) EV-associated TSP1, Gelsolin and exosomal markers CD63 and CD9 expression as analyzed by Western blotting in EVs from LNCaP-AR, LNCaP-AR-EnzR and NCI-H660 cells. (B) EV-associated TSP1, Gelsolin and exosomal markers CD63 and TSG101 expression as analyzed by Western blotting in EVs from CRPC-Adeno and CRPC-NE tissues. Clinical samples were run in two separate gels (lanes 1-9, gel no. 1 and lanes 10-18, gel no. 2). The boundaries of gels are delineated by black lines. Samples derive from the same experiment and gels/blots were processed in parallel. Following transfer of gel, blots were cut according to molecular weights. Upper parts of blots were probed with THBS1 antibody and lower parts were probed with Gelsolin and CD63 antibody. Since CD63 and TSG101 fall in same size range, following stripping, CD63 blots were re-probed with TSG101 antibody. (C) TSP1 ELISA to validate TSP1 as a novel NEPC biomarker. Left panel shows the standard curve derived from known concentrations of standard TSP1. Right panel shows computed TSP1 values from TSP1 ELISA assay using EVs from CRPC-Adeno and CRPC-NE clinical samples.

Similar articles

Cited by

References

    1. Siegel RL, Miller KD, Jemal A. Cancer statistics, 2020. CA Cancer J. Clin. 2020;70:7–30. doi: 10.3322/caac.21590. - DOI - PubMed
    1. Knudsen KE, Scher HI. Starving the addiction: new opportunities for durable suppression of AR signaling in prostate cancer. Clin. Cancer Res. 2009;15:4792–4798. doi: 10.1158/1078-0432.CCR-08-2660. - DOI - PMC - PubMed
    1. Shen MM, Abate-Shen C. Molecular genetics of prostate cancer: New prospects for old challenges. Genes Dev. 2010;24:1967–2000. doi: 10.1101/gad.1965810. - DOI - PMC - PubMed
    1. Scher HI, et al. Increased survival with enzalutamide in prostate cancer after chemotherapy. N. Engl. J. Med. 2012;367:1187–1197. doi: 10.1056/NEJMoa1207506. - DOI - PubMed
    1. Komura K, et al. Current treatment strategies for advanced prostate cancer. Int. J. Urol. 2018;25:220–231. doi: 10.1111/iju.13512. - DOI - PMC - PubMed

Publication types

MeSH terms

Substances