

Proteomic profiling of the rat hippocampus from the kindling and pilocarpine models of epilepsy: potential targets in calcium regulatory network
- PMID: 33859251
- PMCID: PMC8050094
- DOI: 10.1038/s41598-021-87555-7
Proteomic profiling of the rat hippocampus from the kindling and pilocarpine models of epilepsy: potential targets in calcium regulatory network
Abstract
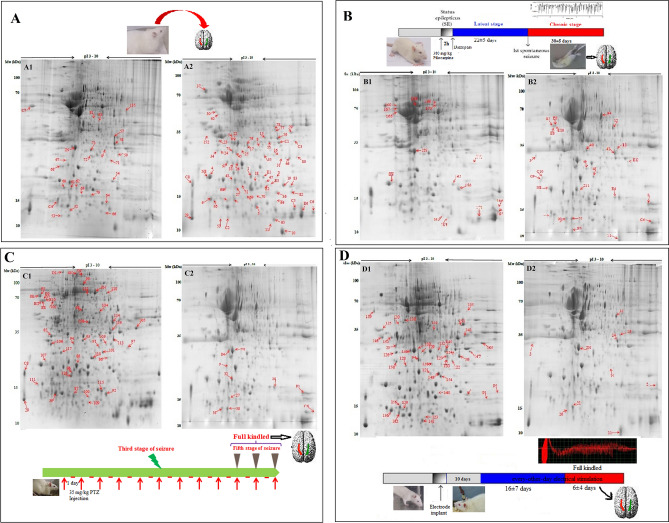
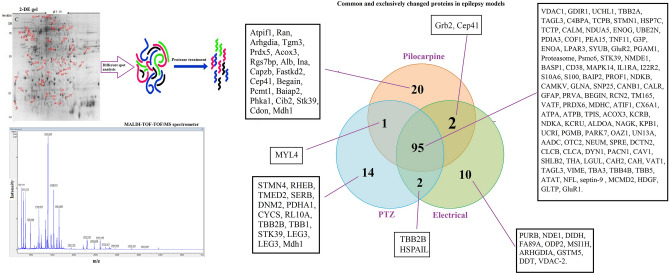
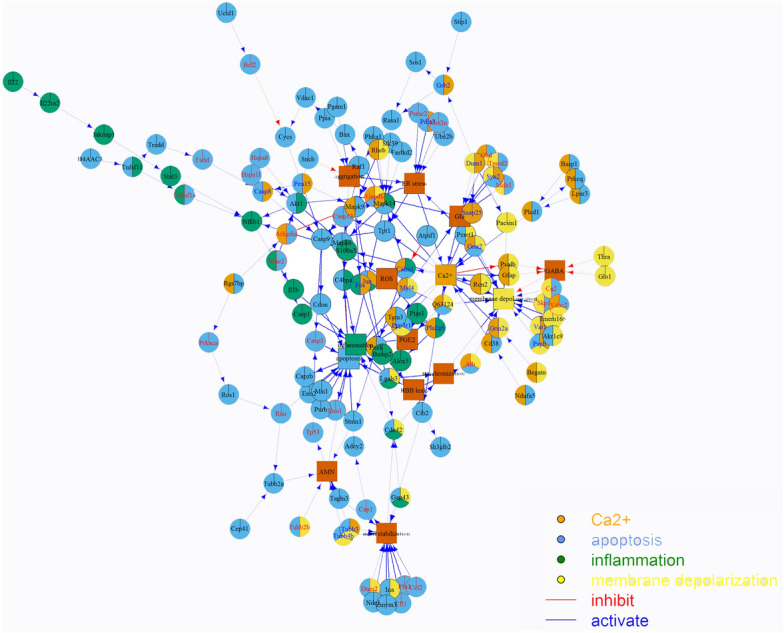
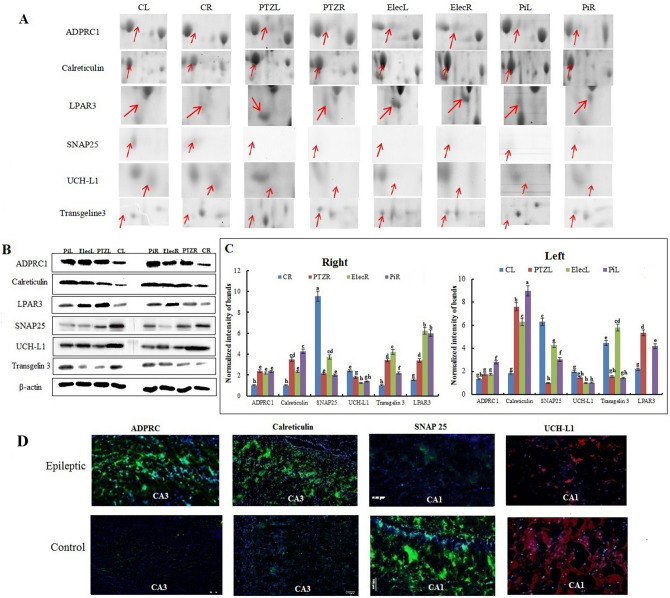
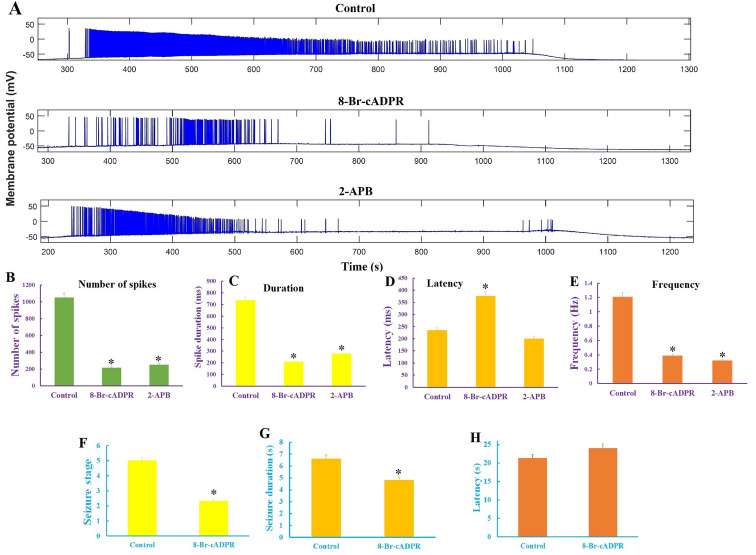
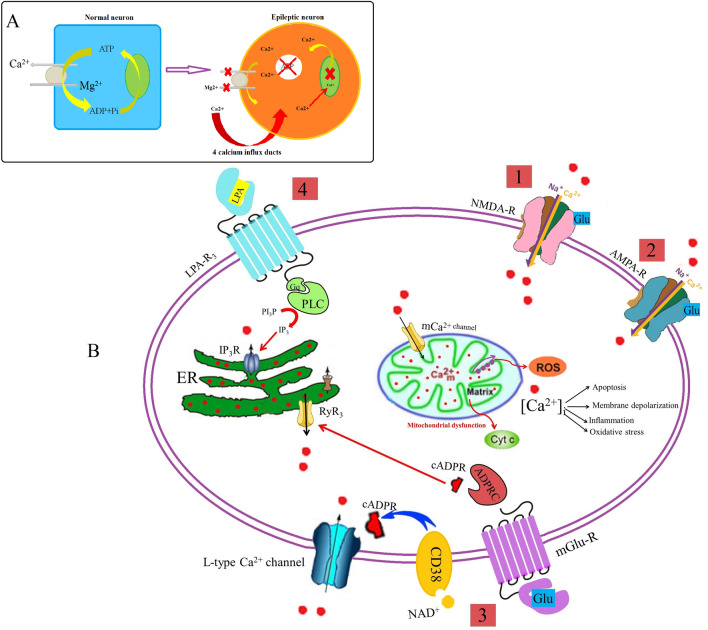
Herein proteomic profiling of the rat hippocampus from the kindling and pilocarpine models of epilepsy was performed to achieve new potential targets for treating epileptic seizures. A total of 144 differently expressed proteins in both left and right hippocampi by two-dimensional electrophoresis coupled to matrix-assisted laser desorption-mass spectrometry were identified across the rat models of epilepsy. Based on network analysis, the majority of differentially expressed proteins were associated with Ca2+ homeostasis. Changes in ADP-ribosyl cyclase (ADPRC), lysophosphatidic acid receptor 3 (LPAR3), calreticulin, ubiquitin carboxyl-terminal hydrolase L1 (UCH-L1), synaptosomal nerve-associated protein 25 (SNAP 25) and transgelin 3 proteins were probed by Western blot analysis and validated using immunohistochemistry. Inhibition of calcium influx by 8-Bromo-cADP-Ribose (8-Br-cADPR) and 2-Aminoethyl diphenylborinate (2-APB) which act via the ADPRC and LPAR3, respectively, attenuated epileptic seizures. Considering a wide range of molecular events and effective role of calcium homeostasis in epilepsy, polypharmacy with multiple realistic targets should be further explored to reach the most effective treatments.
Conflict of interest statement
The authors declare no competing interests.
Figures
Similar articles
-
CD38 and MGluR1 as possible signaling molecules involved in epileptogenesis: A potential role for NAD+ homeostasis.Brain Res. 2021 Aug 15;1765:147509. doi: 10.1016/j.brainres.2021.147509. Epub 2021 Apr 28. Brain Res. 2021. PMID: 33930374
-
Comparative proteomics and correlated signaling network of rat hippocampus in the pilocarpine model of temporal lobe epilepsy.Proteomics. 2008 Feb;8(3):582-603. doi: 10.1002/pmic.200700514. Proteomics. 2008. PMID: 18186018
-
Characterization, using comparative proteomics, of differentially expressed proteins in the hippocampus of the mesial temporal lobe of epileptic rats following treatment with valproate.Amino Acids. 2011 Jan;40(1):221-38. doi: 10.1007/s00726-010-0638-8. Epub 2010 Jun 4. Amino Acids. 2011. PMID: 20524136
-
Proteomic identification of the involvement of the mitochondrial rieske protein in epilepsy.Epilepsia. 2005 Mar;46(3):339-43. doi: 10.1111/j.0013-9580.2005.46904.x. Epilepsia. 2005. PMID: 15730530
-
Adenosine diphosphate ribose cyclase: An important regulator of human pathological and physiological processes.J Cell Physiol. 2022 Apr;237(4):2064-2077. doi: 10.1002/jcp.30688. Epub 2022 Jan 30. J Cell Physiol. 2022. PMID: 35098541 Review.
Cited by
-
Glucose restriction induces degeneration of neurons with mitochondrial DNA depletion by altering ER-mitochondria calcium transfer.Mol Psychiatry. 2025 Jun 3. doi: 10.1038/s41380-025-03069-y. Online ahead of print. Mol Psychiatry. 2025. PMID: 40461815
-
Low-frequency rTMS Plays a Neuroprotective role in Pilocarpine-induced Status Epilepticus Rat Models Through the AMPAR GluA1-STIM-Ca2+ Pathway.Mol Neurobiol. 2025 Apr;62(4):4042-4054. doi: 10.1007/s12035-024-04521-w. Epub 2024 Oct 9. Mol Neurobiol. 2025. PMID: 39384697 Free PMC article.
-
Overrepresentation of Enterobacteriaceae and Escherichia coli is the major gut microbiome signature in Crohn's disease and ulcerative colitis; a comprehensive metagenomic analysis of IBDMDB datasets.Front Cell Infect Microbiol. 2022 Oct 4;12:1015890. doi: 10.3389/fcimb.2022.1015890. eCollection 2022. Front Cell Infect Microbiol. 2022. PMID: 36268225 Free PMC article.
-
Proteomic Analysis Reveals the Vital Role of Synaptic Plasticity in the Pathogenesis of Temporal Lobe Epilepsy.Neural Plast. 2022 Jul 11;2022:8511066. doi: 10.1155/2022/8511066. eCollection 2022. Neural Plast. 2022. PMID: 35860309 Free PMC article.
-
Integrated Proteomics and Protein Co-expression Network Analysis Identifies Novel Epileptogenic Mechanism in Mesial Temporal Lobe Epilepsy.Mol Neurobiol. 2024 Nov;61(11):9663-9679. doi: 10.1007/s12035-024-04186-5. Epub 2024 Apr 30. Mol Neurobiol. 2024. PMID: 38687446
References
Publication types
MeSH terms
Substances
LinkOut - more resources
Full Text Sources
Other Literature Sources
Medical
Research Materials
Miscellaneous
