. 2021 Apr 15;11(1):8282.
doi: 10.1038/s41598-021-87720-y.

Macrophages with reduced expressions of classical M1 and M2 surface markers in human bronchoalveolar lavage fluid exhibit pro-inflammatory gene signatures

Affiliations

Macrophages with reduced expressions of classical M1 and M2 surface markers in human bronchoalveolar lavage fluid exhibit pro-inflammatory gene signatures

Hiroto Takiguchi et al. Sci Rep. .

Abstract

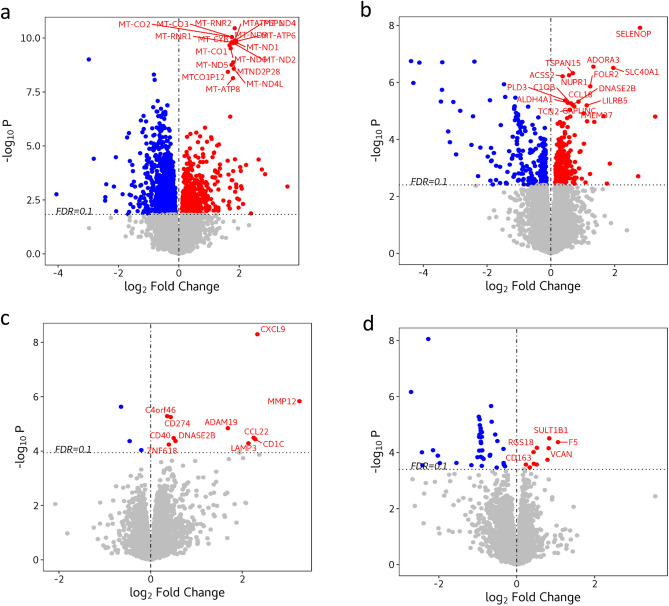
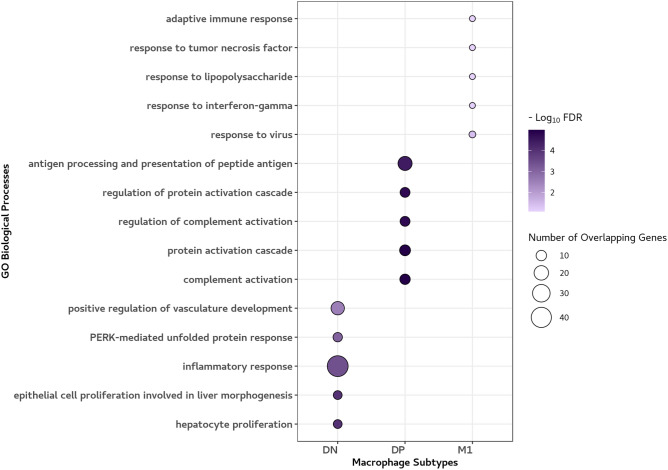
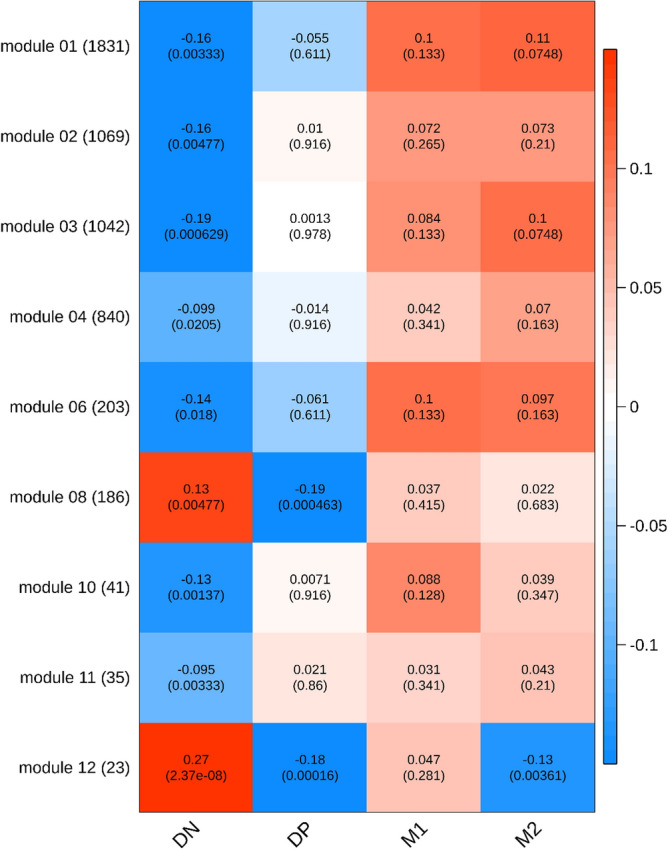
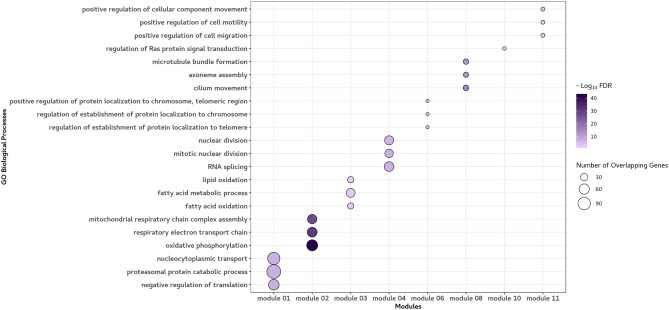
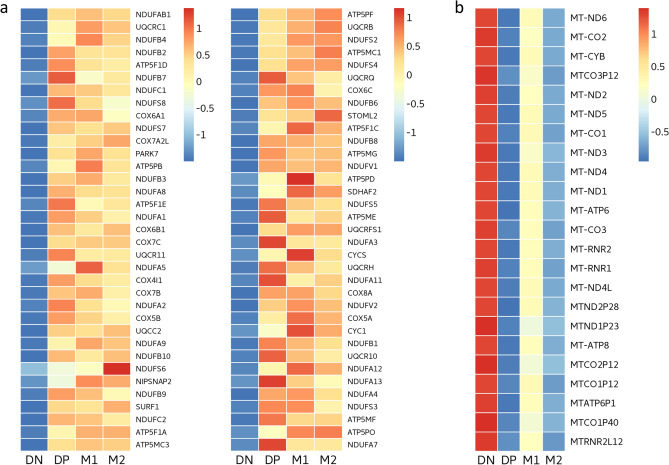
The classical M1/M2 polarity of macrophages may not be applicable to inflammatory lung diseases including chronic obstructive pulmonary disease (COPD) due to the complex microenvironment in lungs and the plasticity of macrophages. We examined macrophage sub-phenotypes in bronchoalveolar lavage (BAL) fluid in 25 participants with CD40 (a M1 marker) and CD163 (a M2 marker). Of these, we performed RNA-sequencing on each subtype in 10 patients using the Illumina NextSeq 500. Approximately 25% of the macrophages did not harbor classical M1 or M2 surface markers (double negative, DN), and these cells were significantly enriched in COPD patients compared with non-COPD patients (46.7% vs. 14.5%, p < 0.001). 1886 genes were differentially expressed in the DN subtype compared with all other subtypes at a 10% false discovery rate. The 602 up-regulated genes included 15 mitochondrial genes and were enriched in 86 gene ontology (GO) biological processes including inflammatory responses. Modules associated with cellular functions including oxidative phosphorylation were significantly down-regulated in the DN subtype. Macrophages in the human BAL fluid, which were negative for both M1/M2 surface markers, harbored a gene signature that was pro-inflammatory and suggested dysfunction in cellular homeostasis. These macrophages may contribute to the pathogenesis and manifestations of inflammatory lung diseases such as COPD.


Conflict of interest statement

The authors declare no competing interests.

Figures

Figure 1
Figure 1
Volcano plots showing differentially expressed genes across macrophage subtypes (n = 10). (a) Double negative (DN) subtype versus the other subtypes. (b) Double positive (DP) subtype versus the others. (c) M1 subtype versus the others. (d) M2 versus the others. The plot shows the fold-change on the X-axis versus the unadjusted p values (on a –log10 scale) on the Y-axis. Differentially expressed genes at 10% FDR are represented as colored dots and the top 20 up-regulated genes for each cell-type are labelled on the graph. The greatest number of differentially expressed genes was observed with the DN subtype (1886 differentially expressed genes versus all other subtypes at 10% FDR) followed by 498 differentially expressed genes between the DP subtype and the others; 15 genes between the M1 subtype and the others; and 52 genes between the M2 subtype and the others. The top 20 up-regulated genes for the DN macrophages included 15 mitochondrial genes and 4 mitochondrial pseudogenes. Figure created with the R (version 3.5.0). https://www.r-project.org/.
Figure 2
Figure 2
Enrichment analysis: The top 5 Gene Ontology (GO) biological processes based on up-regulated differentially expressed genes. The top 5 GO biological processes at 10% FDR for each macrophage subtype are shown. The circle size represents the number of overlapping genes between each GO process and up-regulated genes according to the subtype. The colour scale represents the extent to which the up-regulated genes are significantly enriched in each GO process. The GO processes associated with DN, DP and M1 subtype included inflammatory response, complement activation and response to virus, respectively, whereas none of the up-regulated genes for M2 macrophages were enriched in the GO processes. Figure created with the R package ggplot2. https://cran.r-project.org/web/packages/ggplot2/index.html.
Figure 3
Figure 3
Heat map of the correlation of weighted gene co-expression network analysis (WCGNA) modules with macrophage subtypes (n = 10). The rows represent the gene modules and the sizes of the modules are shown in parentheses next to the module name. The columns represent macrophage subtypes. In each cell, the number at the top is the linear regression coefficient and the number in the parentheses is the corresponding p-value. Color scale represents the regression coefficient. Only modules with at least one significant cell at 10% FDR across four subtypes are  shown. Gene signatures in the DN subtype were significantly distinct from those of the othersubtypes . Importantly, Module 12, which was composed of 15 mitochondrial genes, was up-regulated in DNs, and was down-regulated in the DP and M2 subtypes. Figure created with the R package “WGCNA” (version 1.68). https://cran.r-project.org/web/packages/WGCNA/index.html.
Figure 4
Figure 4
The top 3 GO biological processes at 10% FDR based on a weighted gene co-expression network analysis (WGCNA). The top 3 GO biological processes at 10% FDR for each module are shown. The circle size represents the number of overlapping genes between each GO process and genes in the module. The colour scale represents the extent to which the genes are significantly enriched in each module. Module 2 was most strongly associated with the function of ATP production in mitochondria. Module 3 was  associated with fatty oxidation and metabolism. Module 4 was associated with RNA splicing and mitotic nuclear division. Module 6 was associated with regulation of protein localization to telomeres. Figure created with the R package ggplot2. https://cran.r-project.org/web/packages/ggplot2/index.html.
Figure 5
Figure 5
Relative gene expression across macrophage subtypes (n = 10). Heat maps showing (a) genes in the gene ontology (GO) biological process of oxidative phosphorylation overlapping with genes in module 2 and (b) mitochondrial genes in module 12. Color scale represents the scaled mean expression level (log2 TPM) of each subtype (red indicates up-regulation, blue indicates down-regulation). The oxidative phosphorylation genes were down-regulated in the DN subtype, whereas the mitochondrial genes were up-regulated in the DN subtype. Figure created with the R package “NMF” (version 0.22.0). https://cran.r-project.org/web/packages/NMF/index.html.

References

    1. Gordon S, Martinez FO. Alternative activation of macrophages: mechanism and functions. Immunity. 2010;32:593–604. doi: 10.1016/j.immuni.2010.05.007. - DOI - PubMed
    1. Tarique AA, et al. Phenotypic, functional, and plasticity features of classical and alternatively activated human macrophages. Am. J. Respir. Cell Mol. Biol. 2015;53:676–688. doi: 10.1165/rcmb.2015-0012OC. - DOI - PubMed
    1. Mills CD, Kincaid K, Alt JM, Heilman MJ, Hill AM. M-1/M-2 macrophages and the Th1/Th2 paradigm. J. Immunol. 2000;164:6166–6173. doi: 10.4049/jimmunol.164.12.6166. - DOI - PubMed
    1. Arora S, Dev K, Agarwal B, Das P, Syed MA. Macrophages: their role, activation and polarization in pulmonary diseases. Immunobiology. 2018;223:383–396. doi: 10.1016/j.imbio.2017.11.001. - DOI - PMC - PubMed
    1. Mantovani A, et al. The chemokine system in diverse forms of macrophage activation and polarization. Trends Immunol. 2004;25:677–686. doi: 10.1016/j.it.2004.09.015. - DOI - PubMed

Publication types