. 2021 Apr 15;11(1):8250.
doi: 10.1038/s41598-021-87761-3.

Extra virgin olive oil improved body weight and insulin sensitivity in high fat diet-induced obese LDLr-/-.Leiden mice without attenuation of steatohepatitis

Affiliations

Extra virgin olive oil improved body weight and insulin sensitivity in high fat diet-induced obese LDLr-/-.Leiden mice without attenuation of steatohepatitis

Leticia Álvarez-Amor et al. Sci Rep. .

Abstract

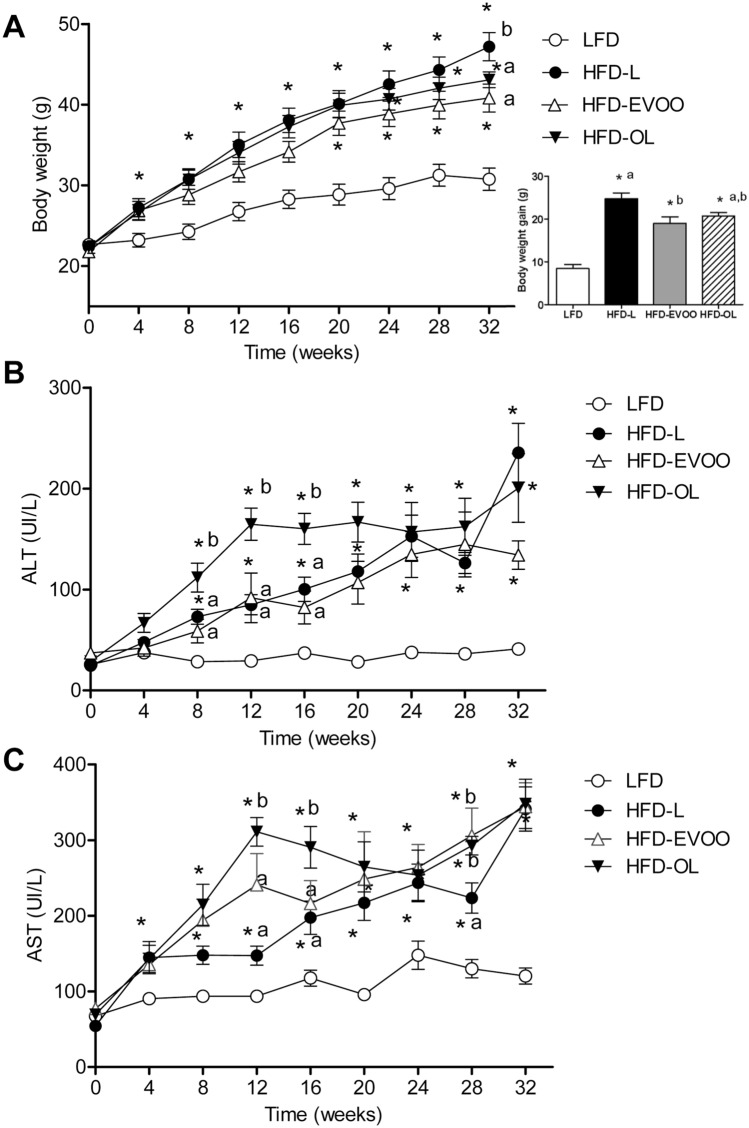
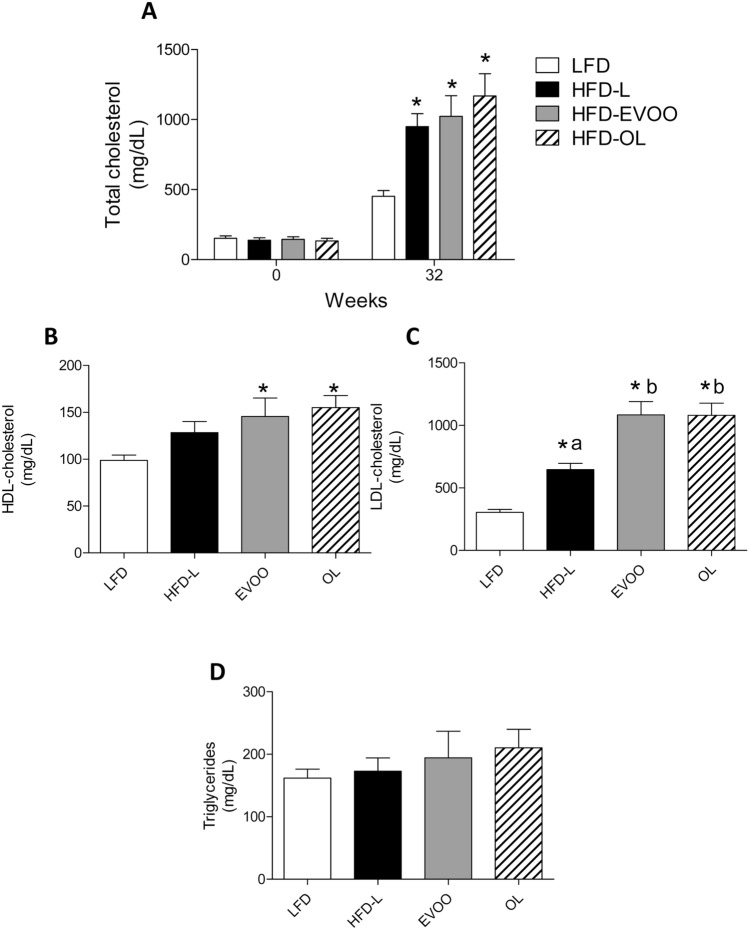
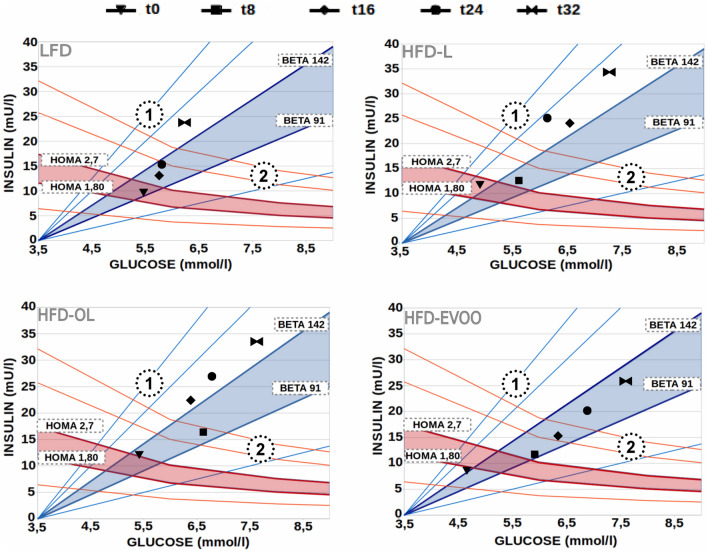
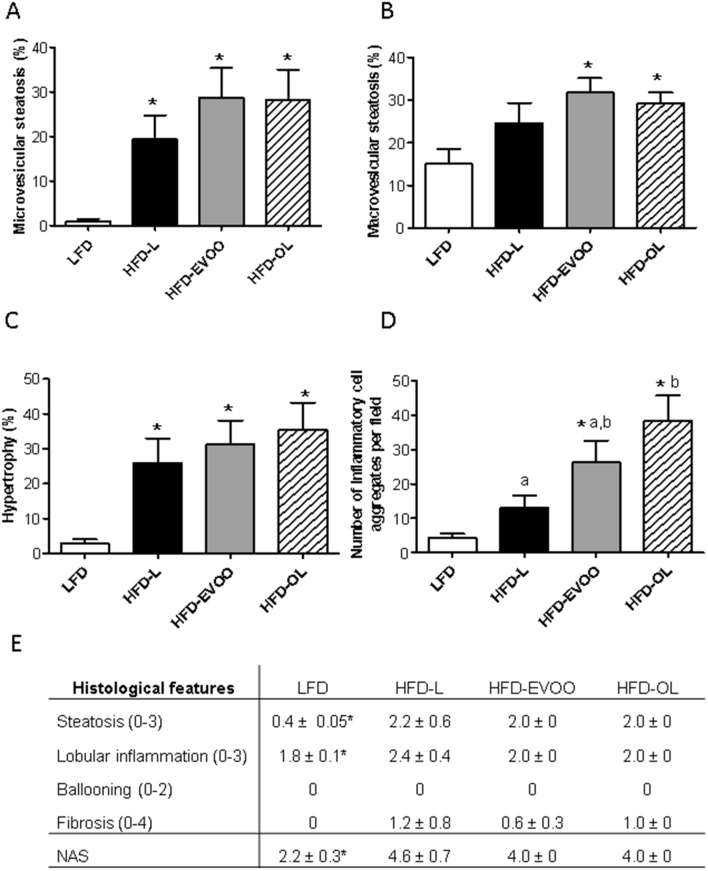
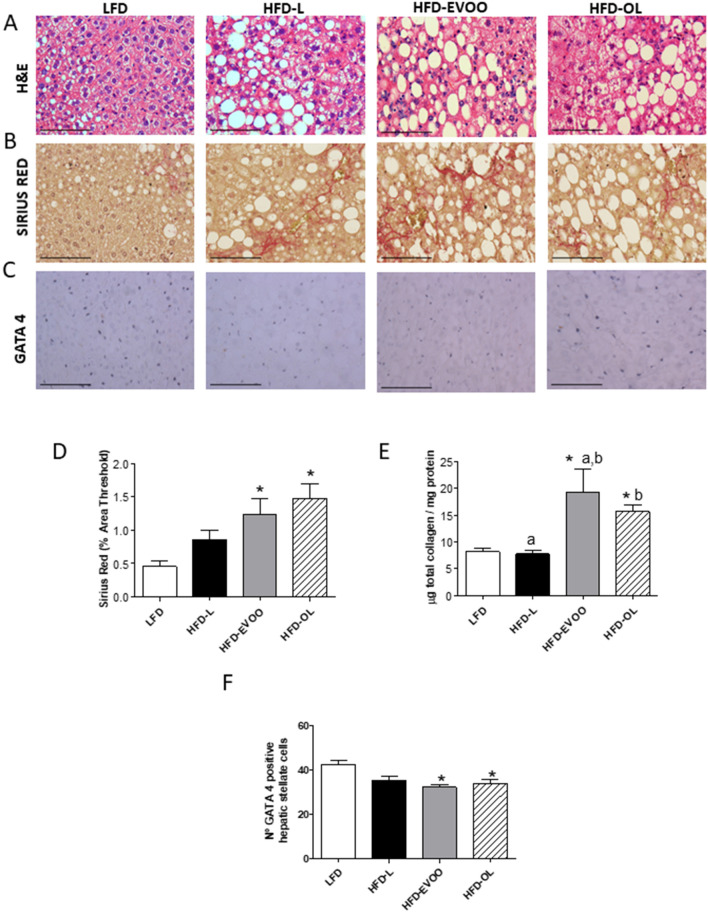
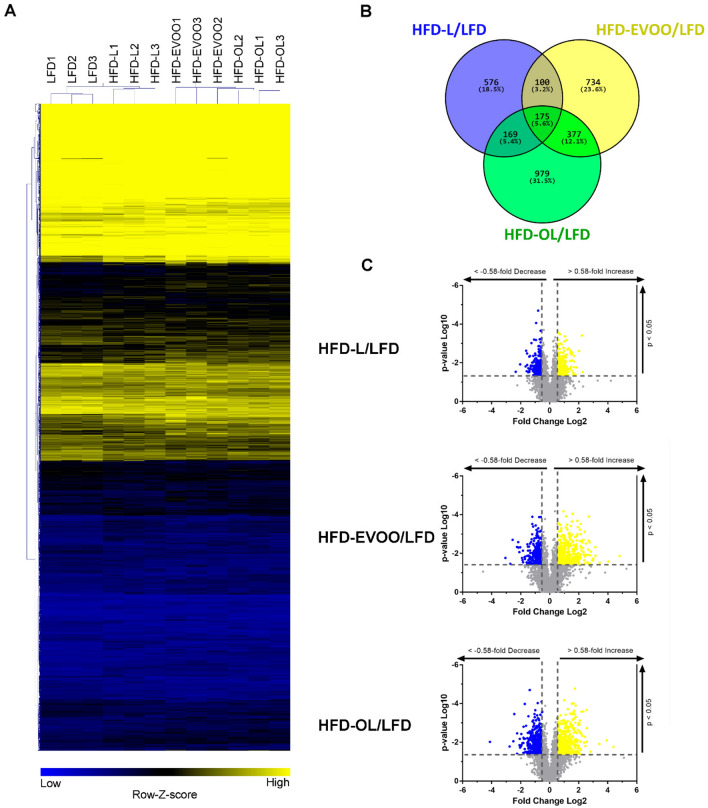
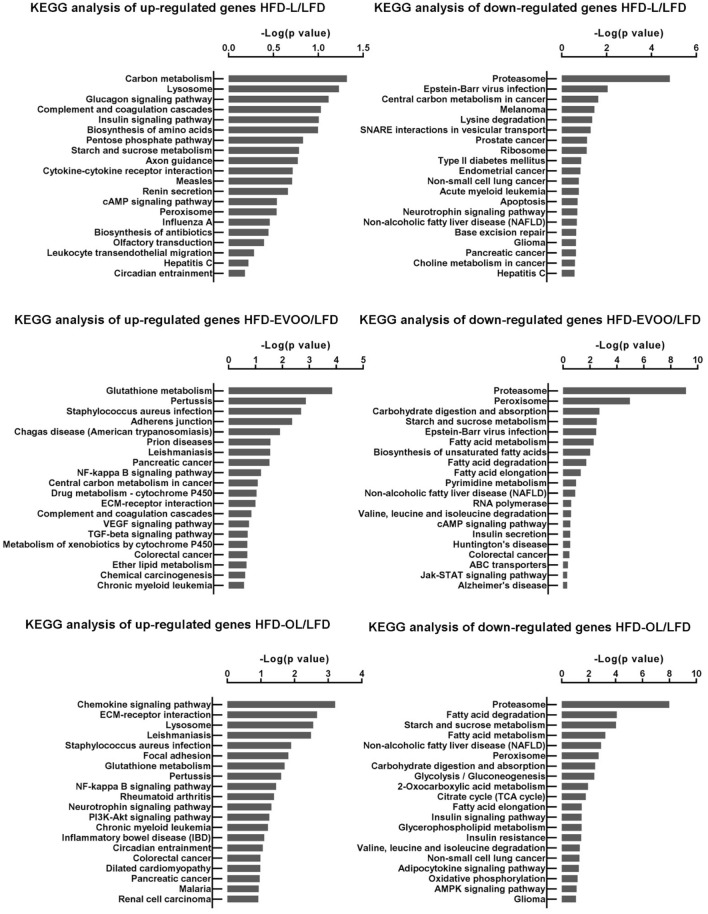
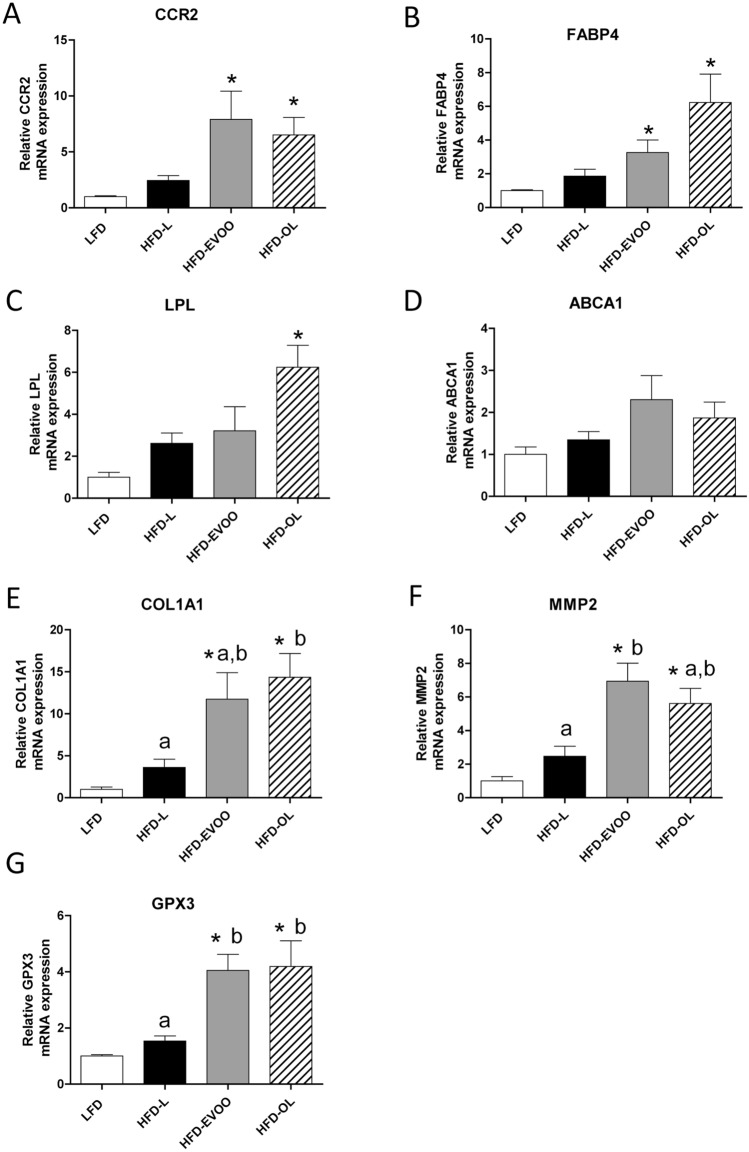
Dietary fatty acids play a role in the pathogenesis of obesity-associated non-alcoholic fatty liver disease (NAFLD), which is associated with insulin resistance (IR). Fatty acid composition is critical for IR and subsequent NAFLD development. Extra-virgin olive oil (EVOO) is the main source of monounsaturated fatty acids (MUFA) in Mediterranean diets. This study examined whether EVOO-containing high fat diets may prevent diet-induced NAFLD using Ldlr-/-. Leiden mice. In female Ldlr-/-.Leiden mice, the effects of the following high fat diets (HFDs) were examined: a lard-based HFD (HFD-L); an EVOO-based HFD (HFD-EVOO); a phenolic compounds-rich EVOO HFD (HFD-OL). We studied changes in body weight (BW), lipid profile, transaminases, glucose homeostasis, liver pathology and transcriptome. Both EVOO diets reduced body weight (BW) and improved insulin sensitivity. The EVOOs did not improve transaminase values and increased LDL-cholesterol and liver collagen content. EVOOs and HFD-L groups had comparable liver steatosis. The profibrotic effects were substantiated by an up-regulation of gene transcripts related to glutathione metabolism, chemokine signaling and NF-kappa-B activation and down-regulation of genes relevant for fatty acid metabolism. Collectivelly, EVOO intake improved weight gain and insulin sensitivity but not liver inflammation and fibrosis, which was supported by changes in hepatic genes expression.


Conflict of interest statement

The authors declare no competing interests.

Figures

Figure 1
Figure 1
Body weight and transaminases (ALT and AST) values along the nutritional intervention study. (A) Left panel: BW during the 32 weeks of the nutritional intervention study (n = 17); Right panel: BW gain between the first and the last week of the study. (B) ALT and (C) AST values measured during the study (n = 7). Values are the means ± SEM. *p < 0.05 LFD vs HFDs groups (HFD-L, HFD-EVOO and HFD-OL); different letters indicate significant differences among HFD groups (p < 0.05).
Figure 2
Figure 2
Effects of different diets on the lipid profile after 32 weeks of nutritional intervention study. (A) Plasma total cholesterol values at 0 and 32 weeks, (B) HDL-cholesterol, (C) LDL-cholesterol and (D) triglycerides values, at the end of nutritional intervention study. N = 12. Values are the means ± SEM. *p < 0.05 LFD vs HFDs groups (HFD-L, HFD-EVOO and HFD-OL); different letters indicate significant differences among HFD groups (p < 0.05).
Figure 3
Figure 3
Fasting insulinemia vs glycemia with iso-HOMA-IR and iso-HOMA-%B curves at various timepoints (t) of the study (0, 8, 16, 24, and 32). Blue shadow zones represent the normality range for HOMA-%B (BETA 142 and BETA 91). Red shadow zones represent the normality range for HOMA-IR (HOMA 2.7 and HOMA 1.80). The normality ranges were established using fasting insulinemia and glycemia values at week 0 (t0). The average value and the upper value of the confidence interval for the HOMA-IR index were used, as well as the average value and the lower value of the confidence interval for the HOMA-%B. Area 1 reflects increased HOMA-IR and HOMA-%B. Area 2 reflects increased HOMA-IR and decreased HOMA-%B. The fasting insulinemia and glycemia values represent the means of 10 mice for each nutritional intervention.
Figure 4
Figure 4
Diagnosis diagram for NAFLD after 32 weeks of nutritional intervention study. Values reported for steatosis based on the percentage of the total area affected: (A) Microvesicular, (B) Macrovesicular and (C) Hypertrophy. (D) Number of inflammatory foci per field at 100 × magnification. (E) Values reported for steatosis, lobular inflammation, hepatocyte balloon degeneration, fibrosis and NAS (total score) according to the NASH CRN Scoring system. Values represent the means ± SEM (n = 9). *p < 0.05 LFD vs HFDs groups; different letters denote significant differences between HFD groups (p < 0.05).
Figure 5
Figure 5
Liver stains after 32 weeks of nutritional intervention study. (A) H&E staining (40 ×). (B) Sirius Red staining (40 ×). (C) GATA 4 staining (40×). (D) Quantification of hepatic fibrosis by Sirius Red. (E) Quantification of total liver collagen (µg /mg liver protein) in liver homogenates. (F) Quantification of positive HSC per field. Values represent the means ± SEM (n = 10). *p < 0.05 LFD vs HFDs groups; different letters indicate significant differences between HFD groups (p < 0.05). Scale bars = 100 µm.
Figure 6
Figure 6
Hierarchical clustering, Venn diagram and scatter plots of differential expression profiles of LFD, HFD-L, HFD-EVOO and HFD-OL liver genes. (A) Hierarchical clustering of differential expression profiles of LFD, HFD-L, HFD-EVOO and HFD-OL genes, performed using Euclidean distance according to expression pattern with the MeV software. Scaled expression value, expressed as the row Z-score, is plotted in yellow-blue color scale, with yellow indicating high expression and blue indicating low expression. (B) Venn diagram showing the number and percentage of DEGs (up-regulated and down-regulated) shared by HFD-L, HFD-EVOO and/or HFD-OL relative to LFD. (C) Scatter plot showing the fold change and statistical significance of genes when comparing HFD-L, HFD-EVOO or HFD-OL relative to LFD. The yellow and blue dots represent up- and down-regulated genes, respectively, with statistical significance. The grey dots represent the genes without significant differential expression.
Figure 7
Figure 7
Predicted Biological Process GO terms identified using upregulated and downregulated DEG, in HDL, HDL-EVOO and/or HFD-OL relative to LFD, after 32 weeks of nutritional intervention study. DEGs were processed with DAVID tools v6.8. The p value was used to determine the significance of enrichment or overrepresentation of terms for each annotation. The ranking score was obtained using enrichment − log10 (p value) from the predicted target genes. The x-axis represents score and the y-axis represents the top enriched signaling pathways. The top 20 KEGG terms are listed as derived from the DAVID bioinformatics tool.
Figure 8
Figure 8
Hepatic mRNA expression of genes involved in inflammation, lipid metabolism, fibrosis and oxidative stress at 32 weeks of nutritional intervention. (A) Ccr2; (B) Fbpa4; (C) Lpl; (D) Abca1; (E) Col1a1; (F) Mmp2 and (G) Gxp3. Values are the means ± SEM (n = 3). *p < 0.05 vs LFD; different letters indicate significant differences between HFD groups (p < 0.05).

Similar articles

Cited by

References

    1. Bellentani S. The epidemiology of non-alcoholic fatty liver disease. Liver Int. 2017;37:81–84. doi: 10.1111/liv.13299. - DOI - PubMed
    1. Gastaldelli A. Fatty liver disease: The hepatic manifestation of metabolic syndrome. Hypertens. Res. 2010;35:585–593. - PubMed
    1. Younossi ZM, et al. The economic and clinical burden of nonalcoholic fatty liver disease in the United States and Europe. Hepatology. 2016;64:1577–1586. doi: 10.1002/hep.28785. - DOI - PubMed
    1. Buzzetti E, Pinzani M, Tsochatzis EA. The multiple-hit pathogenesis of non-alcoholic fatty liver disease (NAFLD) Metabolism. 2016;65:1038–1048. doi: 10.1016/j.metabol.2015.12.012. - DOI - PubMed
    1. Musso G, et al. Dietary habits and their relations to insulin resistance and postprandial lipemia in nonalcoholic steatohepatitis. Hepatology. 2003;37:909–916. doi: 10.1053/jhep.2003.50132. - DOI - PubMed

Publication types

MeSH terms