. 2021 Apr 15;11(1):8313.
doi: 10.1038/s41598-021-87817-4.

Estradiol analogs attenuate autophagy, cell migration and invasion by direct and selective inhibition of TRPML1, independent of estrogen receptors

Affiliations

Estradiol analogs attenuate autophagy, cell migration and invasion by direct and selective inhibition of TRPML1, independent of estrogen receptors

Philipp Rühl et al. Sci Rep. .

Abstract

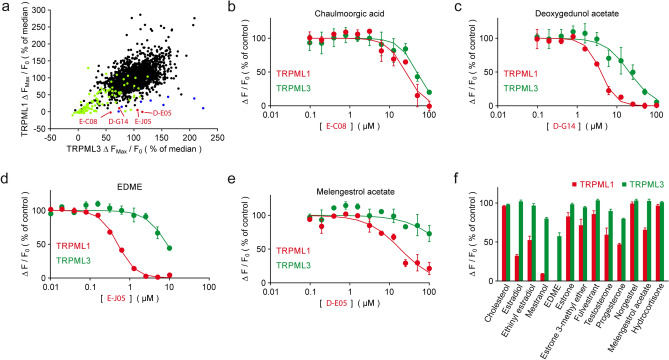
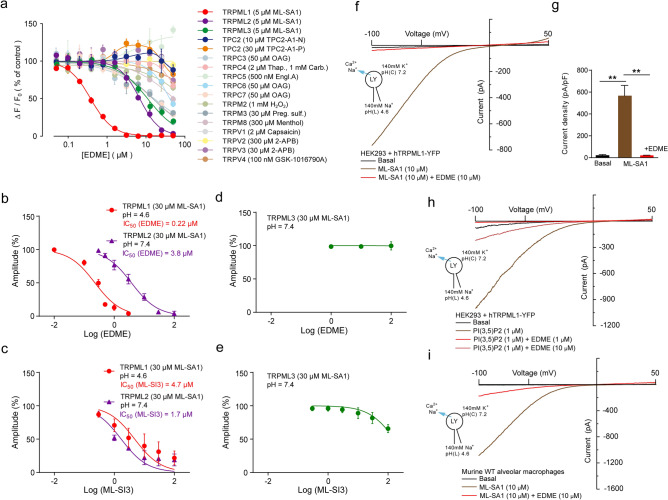
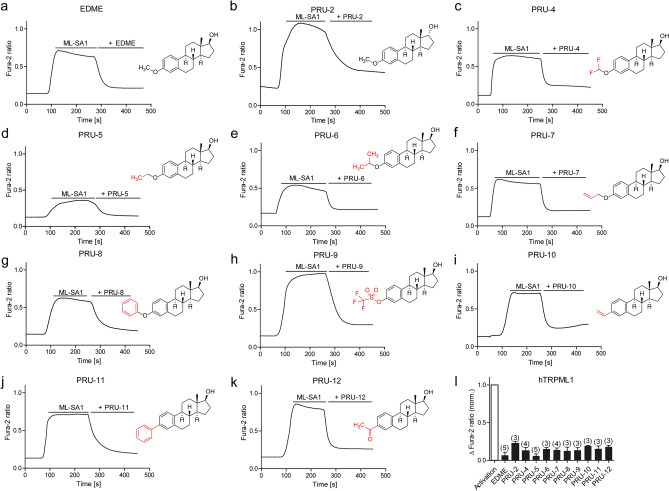
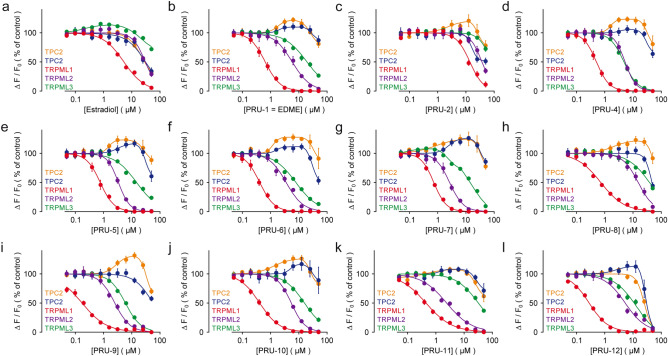
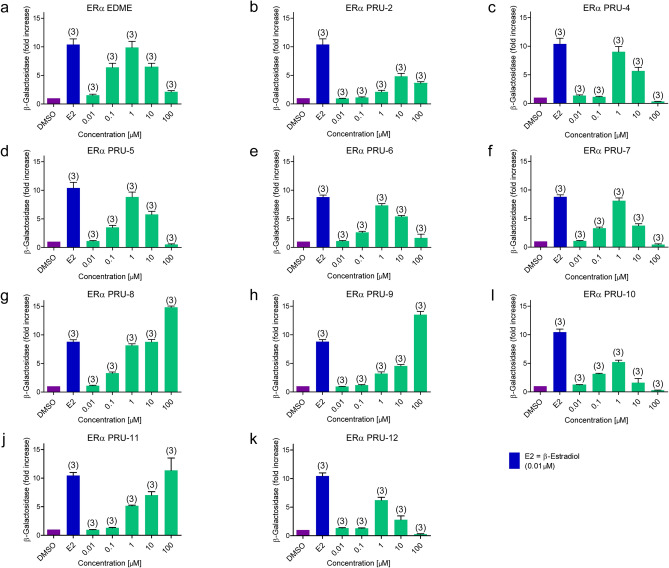
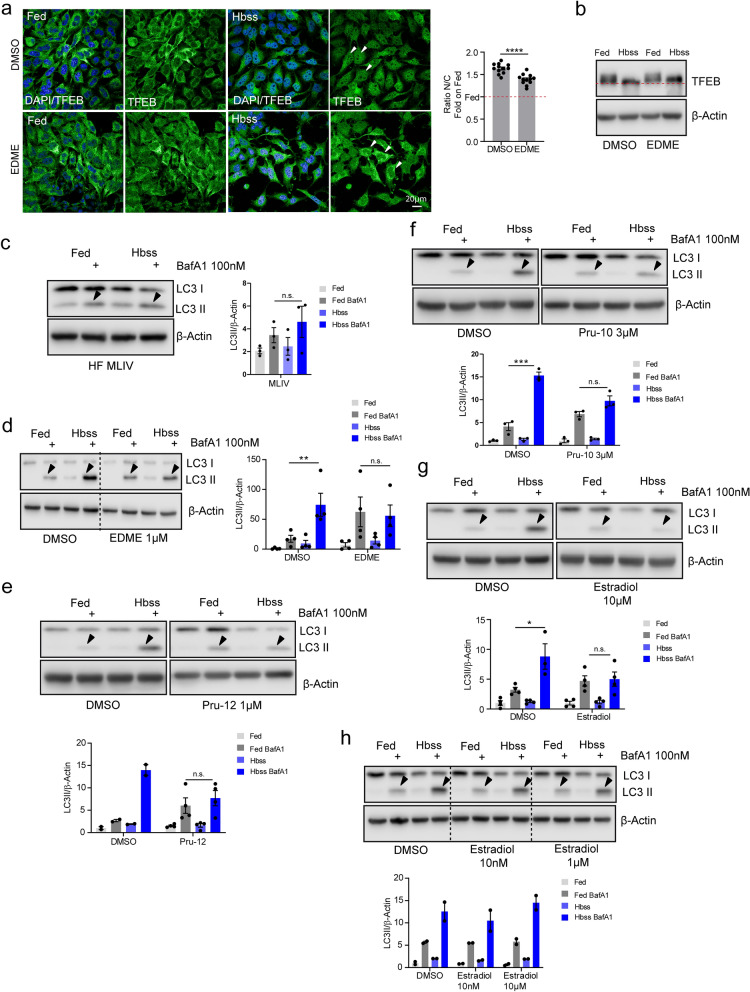
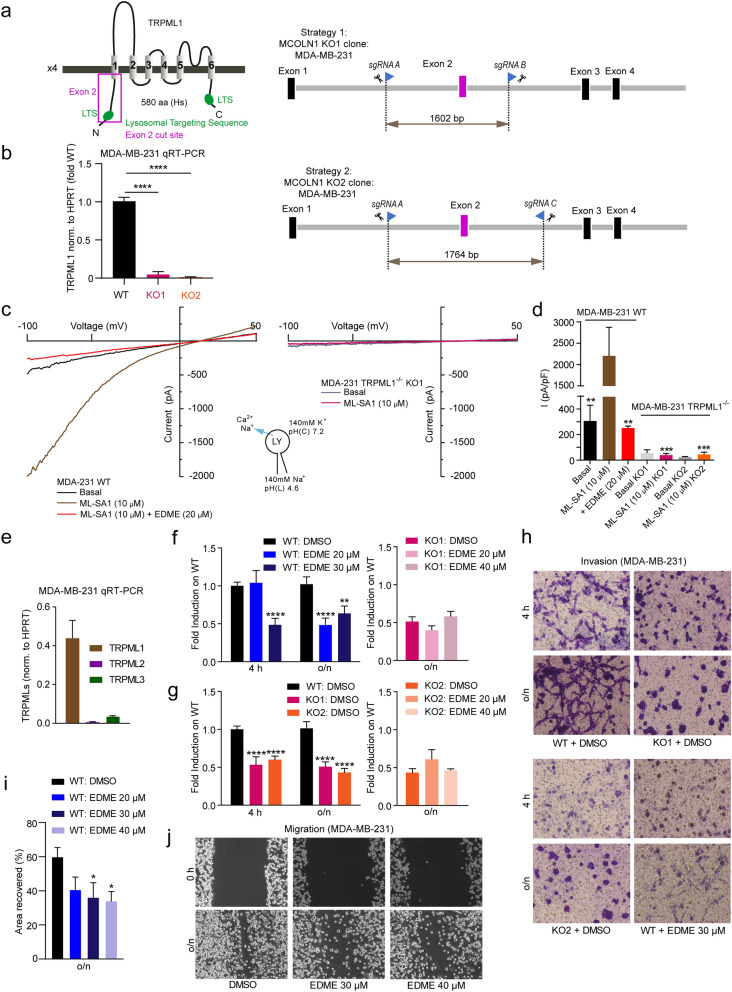
The cation channel TRPML1 is an important regulator of lysosomal function and autophagy. Loss of TRPML1 is associated with neurodegeneration and lysosomal storage disease, while temporary inhibition of this ion channel has been proposed to be beneficial in cancer therapy. Currently available TRPML1 channel inhibitors are not TRPML isoform selective and block at least two of the three human isoforms. We have now identified the first highly potent and isoform-selective TRPML1 antagonist, the steroid 17β-estradiol methyl ether (EDME). Two analogs of EDME, PRU-10 and PRU-12, characterized by their reduced activity at the estrogen receptor, have been identified through systematic chemical modification of the lead structure. EDME and its analogs, besides being promising new small molecule tool compounds for the investigation of TRPML1, selectively affect key features of TRPML1 function: autophagy induction and transcription factor EB (TFEB) translocation. In addition, they act as inhibitors of triple-negative breast cancer cell migration and invasion.


Conflict of interest statement

The authors declare no competing interests.

Figures

Figure 1
Figure 1
Compound screening and hit validation. (a) Dot plot showing the inhibitory effects of 2430 bioactive compounds (20 µM) on fluo4-loaded HEK293 cell lines stably expressing hTRPML1∆NC-YFP and hTRPML3-YFP after activation of the cells with 5 µM ML-SA1. Peak fluorescence intensities after stimulation were normalized to the median response in the respective screening plate. Black dots indicate compounds with no discernible effect on either TRPML1 or TRPML3. Green dots represent fluorescent compounds that were not further considered. Blue dots are notoriously positive hits previously identified in several other screened targets. Red dots indicate TRPML1-selective hits. (be) Representative concentration–response curves of the 4 specific hits in (A) for TRPML1 (red dots and lines) and TRPML3 (green dots and lines). (f) Effect of retested and pharmacologically relevant steroids on TRPML1 and TRPML3 at a concentration of 12.5 µM, which in the case of EDME completely blocks TRPML1. Shown is the inhibition of Fluo-4 fluorescence responses to stimulation with 5 µM ML-SA1 and normalization to an untreated control. Aggregated data sets from 3 to 5 independent experiments, each performed in duplicates, are displayed (means ± SEM).
Figure 2
Figure 2
EDME is a potent and selective blocker of TRPML1. (a) Representative concentration-effect relationships for Ca2+ increases (Fluo-4) in response to different concentrations of EDME on HEK293 cells stably expressing different TRP channels including hTRPML1∆NC, 2, 3, or TPC2, respectively. Corresponding activators for each TRP channel are listed in parentheses. (be) Concentration-effect relationships obtained from whole-cell patch-clamp measurements showing effect of EDME (b, d) and the previously described non-selective TRPML blocker ML-SI3 (c, e) on hTRPML1L15/16A, L577/578A (pH 4.6; n = 6, each), hTRPML2 (pH 7.4; n = 4, each), and hTRPML3 (pH 7.4; n = 3, each) in the presence of 30 µM ML-SA1. Current recording was done with WinWCP5.2.7 (University of Strathclyde, UK) software, and analysis was done with the help of a customized Igor pro program (WaveMetrics). (f) Endolysosomal patch-clamp experiment showing effect of EDME on WT hTRPML1 after activation with ML-SA1 (10 µM). (g) Statistical analysis for experiments as shown in (f) (luminal pH 4.6; n = 3, each). P-values were calculated by one-way ANOVA followed by Tukey’s post hoc test. **p-value < 0.01. (h) Endolysosomal patch-clamp experiment showing effect of EDME on WT hTRPML1 after activation with the endogenous ligand PI(3,5)P2 (1 µM). (i) Endolysosomal patch-clamp experiment showing effect of EDME (10 µM) on TRPML1 endogenously expressed in mouse alveolar macrophages after activation with ML-SA1 (10 µM). All endolysosomal patch-clamp experiments were analyzed using PatchMaster acquisition software (https://www.heka.com/) and OriginPro 6.1 (https://www.originlab.com/). All statistical analysis was done using GraphPadPrism software (https://www.graphpad.com/scientific-software/prism/).
Figure 3
Figure 3
EDME and analogs in Fura-2 single cell calcium imaging experiments. (ak) Representative Fura-2 calcium signals recorded from HEK293 cells stably expressing hTRPML1∆NC-YFP. Cells were stimulated with ML-SA1 (10 µM), then treated with EDME and analogs (10 µM, each). Characteristic structural motifs of the EDME analogs are highlighted in red in the structures. (l) Statistical analysis of the maximal change in Fura-2 ratio (mean ± SEM) with the number of independent experiments in parentheses (with 5–12 cells in each experiment). Data were normalized to the maximal effect of the agonist ML-SA1.
Figure 4
Figure 4
Estradiol, EDME and analogs in Fluo-4 calcium imaging experiments. (al) Concentration-effect relationships for Ca2+ increases (Fluo-4) in response to different concentrations of EDME, estradiol and analogs on HEK293 cells stably expressing hTRPML1∆NC-YFP, hTRPML2-YFP, hTRPML3-YFP or hTPC2L11A/L12A-RFP,. Cells were activated with ML-SA1 (5 µM) for TRPMLs or TPC2-A1-N (10 µM; blue) and TPC2-A1-P (30 µM; orange) for hTPC2. Data are calculated from 3 to 5 independent experiments, each, and represented as means ± SEM. IC50 values are presented in Table S1.
Figure 5
Figure 5
Activity at ERα of EDME and analogs. (ak) Shown are effects of EDME and analogs at the estrogen receptor alpha (ERα) in Saccharomyces cerevisiae stably transfected with ERα, with the number of independent experiments in parentheses. The weakest effects at ERα were found for PRU-2, PRU-10, and PRU-12.
Figure 6
Figure 6
Effect of EDME and selected analogs on autophagy and TFEB nuclear translocation. (a) Representative confocal images of endogenous TFEB in HeLa cells treated with DMSO and EDME (1 µM) in complete media (Fed) or Hbss (nutrient starved media). The plot represents the TFEB nuclear to cytosol ratio and values are expressed as fold induction on Fed. Values are means ± SEM of n = 300 cells per condition, pooled from two independent experiments. (b) Representative image of immunoblot analysis of endogenous TFEB in human fibroblasts treated with DMSO and EDME (1 µM) in Fed and Hbss. The red dashed line highlights TFEB molecular downshift. (c) Representative image of immunoblot analysis of endogenous LC3 in MLIV patients’ fibroblasts treated with Fed and Hbss alone or in the presence of BafA1 (bafilomycin A1). Plot shows the densitometry of LC3II band normalized to actin. The data in the graphs are mean values ± SEM, n = 3 lysates per condition pooled from 3 independent experiments. (dh) Representative image of immunoblot analysis of endogenous LC3 in human fibroblasts wild type treated with DMSO, EDME 1 µM, PRU-12 1 µM, PRU-10 3 µM and estradiol (10 µM, 1 µM, and 10 nM) in Fed and Hbss alone or in the presence of BafA1. Plot shows the densitometry of LC3II band normalized to actin. The data in the graphs are mean values ± SEM, n = 2–4 lysates per condition pooled from 2 to 4 independent experiments. P-values were calculated by two-tailed Student’s t-test. *p-value < 0.05; **p-value < 0.01. All statistical analysis was done using GraphPadPrism software (https://www.graphpad.com/scientific-software/prism/).
Figure 7
Figure 7
Effect of EDME on ER- breast cancer (MDA-MB-231) cell migration and invasion. (a) Genetic ablation of human MCOLN1 (TRPML1) in MDA-MB-231 cells was created by using two CRISPR/Cas9 strategies targeting Exon 2, resulting in KO1 and KO2. For further details see Methods section. Validation was performed by endolysosomal patch-clamp experimentation and by quantitative PCR analysis. (b) qRT-PCR results showing expression levels of TRPML1 in WT, KO1, and KO2 MDA-MB-231 cell lines. (c) Representative current densities measured from vacuolin-enlarged endo-lysosomes isolated from WT and KO1 MDA-MB-231 cells. (d) Statistical analysis for experiments as shown in c (n = 3, each). (e) qRT-PCR results showing expression levels of TRPML1, 2, and 3 in WT MDA-MB-231 cells. (fg) Invasion assay using transwell chambers. Statistical analysis of experiments as presented in (h) (n = 3, each). Statistical significance was determined by two-way ANOVA followed by Bonferroni multiple comparison test. **p-value < 0.01; ***p-value < 0.0001. (h) Shown are representative images for WT MDA-MB-231 cells and the two TRPML1−/− MDA-MB-231 cell lines KO1 and KO2 at 4 h and after o/n treatment, treated with either DMSO (control vehicle) or EDME at different concentrations. (i, j) Migration/wound healing scratch assay experiments. Shown in i is the statistical analysis of experiments as presented in (j) at various concentrations of EDME compared to DMSO (n = 3, each). Statistical significance was determined by one-way ANOVA followed by Bonferroni multiple comparison test. *p-value < 0.05. Shown in j are representative images for WT MDA-MB-231 cells at 0 h and after o/n incubation post scratch, treated with either the control vehicle (DMSO) or EDME at different concentrations. All statistical analysis was done using GraphPadPrism software (https://www.graphpad.com/scientific-software/prism/).

References

    1. Bargal R, Avidan N, Ben-Asher E, Olender Z, Zeigler M, Frumkin A, Raas-Rothschild A, Glusman G, Lancet D, Bach G. Identification of the gene causing mucolipidosis type IV. Nat. Genet. 2000;26:118–123. doi: 10.1038/79095. - DOI - PubMed
    1. Bae M, Patel N, Xu H, Lee M, Tominaga-Yamanaka K, Nath A, Geiger J, Gorospe M, Mattson MP, Haughey NJ. Activation of TRPML1 clears intraneuronal Abeta in preclinical models of HIV infection. J. Neurosci. 2014;34:11485–11503. doi: 10.1523/JNEUROSCI.0210-14.2014. - DOI - PMC - PubMed
    1. Tsunemi T, Perez-Rosello T, Ishiguro Y, Yoroisaka A, Jeon S, Hamada K, Rammonhan M, Wong YC, Xie Z, Akamatsu W, et al. Increased lysosomal exocytosis induced by lysosomal Ca(2+) channel agonists protects human dopaminergic neurons from alpha-synuclein toxicity. J. Neurosci. 2019;39:5760–5772. doi: 10.1523/JNEUROSCI.3085-18.2019. - DOI - PMC - PubMed
    1. Cheng X, Zhang X, Gao Q, Ali Samie M, Azar M, Tsang WL, Dong L, Sahoo N, Li X, Zhuo Y, et al. The intracellular Ca(2)(+) channel MCOLN1 is required for sarcolemma repair to prevent muscular dystrophy. Nat. Med. 2014;20:1187–1192. doi: 10.1038/nm.3611. - DOI - PMC - PubMed
    1. Yu L, Zhang X, Yang Y, Li D, Tang K, Zhao Z, He W, Wang C, Sahoo N, Converso-Baran K, et al. Small-molecule activation of lysosomal TRP channels ameliorates Duchenne muscular dystrophy in mouse models. Sci. Adv. 2020;6:e2736. doi: 10.1126/sciadv.aaz2736. - DOI - PMC - PubMed

Publication types

MeSH terms

Substances

LinkOut - more resources