. 2021 Apr;5(4):360-376.
doi: 10.1038/s41551-021-00703-2. Epub 2021 Apr 15.

Converging genetic and epigenetic drivers of paediatric acute lymphoblastic leukaemia identified by an information-theoretic analysis

Affiliations

Converging genetic and epigenetic drivers of paediatric acute lymphoblastic leukaemia identified by an information-theoretic analysis

Michael A Koldobskiy et al. Nat Biomed Eng. 2021 Apr.

Abstract

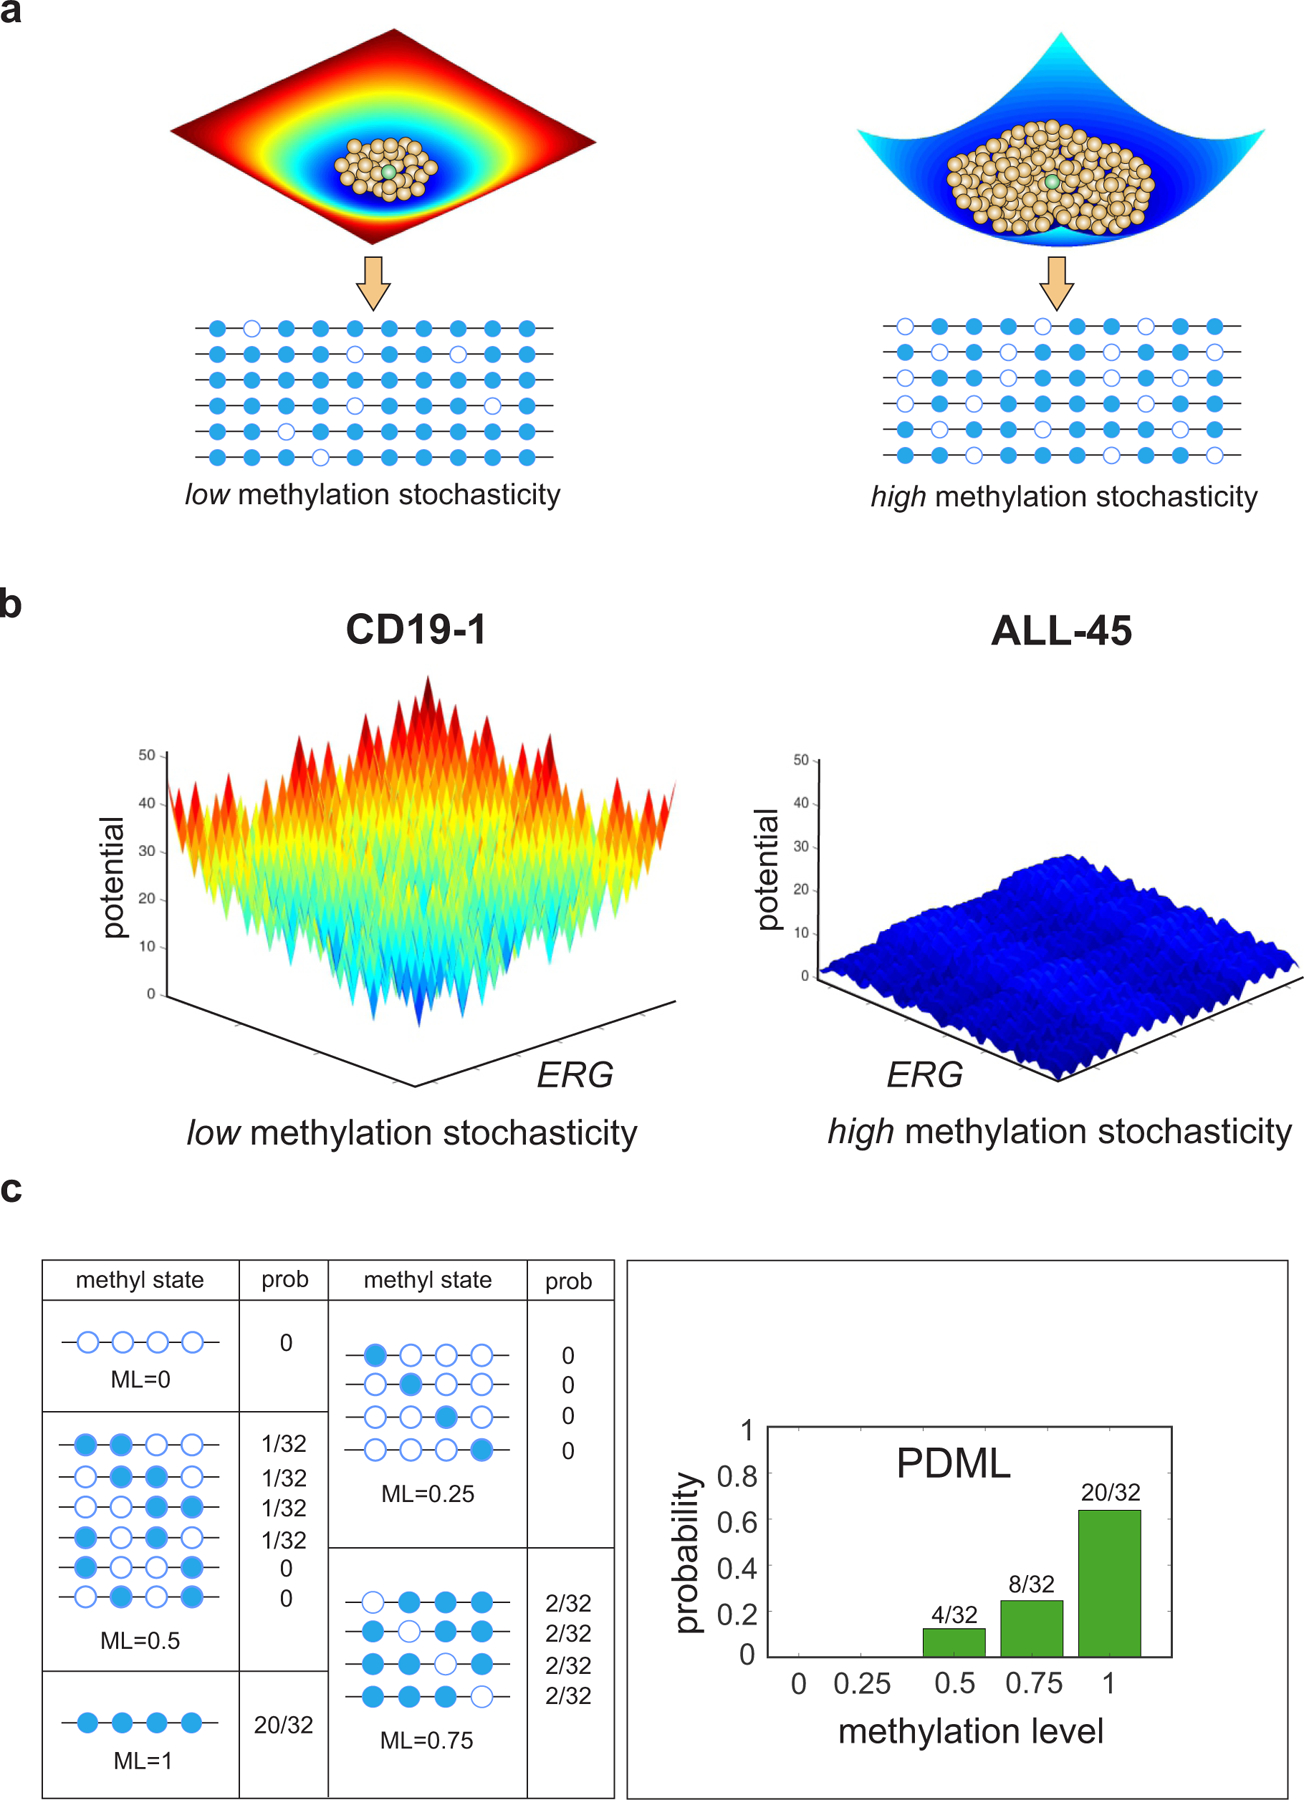
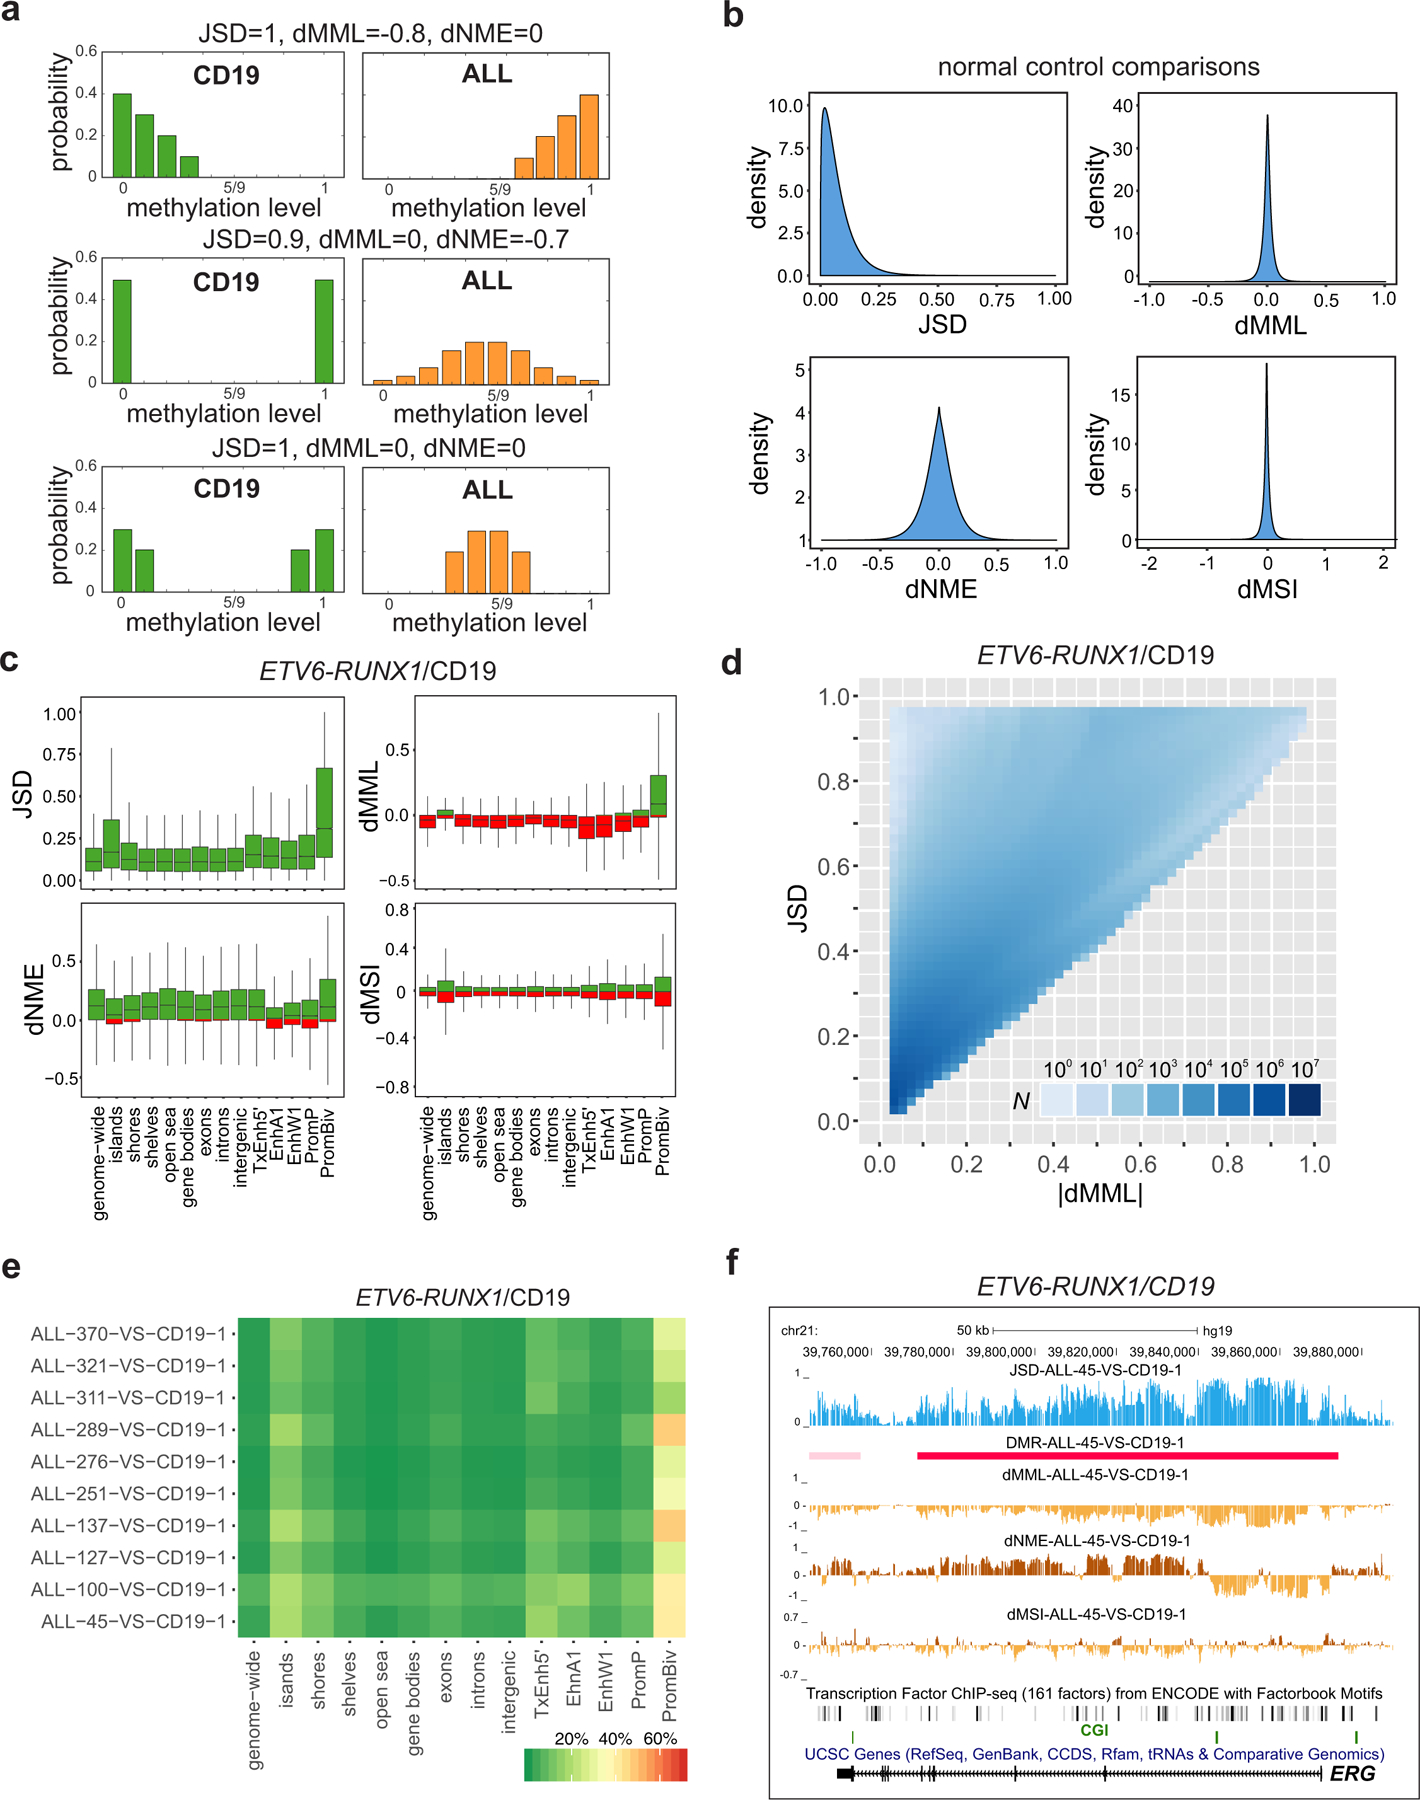
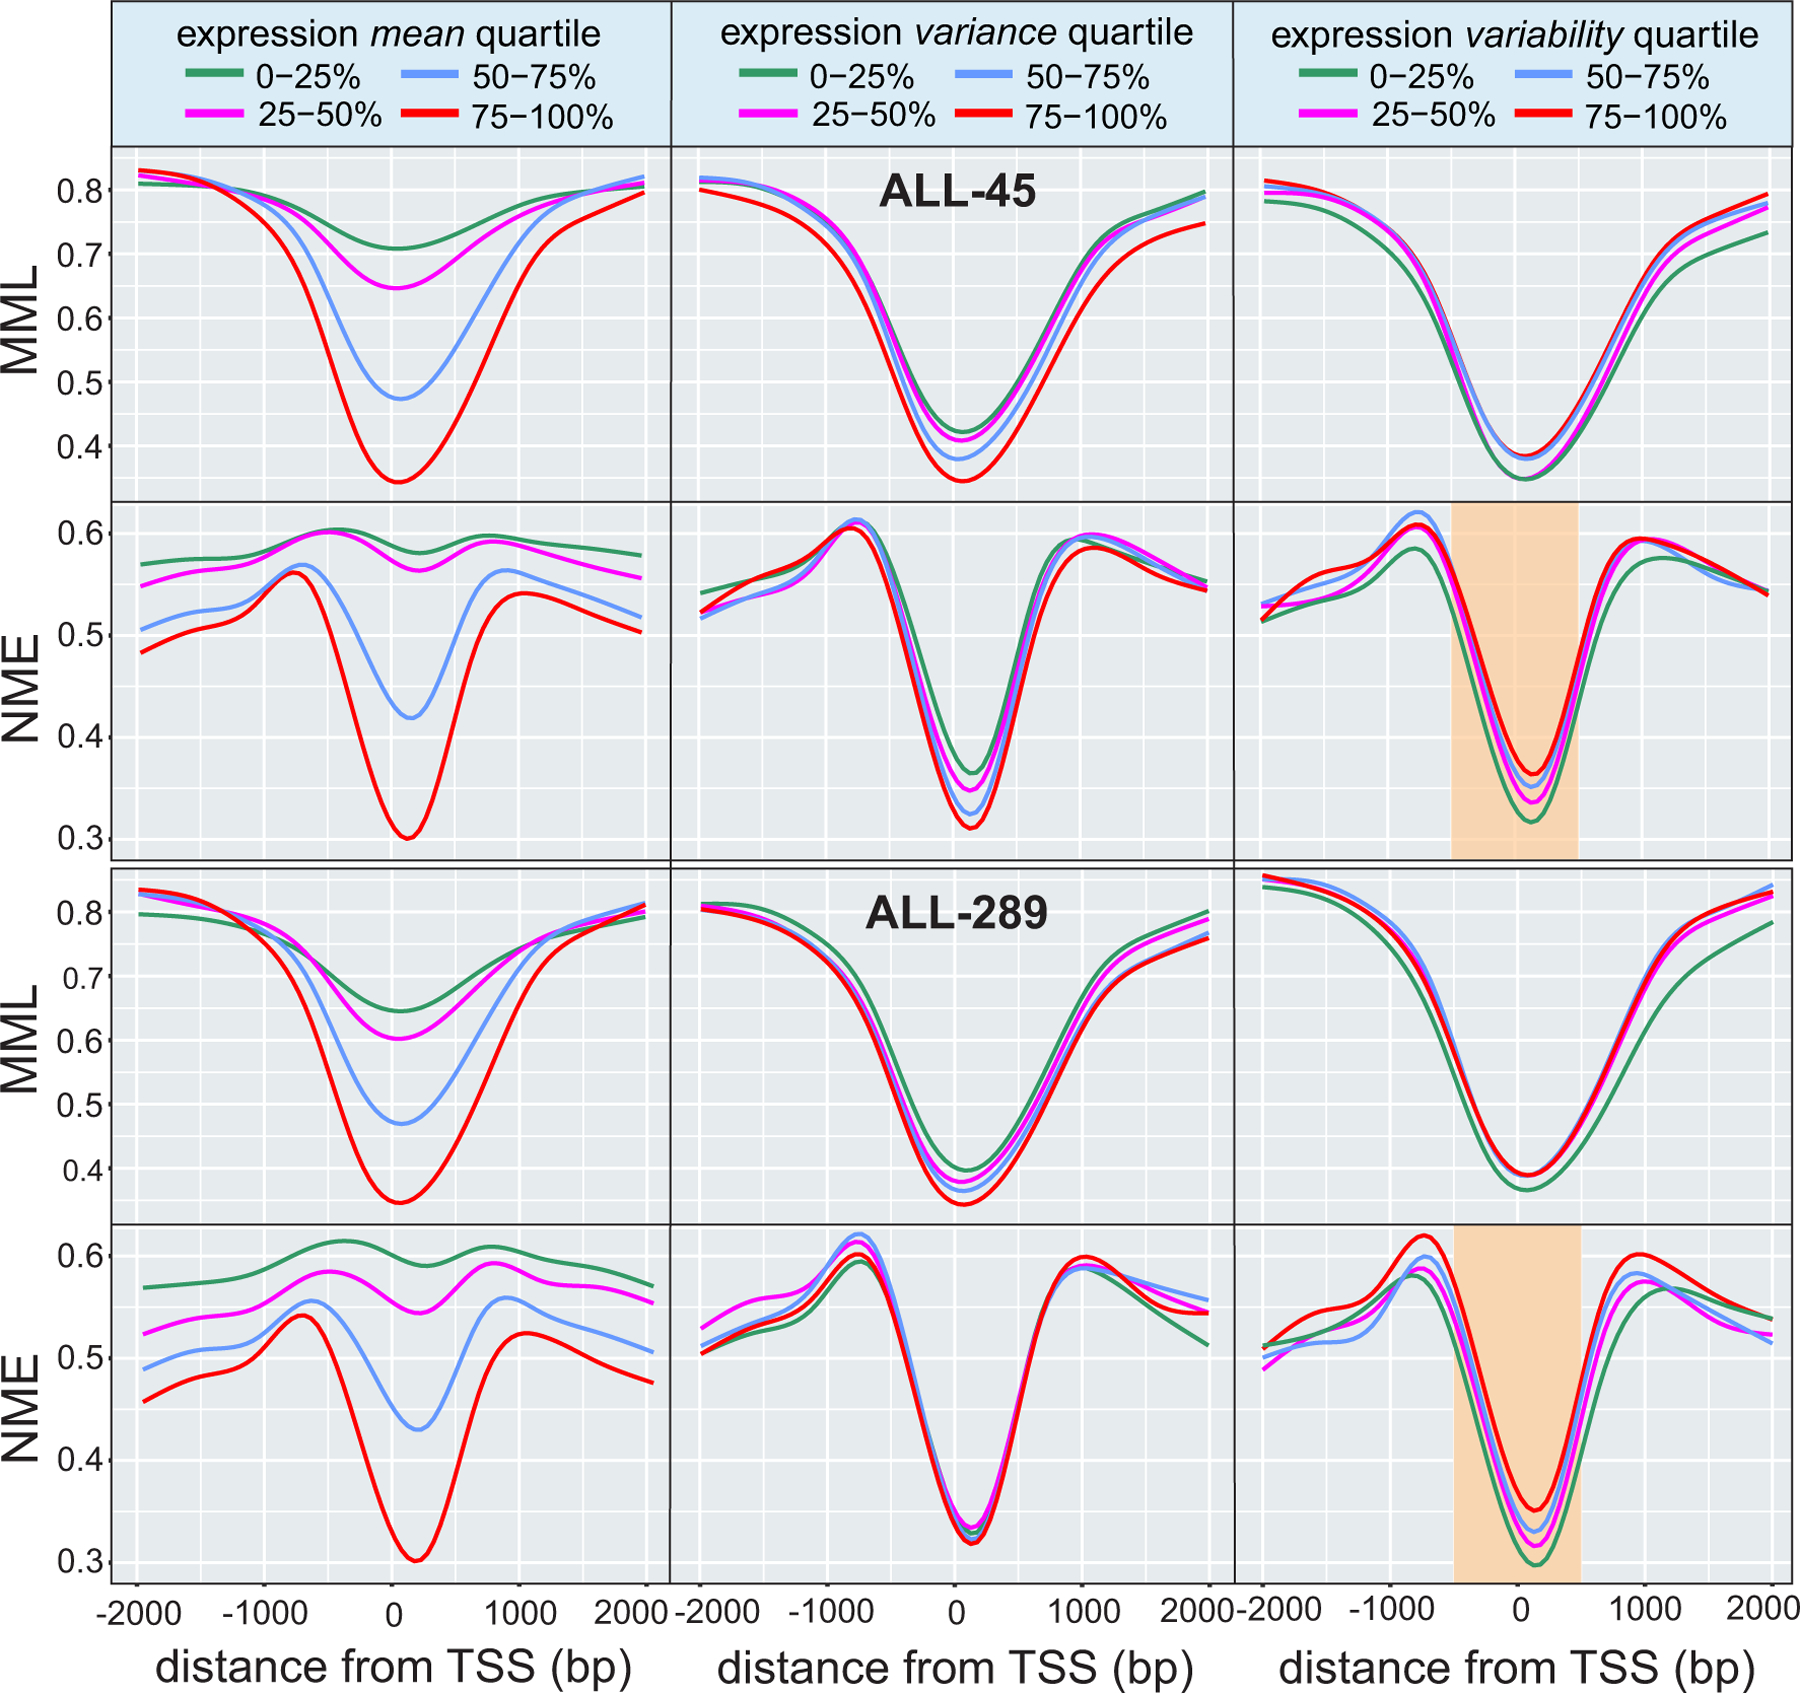
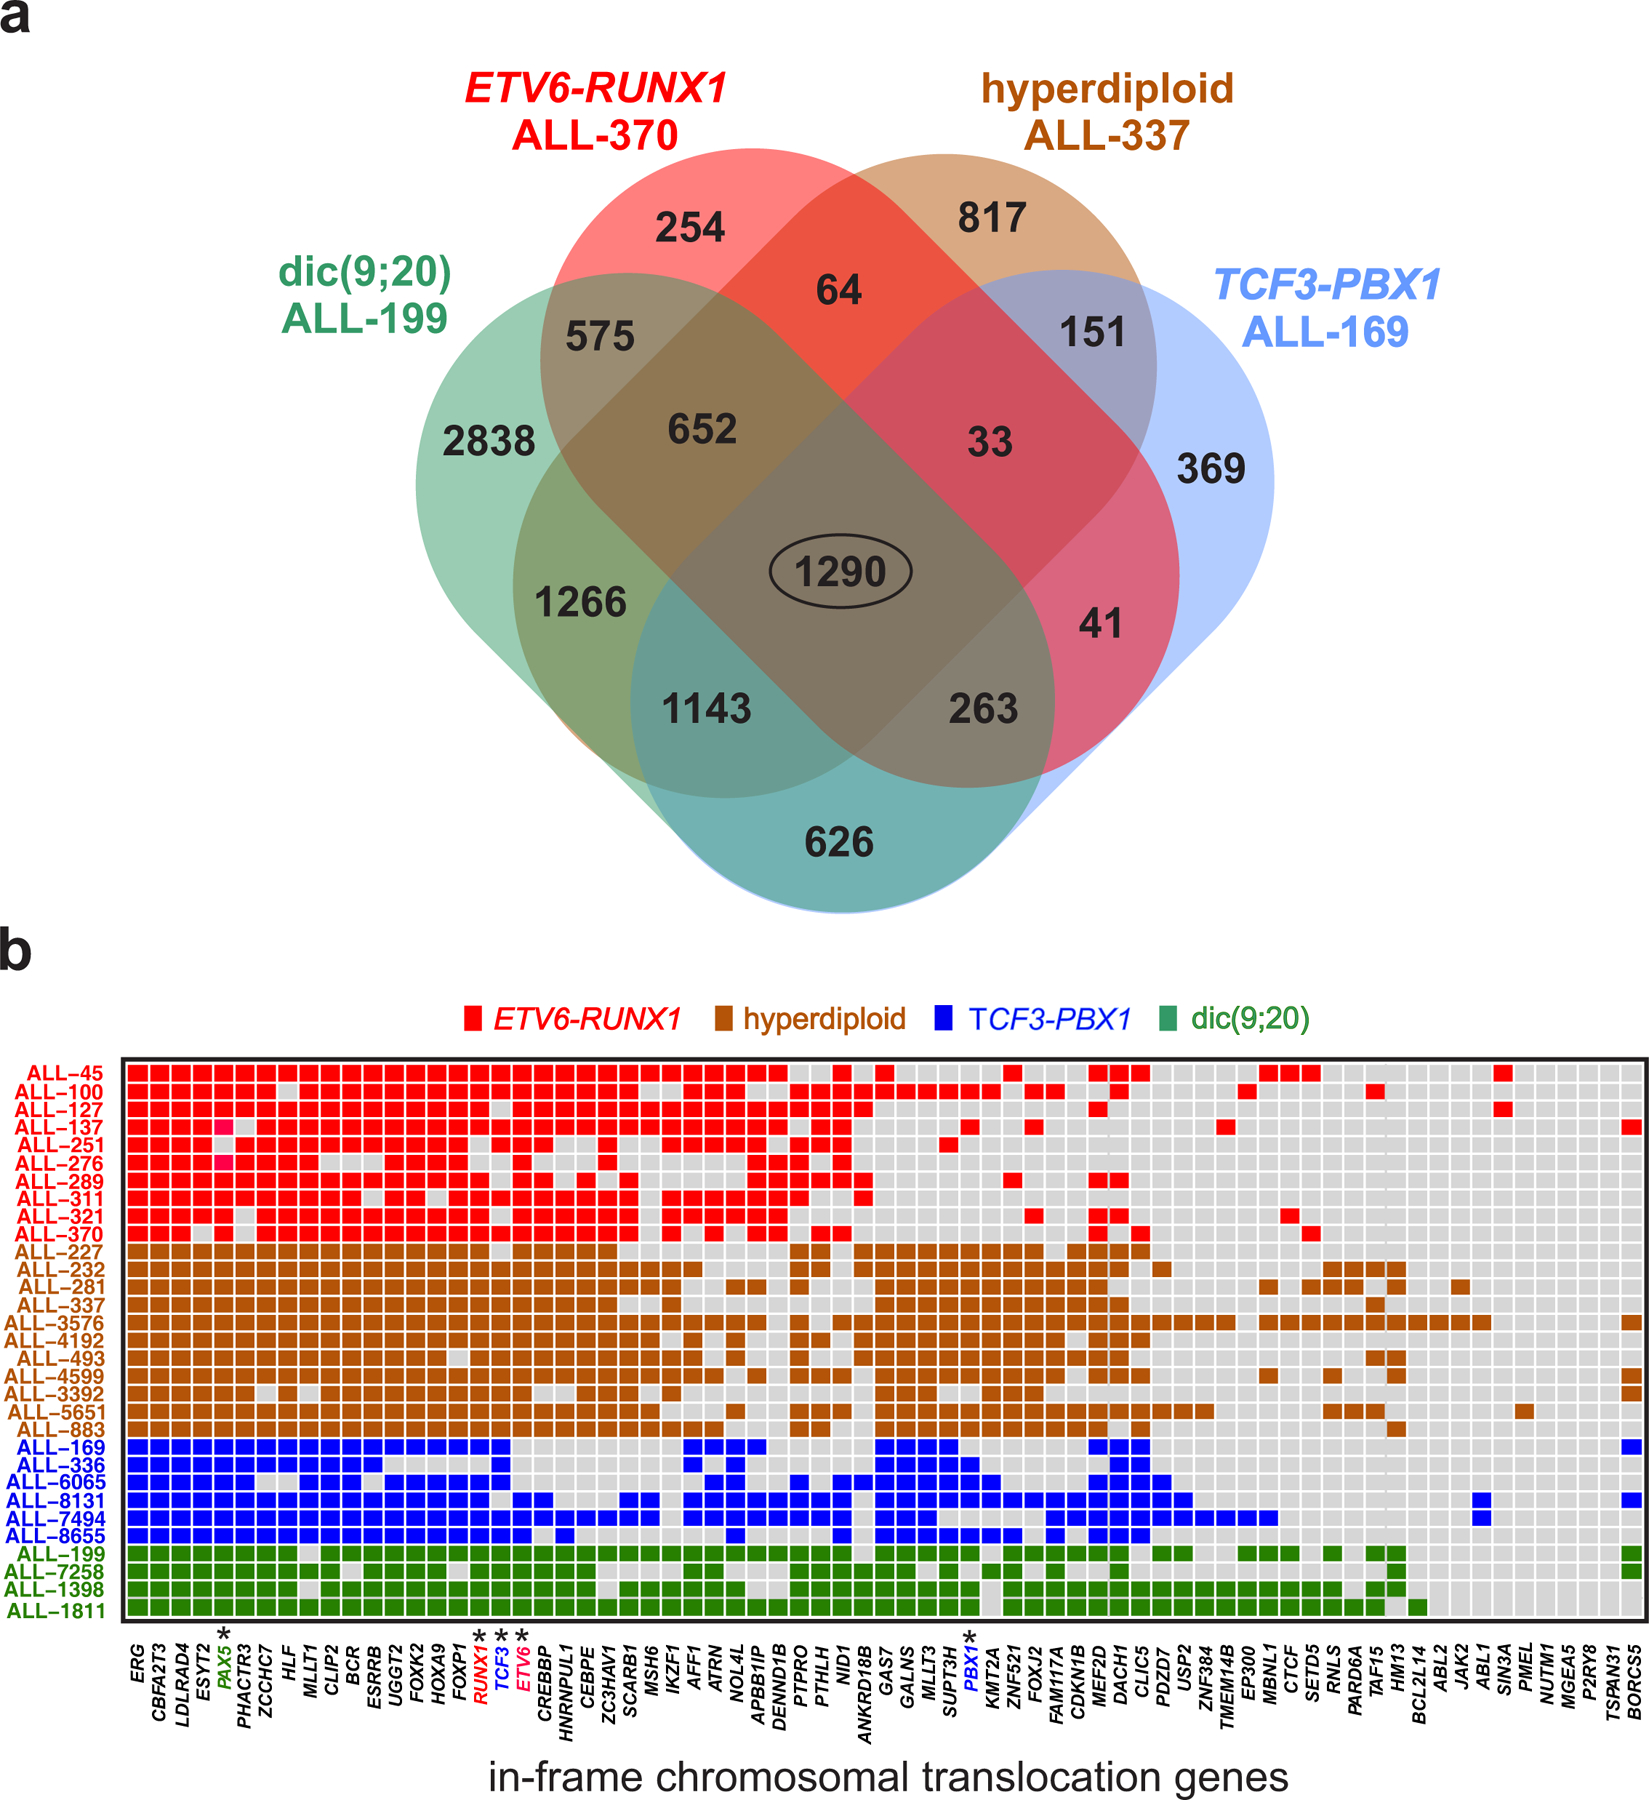
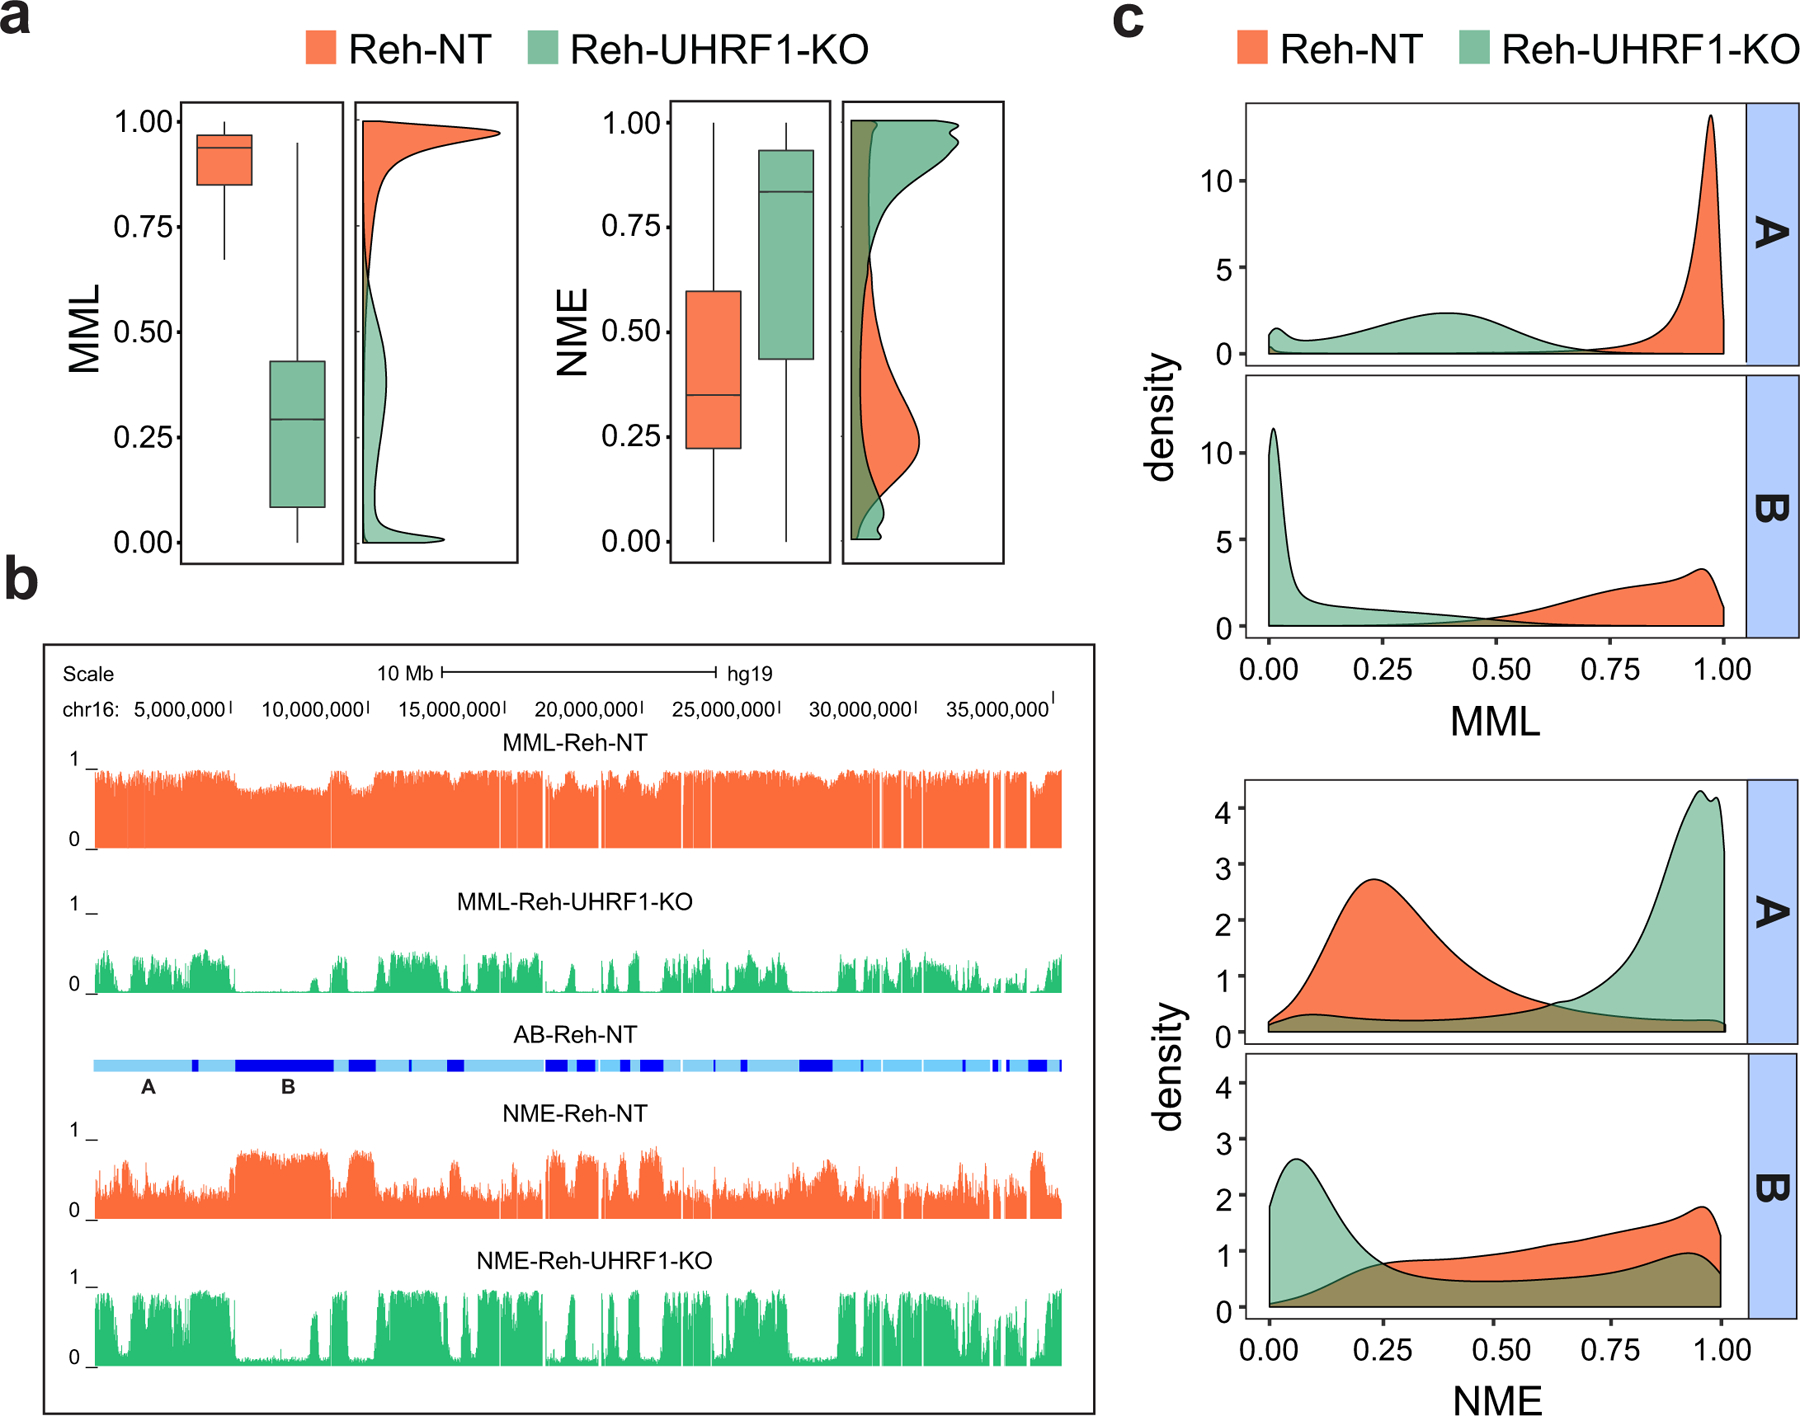
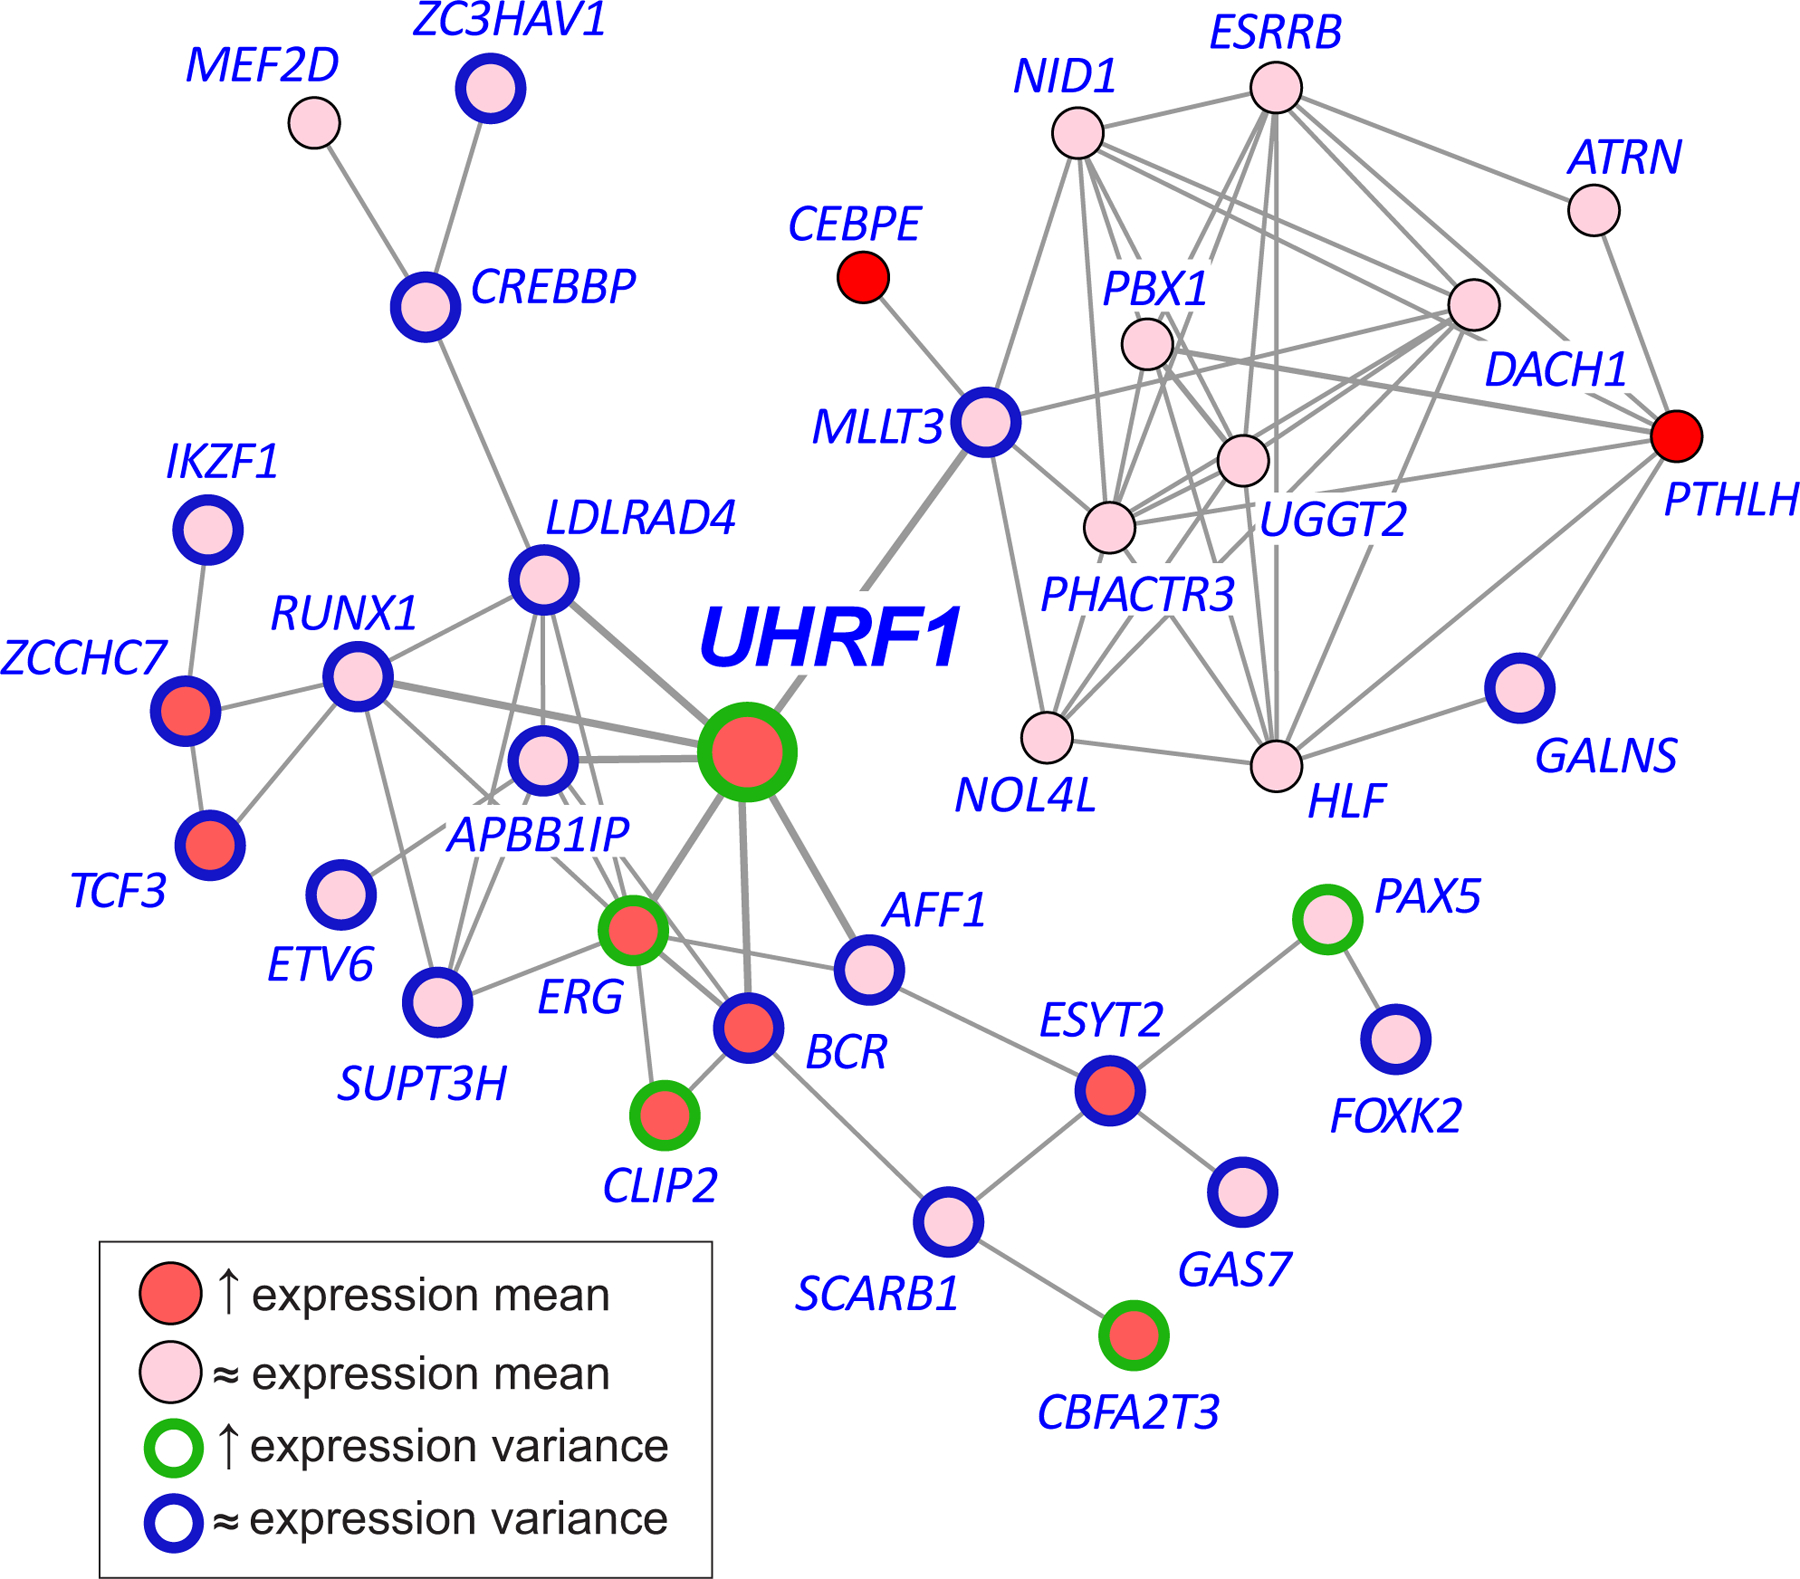
In cancer, linking epigenetic alterations to drivers of transformation has been difficult, in part because DNA methylation analyses must capture epigenetic variability, which is central to tumour heterogeneity and tumour plasticity. Here, by conducting a comprehensive analysis, based on information theory, of differences in methylation stochasticity in samples from patients with paediatric acute lymphoblastic leukaemia (ALL), we show that ALL epigenomes are stochastic and marked by increased methylation entropy at specific regulatory regions and genes. By integrating DNA methylation and single-cell gene-expression data, we arrived at a relationship between methylation entropy and gene-expression variability, and found that epigenetic changes in ALL converge on a shared set of genes that overlap with genetic drivers involved in chromosomal translocations across the disease spectrum. Our findings suggest that an epigenetically driven gene-regulation network, with UHRF1 (ubiquitin-like with PHD and RING finger domains 1) as a central node, links genetic drivers and epigenetic mediators in ALL.


Conflict of interest statement

Competing interests

The authors declare no competing interests.

Figures

Fig. 1 |
Fig. 1 |. Potential energy landscapes explain DNA methylation stochasticity in normal and cancer cells.
a, Illustration of potential energy landscapes. Each methylation pattern (brown balls) is assigned a potential value that provides a measure of its improbability to be observed relative to the most probable pattern (green ball), which is assigned zero potential. A deep and narrow ‘potential well’ indicates low methylation stochasticity in a cell population (left), whereas a shallow and wide ‘potential well’ points to high methylation stochasticity (right). b, Potential energy landscapes associated with twelve contiguous CpG sites within ERG [chr21: 39,830,065 – 39,830,570] demonstrate increased methylation stochasticity for ERG in ALL, in agreement with observed WGBS data (Supplementary Fig. 2). Here the methylation patterns are assigned to points in a two-dimensional state-space using Gray’s code (Methods). c, Within an analysis region, methylation patterns are grouped in terms of their methylation level (ML). The probability distribution of the methylation level (PDML) is then evaluated by summing the probabilities associated with the methylation patterns within each group. The depicted probability distribution points to an analysis region that is most likely methylated.
Fig. 2 |
Fig. 2 |. Differential analysis localizes methylation discordance in ALL.
a, The Jensen-Shannon distance (JSD) captures methylation discordance within an analysis region by evaluating differences in the location and shape of the probability distributions of the methylation levels associated with a test (ALL) and a reference (CD19/pre-B2) sample. Methylation discordance can be due to a difference in mean methylation level (dMML – top row), in normalized methylation entropy (dNME – middle row), or due to other statistical factors (bottom row). b, Densities of JSD, dMML, and dNME, as well as of differences in the values of the methylation sensitivity index (dMSI), when comparing all normal CD19 and pre-B2 samples, show relatively small discordances associated with biological, statistical, and technical variability in these samples. c, Distributions of JSD, dMML, dNME, and dMSI values genome-wide and within selected genomic features in an ETV6-RUNX1/CD19 comparison (ALL-45 vs. CD19–1). Green, positive values; red, negative values; center lines, median; boxes, interquartile range (IQR); whiskers, 1.5 × IRQ. d, Distribution of the number N of analysis regions with respect to their JSD and absolute dMML values, computed from all ETV6-RUNX1/CD19–1 comparisons genome-wide. Many analysis regions that exhibit similar absolute differences in mean methylation level are associated with a wide range of Jensen-Shannon distance values demonstrating that the mean methylation level is not the only statistical factor influencing methylation discordance in ALL. e, Percentage of analysis regions with significant methylation discordance within selected genomic features when comparing ETV6-RUNX1 ALL with CD19. f, UCSC genome browser images of a chromosomal region associated with ERG exhibiting significant Jensen-Shannon distance values in an ETV6-RUNX1/CD19 comparison (ALL-45 vs. CD19–1), and thus being significantly informative of the phenotype. This region exhibits consistent reduction in mean methylation level and loss in methylation sensitivity, but localized gain or loss in normalized methylation entropy.
Fig. 3 |
Fig. 3 |. DNA methylation stochasticity relates to gene expression in ETV6-RUNX1 ALL.
Average relationships in ETV6-RUNX1 ALL between mean methylation level (MML) and normalized methylation entropy (NME) within gene promoters as a function of distance from the transcription start site (TSS). The results correspond to quartiles of gene expression mean (left column), variance (middle column), and variability level (right column). Lower mean expression associates with higher levels of mean methylation (left column, first and third rows), confirming a known relationship between promoter methylation and gene expression. However, lower levels of mean expression are associated with higher levels of normalized methylation entropy (left column, second and fourth rows) implying that promoters of genes with lower gene expression are associated with higher levels of methylation stochasticity. Higher expression variance also relates to reduced levels of mean methylation level and normalized methylation entropy, but these associations can be weak (center column). Although a measure of expression variability (Methods) does not clearly associate with mean methylation level (right column, first and third rows), it relates to normalized methylation entropy, with higher entropy near the TSS being identified with statistically significant gains in expression variability (right column, second and fourth rows - highlighted: two-sided Wilcoxon rank sum test on medians within [500 bp,500 bp] from the TSS, P-values <0.001 for second vs. first quartile, third vs. second quartile, and fourth vs. third quartile). This implies that promoter regions of genes with higher expression variability exhibit higher levels of methylation stochasticity near the TSS.
Fig. 4 |
Fig. 4 |. Methylation discordance and four cytogenetic subtypes of ALL.
a, Numbers of differentially methylated genes (DMGs) common to four groups of cytogenetic subtypes of ALL as indicated. The corresponding genes are listed in Supplementary Table 10a. b, Differentially methylated regions detected in individual samples (rows) identify in-frame chromosomal translocation genes in ALL exhibiting significant methylation discordance (columns). Colors indicate the underlying cytogenetic abnormality for each sample as well as the genes involved in a sample-specific translocation. Marked columns (*) pinpoint to genes undergoing chromosomal translocation in a specific cytogenetic abnormality.
Fig. 5 |
Fig. 5 |. UHRF1 is a target of epigenetic disruption in ALL.
a, Boxplots and densities of genome-wide distributions of mean methylation level (MML) and normalized methylation entropy (NME) values in NT and UHRF1-KO WGBS samples show that UHRF1 silencing results in profound global hypomethylation and marked gain in normalized methylation entropy. Center lines, median; boxes, interquartile range (IQR); whiskers, 1.5 × IRQ. b, UCSC genome browser example showing that chromosome 16 exhibits profound hypomethylation and marked gain in normalized methylation entropy in UHRF1-KO Reh cells over NT associated euchromatic A domains (light blue), as well as almost zero mean methylation level and profound loss in normalized methylation entropy over heterochromatic B domains and over several genomic regions within A domains (dark blue). c, Densities of mean methylation level and normalized methylation entropy within NT associated A/B domains confirm the previous findings genome-wide.
Fig. 6 |
Fig. 6 |. A plausible regulatory relationship between UHRF1 and 34 in-frame translocation genes identified in ETV6-RUNX1 ALL.
An information-theoretic analysis of single-cell RNA sequencing data identifies a network relationship between UHRF1 and 34 translocation genes driving significant and targeted expression discordance of genetic drivers in ALL. In this network, UHRF1 may play the most influential role as compared to other genes in the network. Red, overexpression; brown, upregulated expression variance; blue, no change in expression variance.

Similar articles

Cited by

References

    1. Mullighan CG The molecular genetic makeup of acute lymphoblastic leukemia. Hematology Am Soc Hematol Educ Program 2012, 389–96 (2012). - PubMed
    1. Hunger SP & Mullighan CG Acute lymphoblastic leukemia in children. N Engl J Med 373, 1541–52 (2015). - PubMed
    1. Grobner SN et al.The landscape of genomic alterations across childhood cancers. Nature 555, 321–327 (2018). - PubMed
    1. Ma X et al.Pan-cancer genome and transcriptome analyses of 1,699 paediatric leukaemias and solid tumours. Nature 555, 371–376 (2018). - PMC - PubMed
    1. Kulis M et al.Whole-genome fingerprint of the DNA methylome during human B cell differentiation. Nat Genet 47, 746–56 (2015). - PMC - PubMed

Publication types

Substances