. 2021 Aug;39(8):989-999.
doi: 10.1038/s41587-021-00894-8. Epub 2021 Apr 15.

Generation of recombinant hyperimmune globulins from diverse B-cell repertoires

Affiliations

Generation of recombinant hyperimmune globulins from diverse B-cell repertoires

Sheila M Keating et al. Nat Biotechnol. 2021 Aug.

Abstract

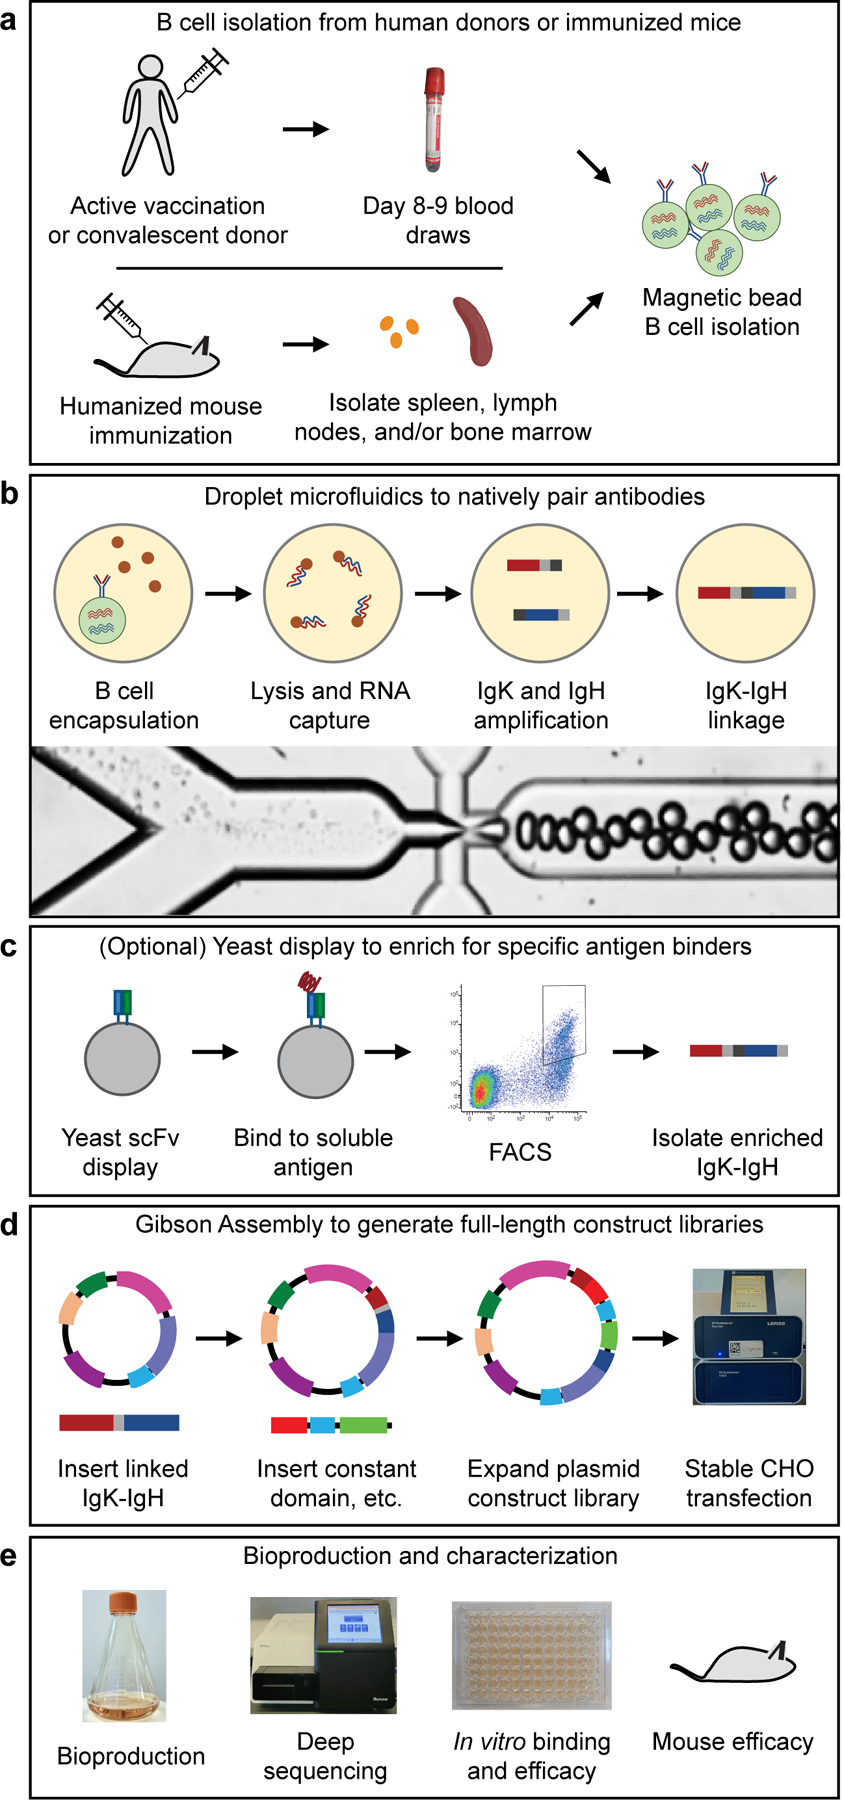
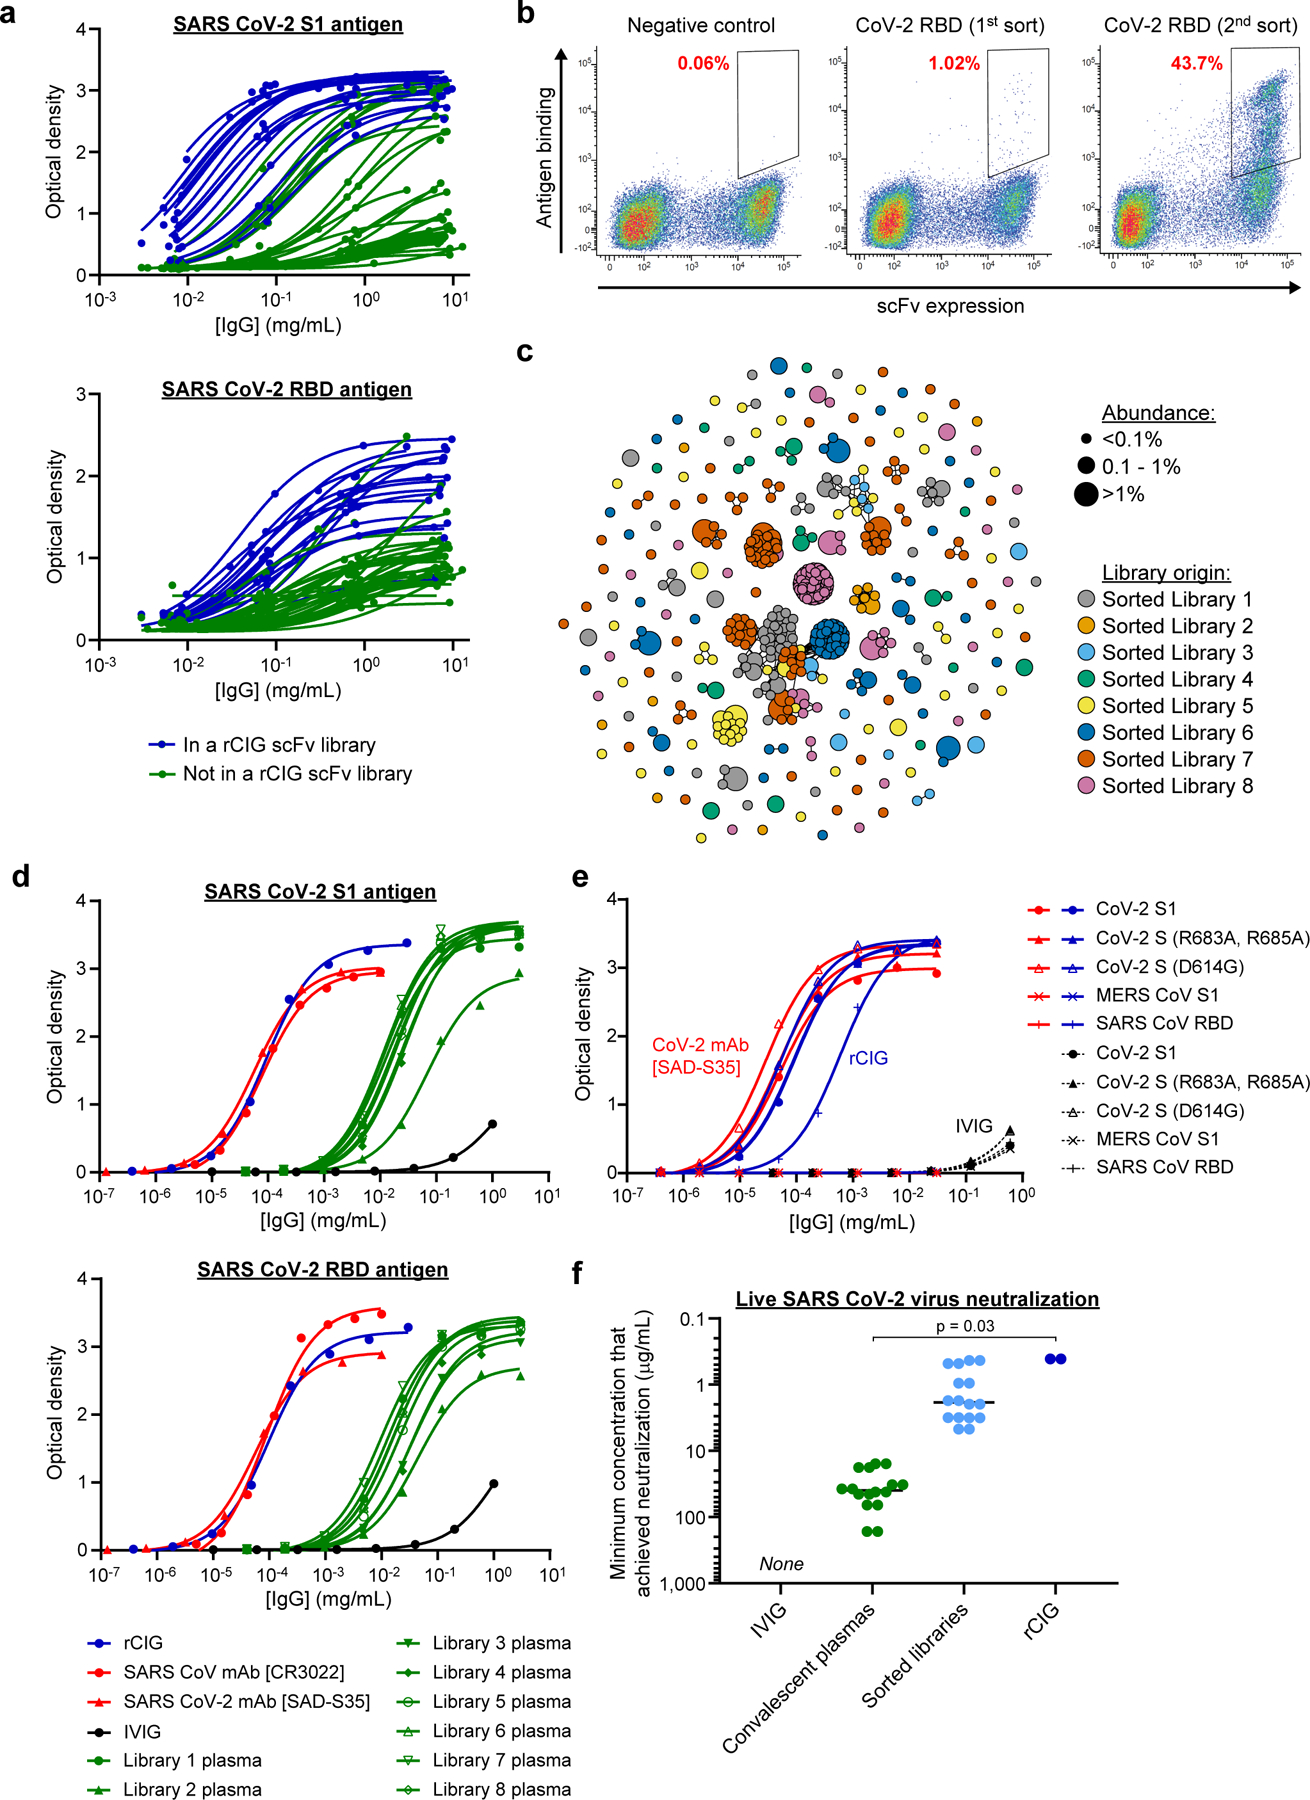
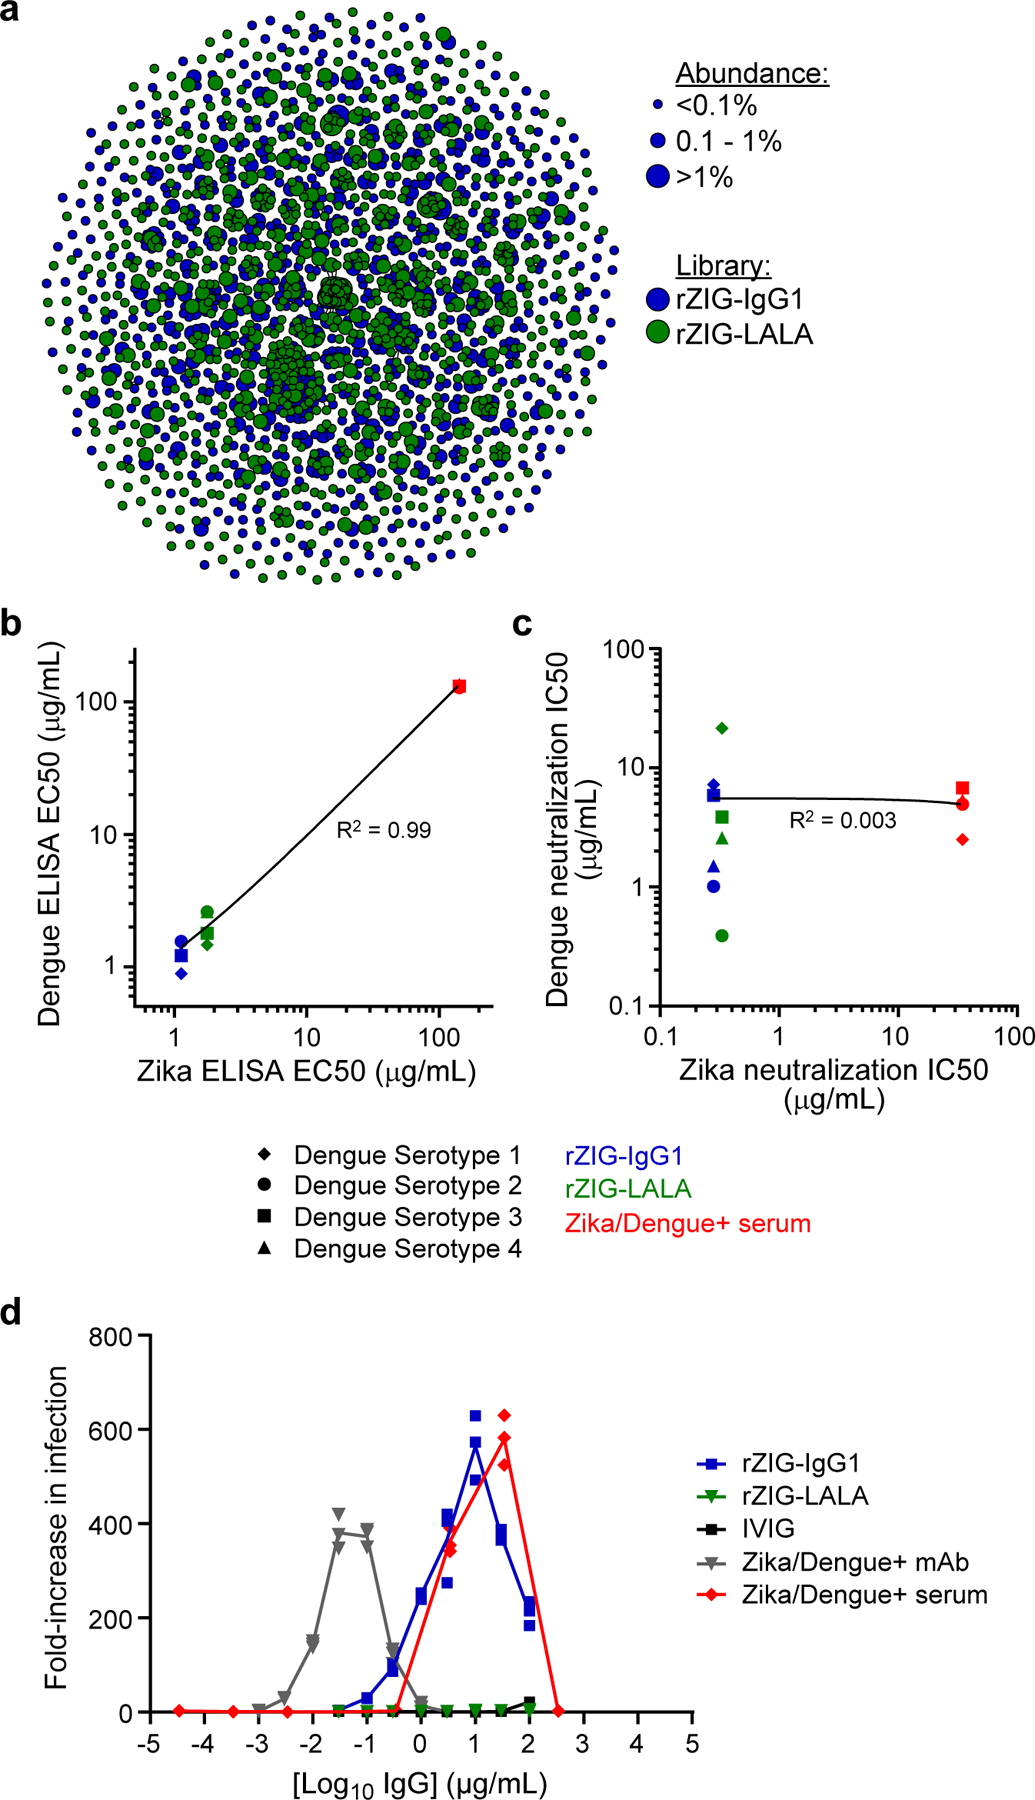
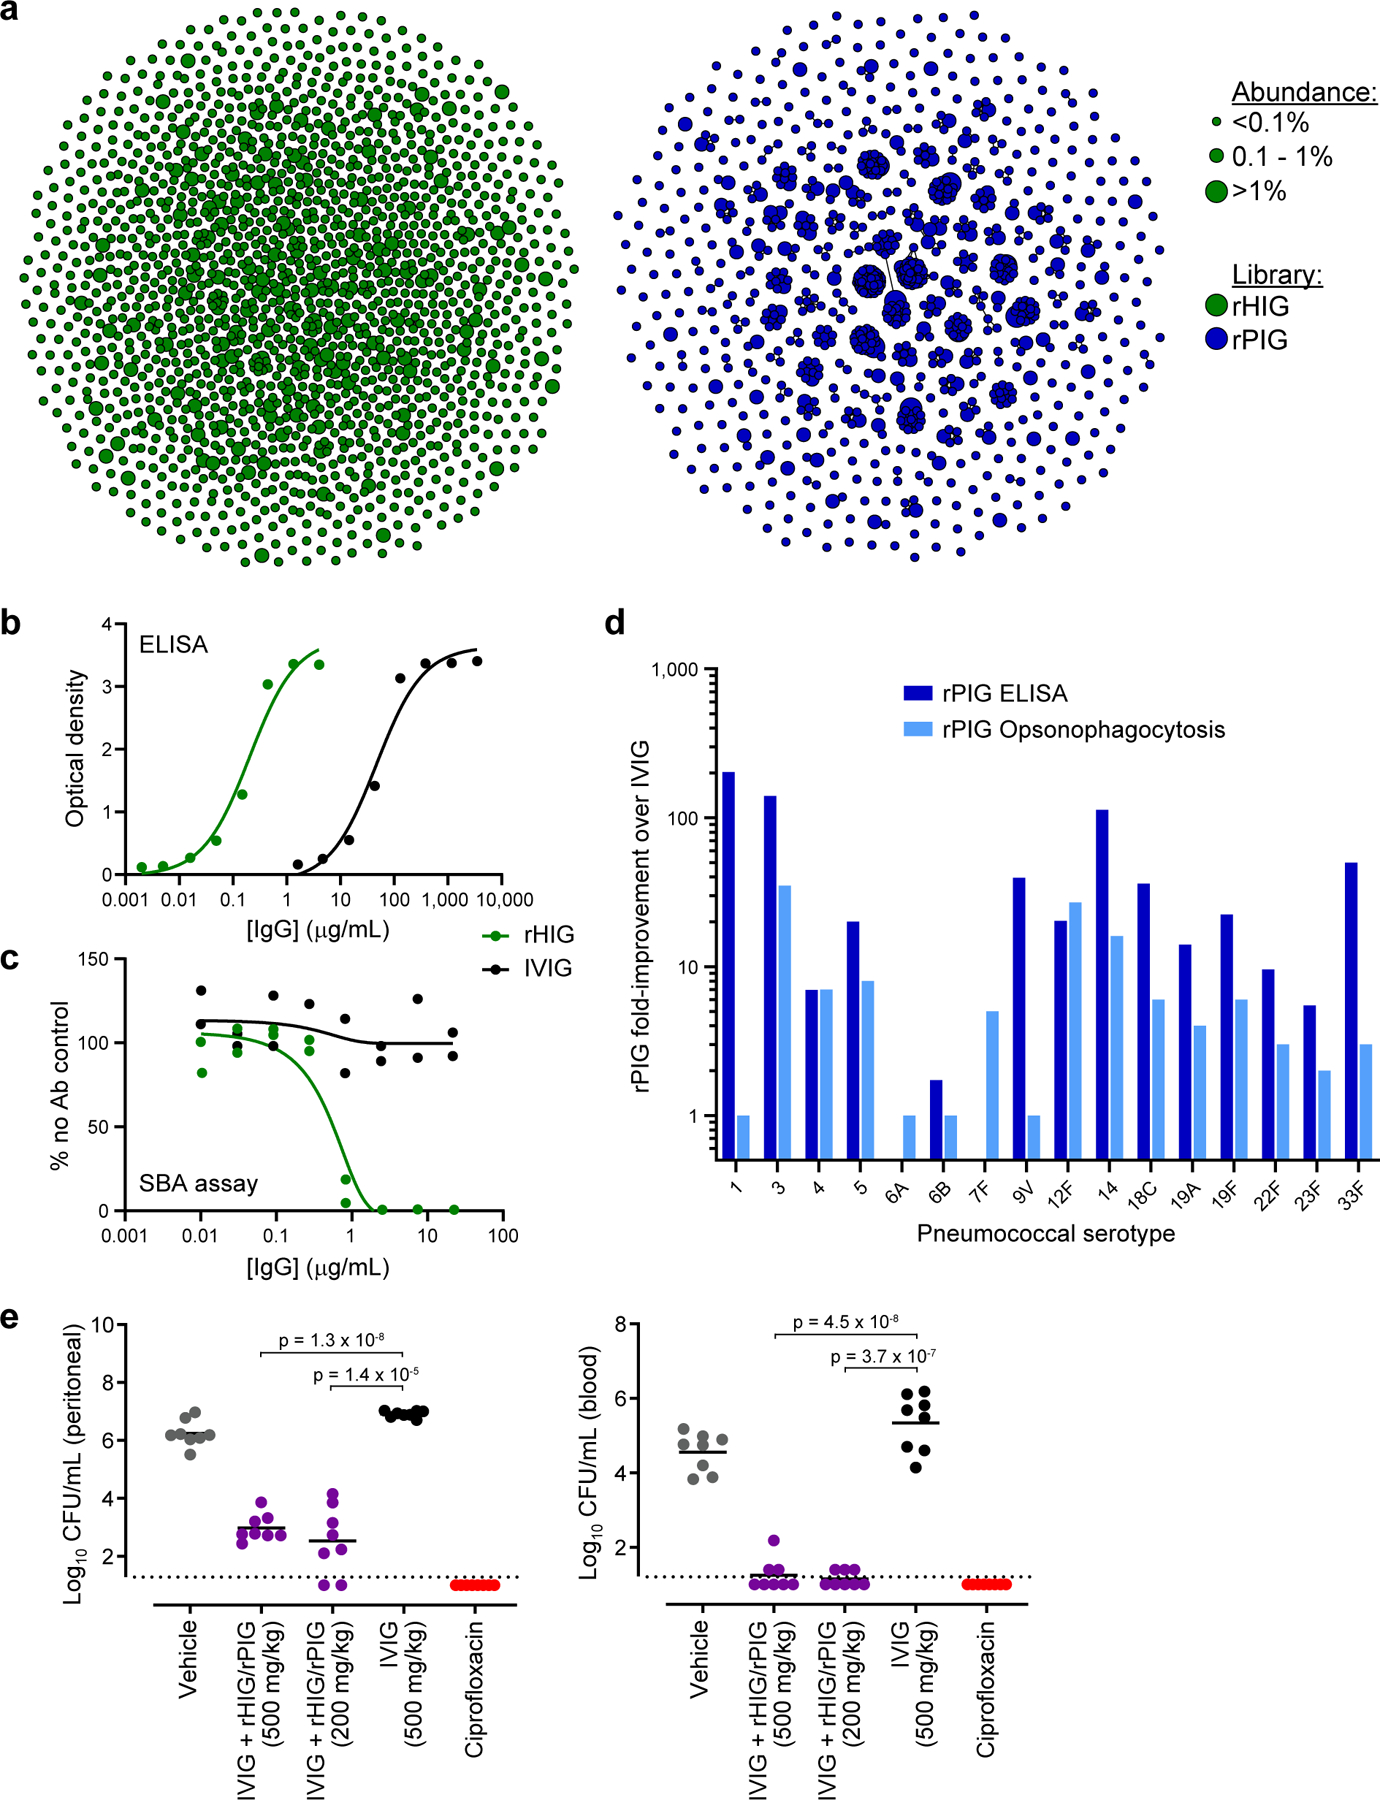
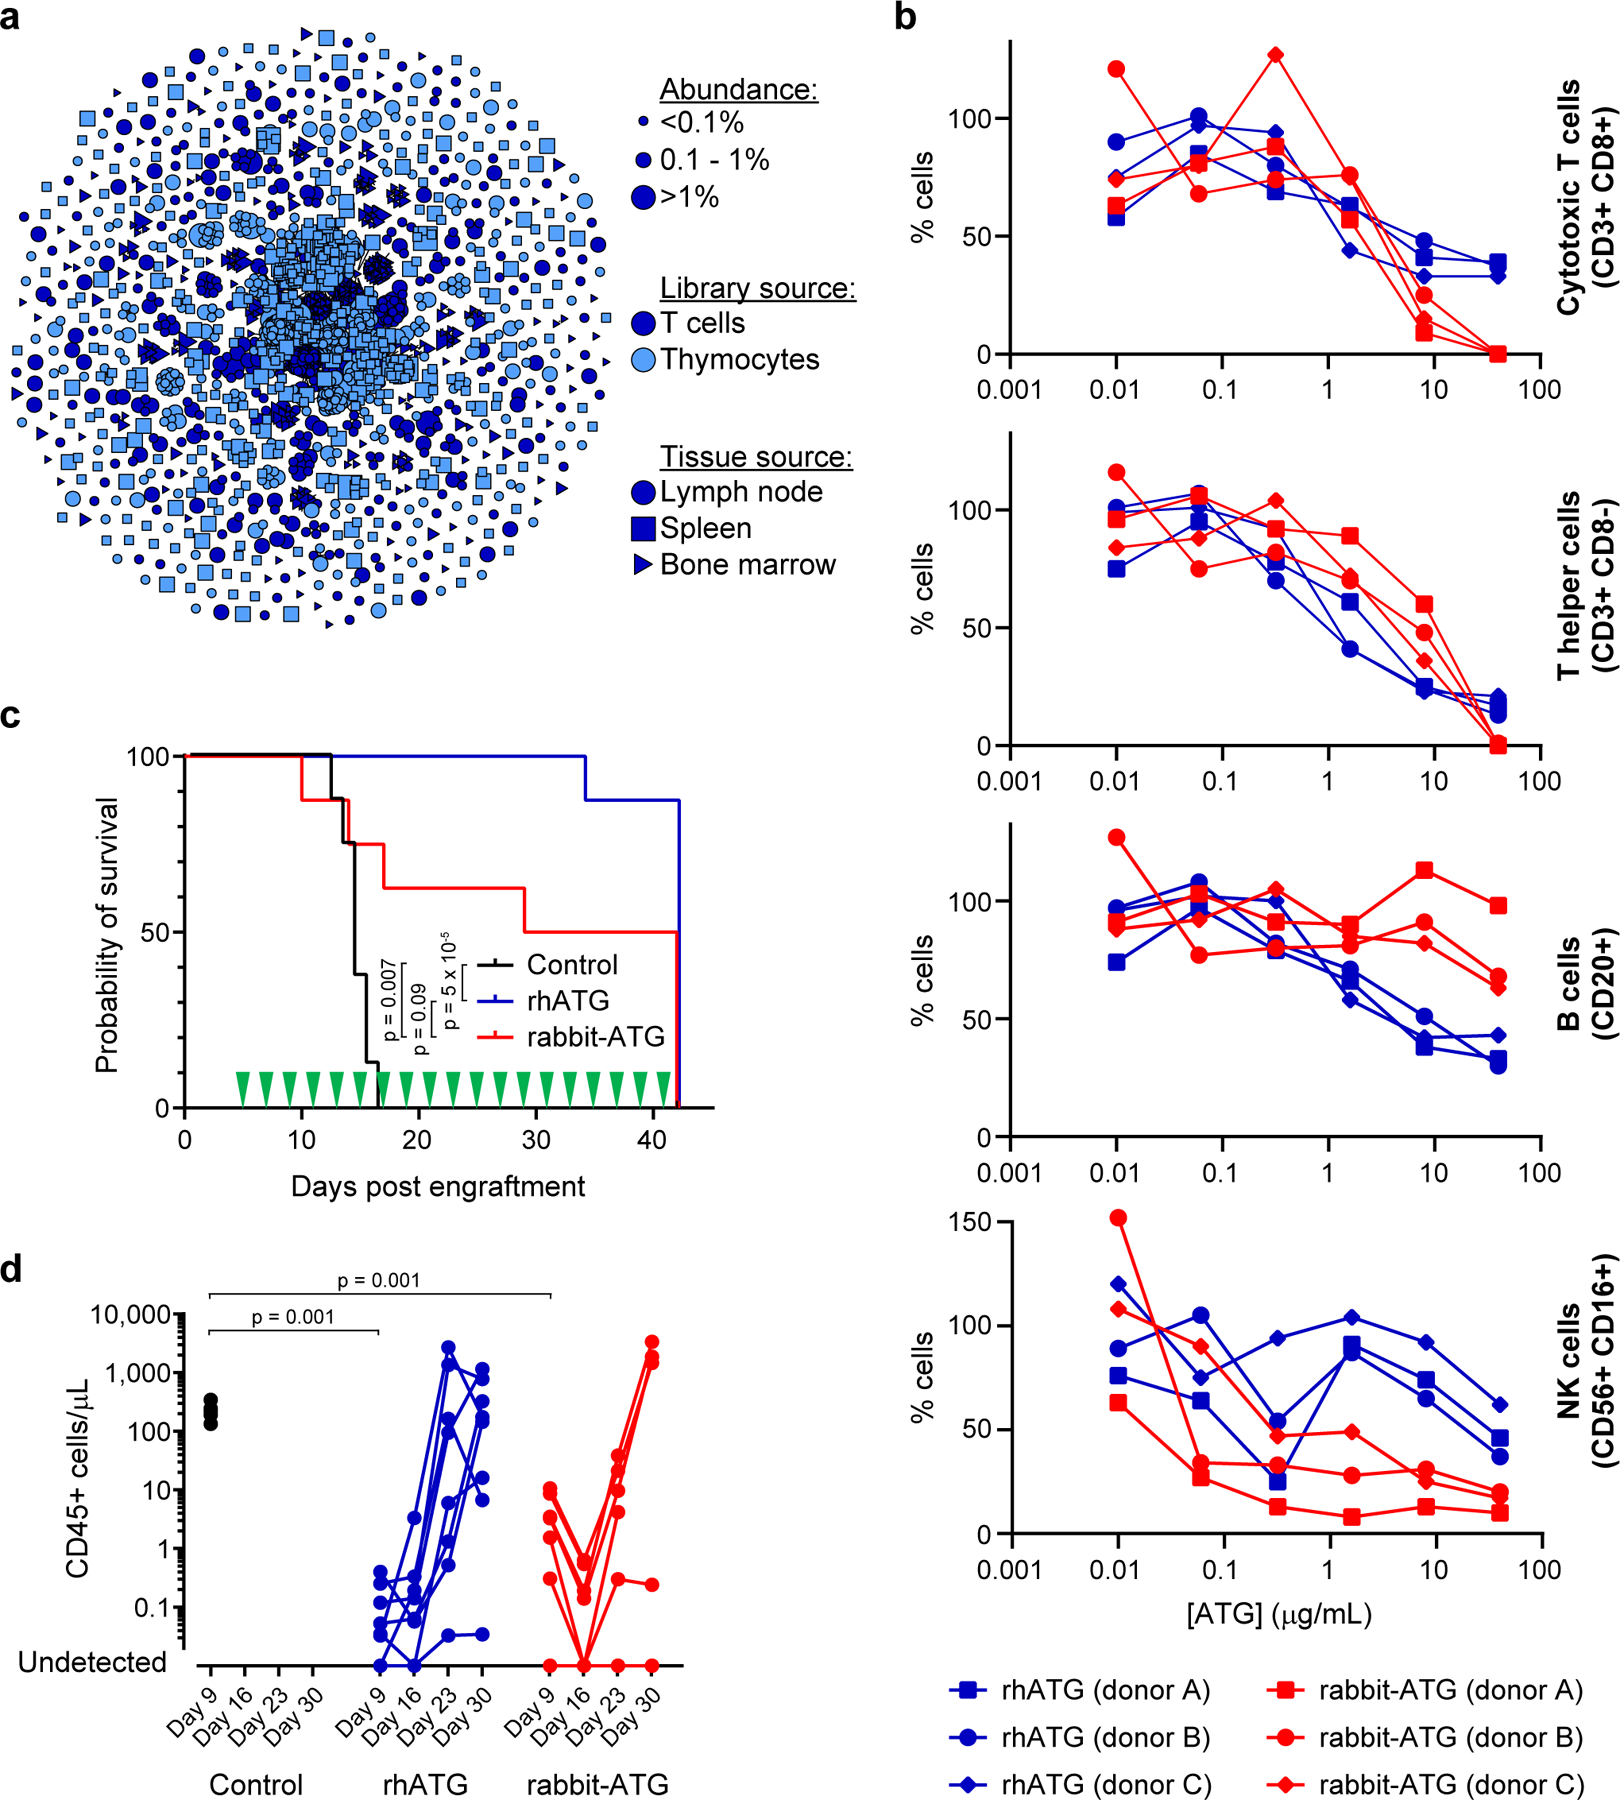
Plasma-derived polyclonal antibody therapeutics, such as intravenous immunoglobulin, have multiple drawbacks, including low potency, impurities, insufficient supply and batch-to-batch variation. Here we describe a microfluidics and molecular genomics strategy for capturing diverse mammalian antibody repertoires to create recombinant multivalent hyperimmune globulins. Our method generates of diverse mixtures of thousands of recombinant antibodies, enriched for specificity and activity against therapeutic targets. Each hyperimmune globulin product comprised thousands to tens of thousands of antibodies derived from convalescent or vaccinated human donors or from immunized mice. Using this approach, we generated hyperimmune globulins with potent neutralizing activity against severe acute respiratory syndrome coronavirus-2 (SARS-CoV-2) in under 3 months, Fc-engineered hyperimmune globulins specific for Zika virus that lacked antibody-dependent enhancement of disease, and hyperimmune globulins specific for lung pathogens present in patients with primary immune deficiency. To address the limitations of rabbit-derived anti-thymocyte globulin, we generated a recombinant human version and demonstrated its efficacy in mice against graft-versus-host disease.


Figures

Figure 1.
Figure 1.
Methods used in this study for generating recombinant hyperimmune globulins. (a) B cells were isolated from human donors (vaccinated or convalescent) or immunized humanized mice. (b) Droplet microfluidics were used to capture natively paired antibody sequences from millions of single cells. (c) An optional yeast scFv display system was used to enrich for binders to a soluble antigen. (d) A two-step Gibson Assembly process converted the scFv fragment to full-length antibody expression constructs, which were then stably integrated into CHO cells following electroporation and selection. (e) After bioproduction, the libraries were characterized in many ways including deep sequencing, in vitro binding and efficacy assays, and in vivo mouse efficacy studies.
Figure 2.
Figure 2.
Generation and characterization of a recombinant hyperimmune globulin against SARS CoV-2. (a) ELISA of individual human plasma donors against SARS CoV-2 S1 antigen (top) or RBD antigen (bottom). Dark blue indicates donors used in rCIG. Each data point represents a single measurement at a single test article dilution, in a single experiment. (b) Example FACS enrichment of scFv against CoV-2 RBD from library 1 using yeast display. The x-axis measures presence of a C-terminal c-Myc tag, indicating expression of an scFv on the surface of the cell. The y-axis measures binding of antigen to the scFv-expressing cells. The gates used for yeast selection (double positive) are indicated, with the percentage of scFv-expressed antigen binders in red. Each plot summarizes a single FACS experiment with one yeast scFv library. (c) Clonal cluster analysis of rCIG antibodies. Each node represents an antibody clone (full-length heavy chain). The color of the nodes indicates the sorted scFv library from which the CHO antibody clones were derived. The size of the nodes reflects the frequency of the clones in the final CHO cell bank (only clones ≥0.01% are plotted). We computed the total number of amino acid differences between each pairwise alignment, and edges indicate ≤5 amino acid differences. (d) ELISA of the indicated samples against SARS CoV-2 S1 antigen (top) or RBD antigen (bottom). Each data point represents a single measurement at a single test article dilution, in a single experiment. (e) ELISA of the indicated samples (indicated by the color) against the indicated antigens (different shapes). For rCIG, no binding was observed against MERS CoV S1. For the CoV-2 mAb [SAD-S35], no binding was observed against MERS CoV S1 and SARS CoV RBD. Each data point represents a single measurement at a single test article dilution, in a single experiment. (f) Live virus neutralization. Individual dots are separate test articles that represent the minimum antibody concentration that achieved neutralization. Bars represent median measurements for each test article category. Each test article was run in duplicate using different aliquots of cells and virus, in a single experiment, with the same result observed for each replicate. No neutralization was seen for IVIG. A Wilcoxon rank sum test was used to compare the minimum concentration to achieve SARS CoV-2 live virus neutralization between convalescent plasma measurements (n=16) and rCIG measurements (n=2).
Figure 3.
Figure 3.
Generation and characterization of a recombinant hyperimmune globulin against Zika virus. (a) Clonal cluster analysis of rZIG-IgG1 (blue) and rZIG-LALA (green) antibodies. Each node represents an antibody clone (full-length heavy chain). The size of the nodes reflects the frequency of the clones in the final CHO cell bank (only clones ≥0.01% are plotted). We computed the total number of amino acid differences between each pairwise alignment after combining both libraries together, and edges indicate ≤5 amino acid differences. (b) ELISA of rZIG-IgG1 (blue), rZIG-LALA (green), and Zika/Dengue+ serum control (red) for Dengue serotypes 1–4 (y-axis; indicated by shape) and Zika virus antigen (x-axis). Each data point represents a single test article measured against a single Dengue serotype. Linear regression trendline is indicated in black. Simple linear regression was used to calculate the coefficient of determination (R2) between Zika and Dengue ELISA EC50 values (n=7, in a single experiment). EC50 values for all Dengue serotypes were pooled for the analysis. Significance of the regression model was determined using an F-statistic with 1 and 10 degrees of freedom. (c) Pseudotype neutralization by rZIG-IgG1 (blue), rZIG-LALA (green), and Zika/Dengue+ serum control (red) for Dengue serotypes 1–4 (y-axis; indicated by shape) and Zika virus antigen (x-axis). Each data point represents a single test article measured against a single Dengue serotype, in a single experiment. Linear regression trendline is indicated in black. Simple linear regression was used to calculate the coefficient of determination (R2) between Zika and Dengue pseudotype neutralization IC50 values (n=11). IC50 values for all Dengue serotypes were pooled for the analysis. Significance of the regression model was determined using an F-statistic with 1 and 10 degrees of freedom. (d) Zika pseudotype virus ADE assay for rZIG-IgG1 (blue), rZIG-LALA (green), and positive and negative controls. Test article concentration is on the x-axis. Fold-increase infection is on the y-axis, which was the infection-induced luciferase signal observed in the presence of antibody divided by the luciferase signal observed with a no antibody control. Each data point represents a single measurement at a single test article dilution, in a single experiment.
Figure 4.
Figure 4.
Generation and characterization of a recombinant hyperimmune globulin for primary immune deficiency (PID). (a) Clonal cluster analysis of rHIG (green) and rPIG (blue) antibodies. Each node represents an antibody clone (full-length heavy chain). The size of the nodes reflects the frequency of the clones in the final CHO cell bank (only clones ≥0.01% are plotted). We computed the total number of amino acid differences between each pairwise alignment, and edges indicate ≤5 amino acid differences. (b) Anti-Hib ELISA for rHIG (green) and IVIG (black). Each data point represents a single measurement at a single test article dilution, in a single experiment. (c) Serum bactericidal assay (SBA) for rHIG (green) and IVIG (black) with the ATCC 10211 Hib strain. % no Ab control (y-axis) was computed as the number of bacterial colonies in the test sample divided by the number of bacterial colonies in a no antibody control sample. Each data point represents a single measurement at a single test article dilution, in a single experiment. (d) ELISA binding to (dark blue) or opsonophagocytosis of (light blue) the indicated pneumococcal serotype. Fold-improvement in binding/activity over IVIG was computed as a mean of duplicate measurements for rPIG divided by a mean of duplicate measurements for IVIG (based on the binding concentration for ELISA and the number of bacterial colonies for opsonophagocytosis). Fold improvement over IVIG, by assay (ELISA or opsonophagocytosis) was tested using a one-sample Wilcoxon signed rank test, with the null hypothesis that the median equals 1, i.e., H0 =1. For each assay, all individual serotypes were pooled a single Wilcoxon signed rank test. Values for each individual serotype were generated by dividing the mean of duplicate rPIG measurements by the mean of duplicate IVIG measurements. (e) In vivo assay with ATCC 10211 Hib strain. Each circle represents CFU Hib per mL (y-axis) from either peritoneal fluid or blood from a single mouse in a given test group. Black bars represent mean of the CFU Hib per mL. Dotted lines represent the lower limit of detection for CFU quantification. Welch’s t-tests were used to compare CFU Hib per mL between test groups (n=8 mice per group, in a single experiment). Degrees of freedom were 7.87 for IVIG + rHIG/rPIG (500 mg/kg) and 7.13 for IVIG + rHIG/rPIG (200 mg/kg) in peritoneal fluid. Degrees of freedom were 10.87 for IVIG + rHIG/rPIG (500 mg/kg) and 8.03 for IVIG + rHIG/rPIG (200 mg/kg) in blood.
Figure 5.
Figure 5.
Generation and characterization of a recombinant human anti-thymocyte globulin (rhATG). (a) Clonal cluster analysis of rhATG antibodies. Each node represents an antibody clone (full-length heavy chain). The color of the nodes indicates the immunized library source. The shape of the nodes indicates the mouse tissue origin. The size of the nodes reflects the frequency of the clones in the final CHO cell bank (only clones ≥0.01% are plotted). We computed the total number of amino acid differences between each pairwise alignment, and edges indicate ≤5 amino acid differences. (b) Cell killing assays of a dilution series of rabbit-ATG (red) and rhATG (blue) with three PBMC donors. The y-axis (% cells) was determined by dividing the number of cells of the indicated cell type present after overnight incubation with the indicated amount of antibody by the number of cells of that cell type present in a no antibody control. Each data point represents a single measurement at a single test article dilution, in a single experiment. Linear mixed effects models were used to compute p-values for each of the four cell types, with group and concentration as fixed effects and PBMC donor as a random effect to account for the dependence of repeated measures. Degrees of freedom were 31 for each of the four models. (c) Survival of mice (n=8 per treatment group, in a single experiment) in the GVH study using PBMC donor 1 treated every other day with a negative vehicle control (black), rabbit-ATG (red), or rhATG (blue). Treatment days are indicated by green triangles. Kaplan-Meier survival models were fit on time to mortality and pairwise log rank tests were performed to compare median survival between treatment groups. (d) Flow cytometry was used to determine the concentration of CD45+ cells from each alive mouse on Days 9, 16, 23, and 30 of the GVH study from (c) for negative vehicle control (black circles), rhATG (blue circles), or rabbit-ATG (red circles). Lines connect measurements from each mouse. No CD45+ cells were observed where circles intercept the x-axis. Linear mixed effects models were used to compute p-values for trends in CD45+ cell counts in each of the four GVH experiments (2 PBMC donors × 2 drug dosing regimens = 4 experiments) with day as a fixed effect and PBMC donor as a random effect to account for the dependence of repeated measures. A Wilcoxon rank sum test was used to compare CD45+ cell counts on Day 9 for saline negative control vs. rhATG and saline negative control vs. rabbit-ATG, in each of the four GVH experiments (2 PBMC donors × 2 drug dosing regimens = 4 experiments).

References

    1. Bozzo J, Jorquera JI. Use of human immunoglobulins as an anti-infective treatment: the experience so far and their possible re-emerging role. Expert Rev Anti Infect Ther 2017;15(6):585–604. doi:10.1080/14787210.2017.1328278 - DOI - PubMed
    1. Beasley RP, Hwang LY, Stevens CE, et al.Efficacy of hepatitis B immune globulin for prevention of perinatal transmission of the hepatitis B virus carrier state: final report of a randomized double-blind, placebo-controlled trial. Hepatology 1983;3(2):135–141. doi:10.1002/hep.1840030201 - DOI - PubMed
    1. Payne JR, Khouri JM, Jewell NP, Arnon SS. Efficacy of Human Botulism Immune Globulin for the Treatment of Infant Botulism: The First 12 Years Post Licensure. J Pediatr 2018;193:172–177. doi:10.1016/j.jpeds.2017.10.035 - DOI - PubMed
    1. Gaber AO, First MR, Tesi RJ, et al.Results of the double-blind, randomized, multicenter, phase III clinical trial of Thymoglobulin versus Atgam in the treatment of acute graft rejection episodes after renal transplantation. Transplantation 1998;66(1):29–37. doi:10.1097/00007890-199807150-00005 - DOI - PubMed
    1. Branche E, Simon AY, Sheets N, et al.Human Polyclonal Antibodies Prevent Lethal Zika Virus Infection in Mice. Sci Rep 2019;9(1):9857. Published 2019 Jul 8. doi:10.1038/s41598-019-46291-9 - DOI - PMC - PubMed

METHODS-ONLY REFERENCES

    1. Meijer PJ, Nielsen LS, Lantto J, Jensen A. Human antibody repertoires. Methods Mol Biol 2009;525:261–77, xiv. doi: 10.1007/978-1-59745-554-1_13. - DOI - PubMed

Publication types