. 2021 Aug;39(8):936-942.
doi: 10.1038/s41587-021-00883-x. Epub 2021 Apr 15.

Compressed sensing for highly efficient imaging transcriptomics

Affiliations

Compressed sensing for highly efficient imaging transcriptomics

Brian Cleary et al. Nat Biotechnol. 2021 Aug.

Abstract

Recent methods for spatial imaging of tissue samples can identify up to ~100 individual proteins1-3 or RNAs4-10 at single-cell resolution. However, the number of proteins or genes that can be studied in these approaches is limited by long imaging times. Here we introduce Composite In Situ Imaging (CISI), a method that leverages structure in gene expression across both cells and tissues to limit the number of imaging cycles needed to obtain spatially resolved gene expression maps. CISI defines gene modules that can be detected using composite measurements from imaging probes for subsets of genes. The data are then decompressed to recover expression values for individual genes. CISI further reduces imaging time by not relying on spot-level resolution, enabling lower magnification acquisition, and is overall about 500-fold more efficient than current methods. Applying CISI to 12 mouse brain sections, we accurately recovered the spatial abundance of 37 individual genes from 11 composite measurements covering 180 mm2 and 476,276 cells.


Conflict of interest statement

Declaration of interests: A.R. is a founder and equity holder of Celsius Therapeutics, an equity holder in Immunitas Therapeutics and until August 31, 2020 was a SAB member of Syros Pharmaceuticals, Neogene Therapeutics, Asimov and ThermoFisher Scientific. From August 1, 2020, A.R. is an employee of Genentech, a member of the Roche Group. E.S.L. serves on the Board of Directors for Codiak BioSciences and Neon Therapeutics, and serves on the Scientific Advisory Board of F-Prime Capital Partners and Third Rock Ventures; he also serves on the Board of Directors of the Innocence Project, Count Me In, and Biden Cancer Initiative, and the Board of Trustees for the Parker Institute for Cancer Immunotherapy.

Figures

Extended Data Fig. 1
Extended Data Fig. 1. Marker gene expression in snRNA-seq clusters
For each of 37 genes, shown is the distribution of expression (individual violin plots; y-axis) in each of 23 snRNA-Seq clusters (x axis). Marker genes for similar cell types are grouped together with the cell type labeled on top.
Extended Data Fig. 2
Extended Data Fig. 2. Analysis of modular factorization based on gene and module diversity
Pearson correlation (y-axis) between the original expression levels of 37 genes in each cell and those approximated in those cells by Sparse Module Activity Factorization (SMAF). Contour plots depict the density of cells at each level of correlation with either a given number of genes expressed (a; x-axis) or a given number of gene modules by SMAF decomposition (b; x-axis).
Extended Data Fig. 3
Extended Data Fig. 3. Evaluation of performance of simulated compositions
Distribution of Pearson correlation between the original and recovered expression levels of 37 genes in each cell (y axis) across simulation trials for different numbers of composite measurements (a), or for different measurement densities, set by the maximum number of measurements in which each gene was included (b). In (a) the maximum compositions per gene is 3, and in (b) the number of compositions is 10. Mini boxplots depict median (center dots), inner quartiles (upper and lower bounds of box for 25th and 75th percentile), and 1.5x quartile range (minima and maxima of whiskers).
Extended Data Fig. 4
Extended Data Fig. 4. Autoencoder based decompression successfully recovers accurate spatial patterns of individual genes compared to direct measurement on the same section.
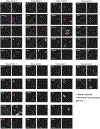
RNA images recovered by decompression with the segmentation free algorithm (magenta) and directly measured (green) in the same tissue section. White: images overlap exactly. Genes are grouped based on the section in which their direct measurements were made. Insets for all genes in a section show the same region, or an adjacent region if no cells for a given gene were present. Scale bar: 500um. Representative fields of view in each tissue section were chosen such that every gene validated in a tissue section could be visualized in the same region, while quantification of overlap (correlation) was calculated using all cells in a given tissue section, or using randomly selected testing cells (where indicated).
Extended Data Fig. 5
Extended Data Fig. 5. Comparison of autoencoding and segmentation-based decompression
Individual gene images recovered (magenta) using the autoencoding algorithm (left) or the segmentation based algorithm (right) are overlaid with direct measurement (green) of the genes in the same tissue sections (white: direct overlap). For segmentation-based decompression, the decompressed signal for each gene is projected uniformly over each segmentation mask. Scale bar: 500um. Representative fields of view were selected to highlight expression of indicated genes, while quantification of overlap (correlation) was calculated using all cells in a given tissue section, or using randomly selected testing cells (where indicated).
Extended Data Fig. 6
Extended Data Fig. 6. Evaluation of recovered signals before and after co-measurement adjustment
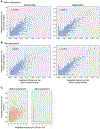
(a,b) Adjustment improves recovered signals. Integrated signal intensity for each gene in each cell (individual dots) from direct measurements (x axis) and from estimates recovered by the autoencoder decompressed images (y axis) either before (a) and after (b) co-measurement correction. (c) Example correction. Segmented cell intensities before (left) and after (right) correction for two co-measured genes (Hmha1 and Slc17a7) that were not correlated in snRNA-Seq.
Extended Data Fig. 7
Extended Data Fig. 7. Evaluation based on genes per cell and cell clusters
(a) Distribution of expression diversity (effective number of genes expressed per cell out of 37 total; y axis) in snRNA-Seq, or based on recovered expression levels using autoencoding or segmentation-based decompression (x axis). Mini boxplots depict median (center dots), inner quartiles (upper and lower bounds of box for 25th and 75th percentile), and 1.5x quartile range (minima and maxima of whiskers). (b) Correspondence (Pearson’s correlation of mean gene expression; color bar) between cell clusters from snRNA-Seq (rows) and those found from post hoc segmentation of images recovered using the autoencoding algorithm (columns). One marker gene for each cluster is indicated.
Extended Data Fig. 8
Extended Data Fig. 8. CISI recapitulates clusters and conditional probabilities from scRNA-Seq
(a,b) Consistent identification of cell type specific gene programs in scRNA-Seq and CISI. The correlation coefficient (colorbar) between pairs of genes (row and column labels) in scRNA-Seq (a) and decompressed CISI measurements (b). Rows and columns are clustered. Gene clusters of cell type specific markers are labeled by the respective cell type. (c,d) Consistent cell type expression patterns for IEGs in scRNA-Seq is CISI. Conditional probability (colorbars) of IEGs (columns) in cells that express a given gene (rows) in scRNA-Seq (c) and decompressed CISI (d) data.
Extended Data Fig. 9
Extended Data Fig. 9. Gene-level correlation with validation measurements
For each gene (individual dots) validated in each tissue (colors) the correlation across all segmented cells (y-axis) between values recovered by CISI and directly measured values is plotted vs the average expression level (TPM) in cells expressing the gene in scRNA-Seq (x-axis, left), or the percentage of cells expressing the gene (x-axis, right). Individual data points labeled by gene are provided in Supplementary Table 10.
Figure 1.
Figure 1.. Composite In Situ Imaging (CISI)
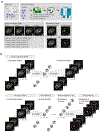
(a) Method overview. snRNA-Seq data (top left) is first analyzed (top right) to learn a dictionary of gene modules, simulate compressed sensing, and select measurement compositions to be used in CISI experiments (bottom left). In a CISI experiment, in each color in each round of imaging, probes for every gene in a given composite measurement are hybridized simultaneously. The process is repeated for different compositions over several cycles of stripping and hybridization (bottom left). Finally, composite images are then decompressed computationally (bottom right) to recover individual images for each gene. (b) Segmentation-free decompression. Top: An autoencoder is first trained on the composite images, with each composite measurement corresponding to one channel. Bottom: Once the autoencoder is trained, the composite images are encoded (“Encoding”), then decompressed to approximate the encoded representation for the unobserved image of each individual gene (“Decompression”), and the pre-trained decoder is used to recover individual images for each gene (“Decoding”).
Figure 2.
Figure 2.. CISI recovers accurate spatial expression patterns from composite experiments
(a,b) Quantitative accuracy of the composite imaging. (a) A composite image of 12 genes (“Composition 2”) compared to a computational merge of 12 images for each individual gene (“Merged image”). 3 of the 12 individual gene images are shown for reference. Left: entire FOV; Right: zoomed in segment, as indicated. Scale bar: 500um. (b) The integrated signal intensity in each segmented cell (individual dots) in the composite image (x axis) and the merged image (y axis). Pearson’s r is noted in upper left corner. (c,d) Autoencoder based decompression successfully recovers accurate spatial patterns of individual genes. (c) Agreement with canonical expression patterns. Spatial RNA expression for Vip (top), a marker of a subtype of inhibitory neurons, which is expressed more frequently in layer 2/3; Sst (middle), a marker of another inhibitory neuron subtype, which is expressed more frequently in layer 5; and Slc17a7 (bottom), which is broadly expressed in excitatory neurons throughout MOp, by ISH (left; Allen Brain Atlas) and in the recovered images by the segmentation free algorithm (right). Scale bar: 500um. (d) Agreement with individual gene measurements on the same section. RNA images recovered by decompression with the segmentation free algorithm (magenta) and directly measured (green) in the same tissue section. White: images overlap exactly. Scale bar 500um. See also Extended Data Figure 4 for additional genes. Representative fields of view were selected to highlight expression of indicated genes, while quantification of overlap (correlation) was calculated using all cells in a given tissue section, or using randomly selected testing cells (where indicated).
Figure 3.
Figure 3.. CISI analysis of 12 bisected coronal brain sections efficiently recovers cell type, state, and diverse spatial patterns
(A) Composite measurements and validation images were collected in 12 bisected coronal brain sections (greyscale showing DAPI), in total covering 180mm2 and 476,276 cells. Composite measurements were decompressed to estimate the expression of 37 genes. Up to four genes were selected for validation in each tissue section. (B) RNA images are shown for two genes (Sv2c and Egr1) recovered by decompression with the segmentation-based algorithm (magenta) and directly measured (green) in the same tissue section. White: images overlap exactly. Correlation between recovered and validation images shown in parentheses. (C) Cells were clustered into 32 groups (legend) using the decompressed expression levels in all 12 tissue sections. Individual cells are colored based on their cluster label.

Comment in

Similar articles

Cited by

References

    1. Angelo M et al.Multiplexed ion beam imaging of human breast tumors. Nat. Med 20, 436–42 (2014). - PMC - PubMed
    1. Keren L et al.A Structured Tumor-Immune Microenvironment in Triple Negative Breast Cancer Revealed by Multiplexed Ion Beam Imaging. Cell 174, 1373–1387.e19 (2018). - PMC - PubMed
    1. Goltsev Y et al.Deep Profiling of Mouse Splenic Architecture with CODEX Multiplexed Imaging. Cell 203166 (2018). doi:10.1016/j.cell.2018.07.010 - DOI - PMC - PubMed
    1. Chen KH, Boettiger AN, Moffitt JR, Wang S & Zhuang X Spatially resolved, highly multiplexed RNA profiling in single cells. Science (80-.). 348, aaa6090–aaa6090 (2015). - PMC - PubMed
    1. Shah S, Lubeck E, Zhou W & Cai L In Situ Transcription Profiling of Single Cells Reveals Spatial Organization of Cells in the Mouse Hippocampus. Neuron (2016). doi:10.1016/j.neuron.2016.10.001 - DOI - PMC - PubMed

Publication types