. 2021 May;22(5):586-594.
doi: 10.1038/s41590-021-00913-5. Epub 2021 Apr 15.

Microglia use TAM receptors to detect and engulf amyloid β plaques

Affiliations

Microglia use TAM receptors to detect and engulf amyloid β plaques

Youtong Huang et al. Nat Immunol. 2021 May.

Abstract

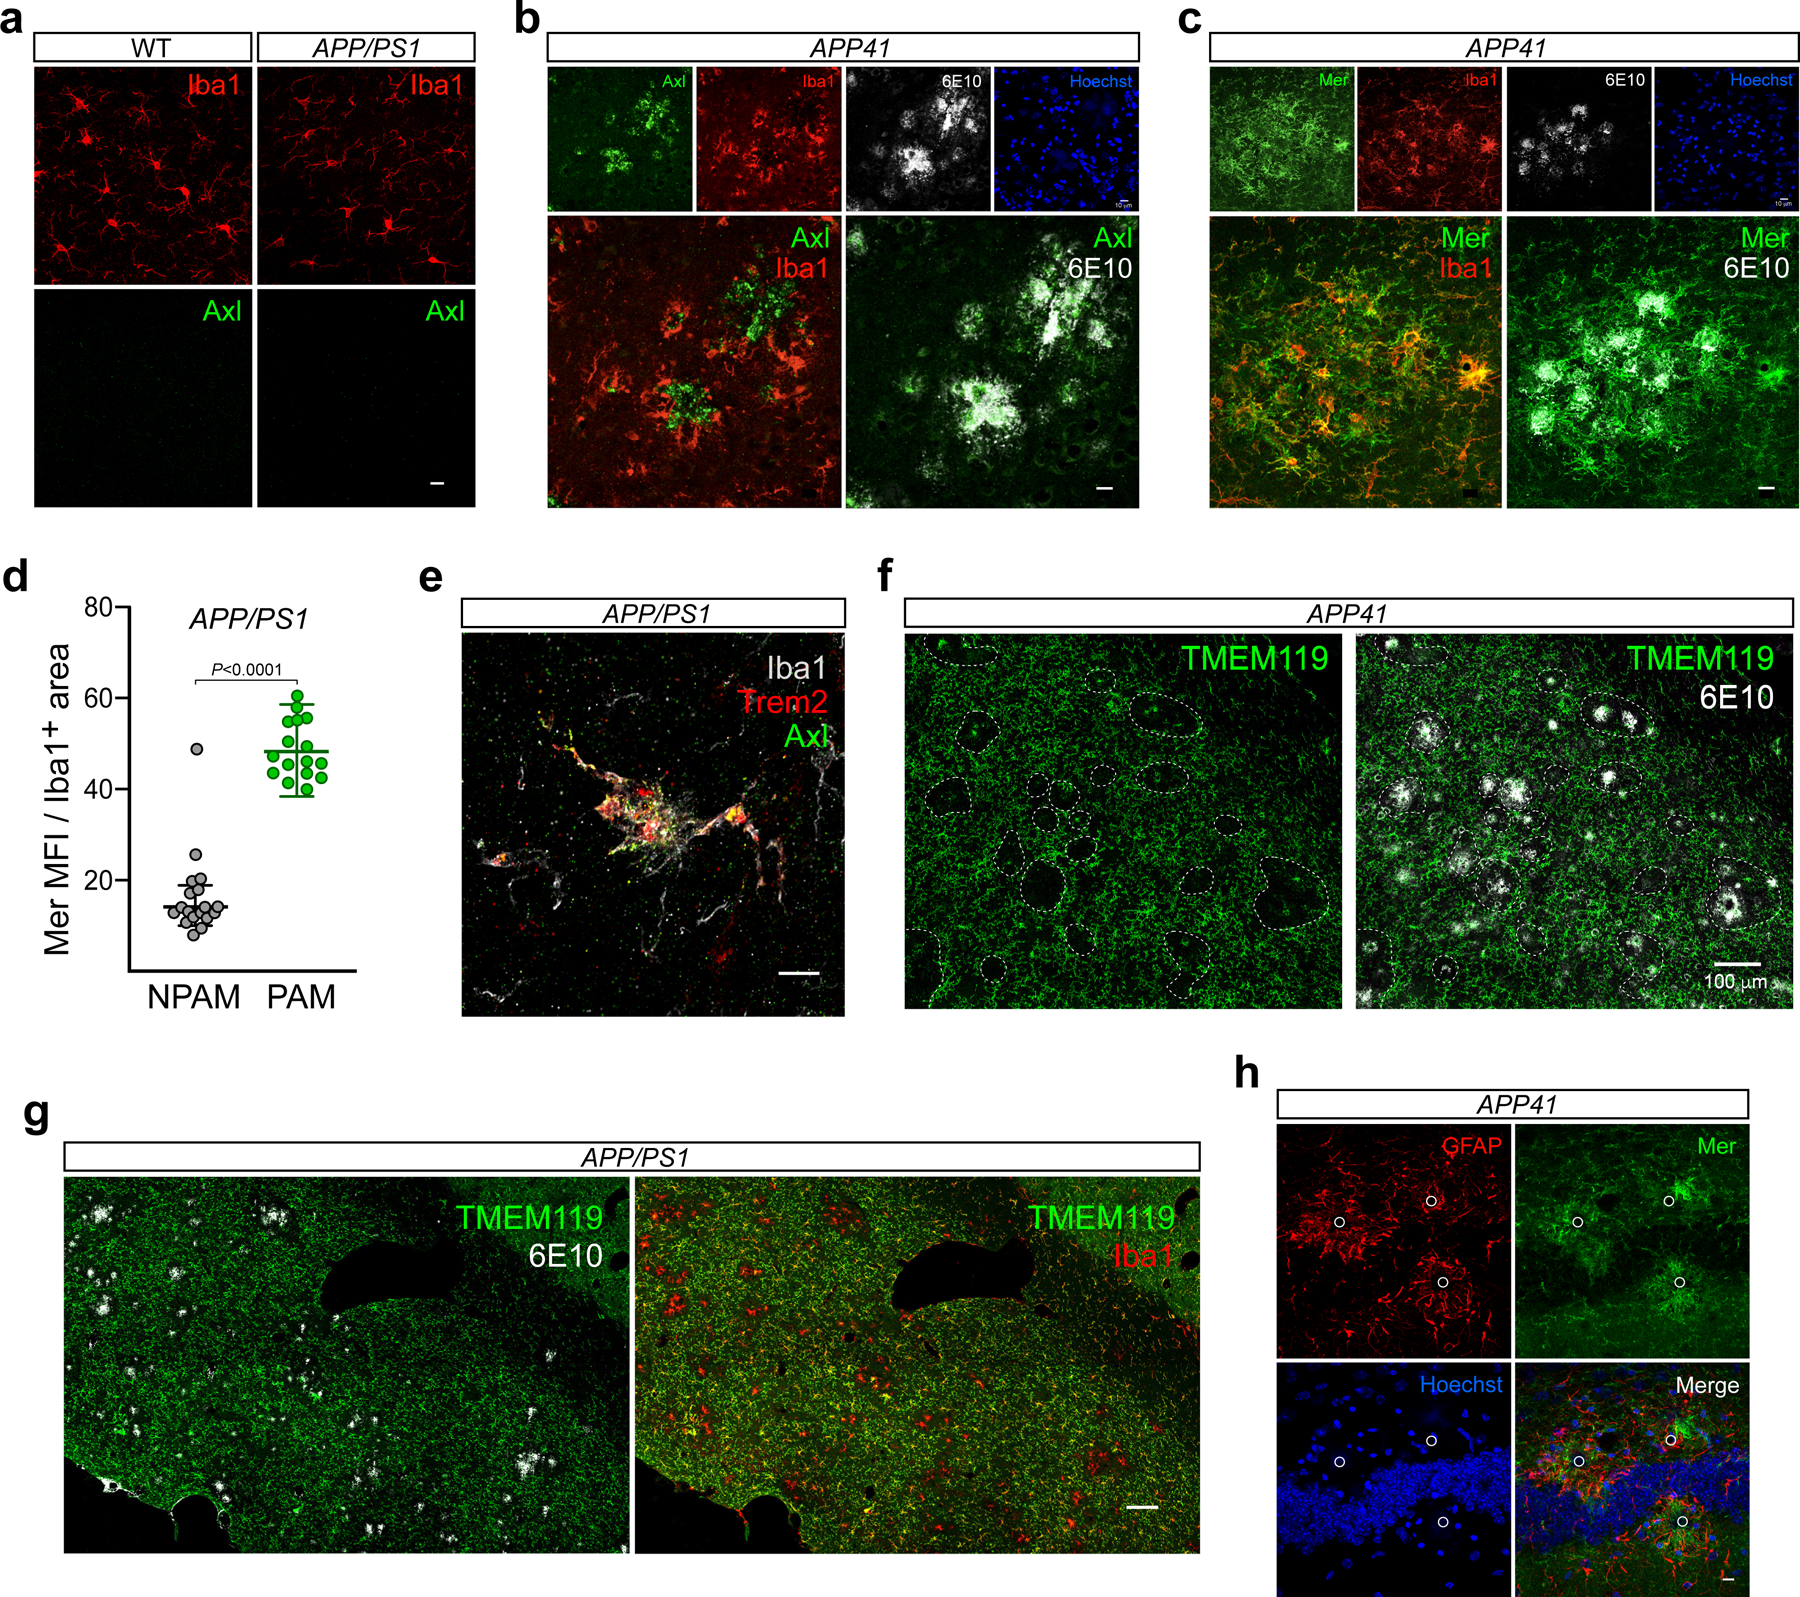
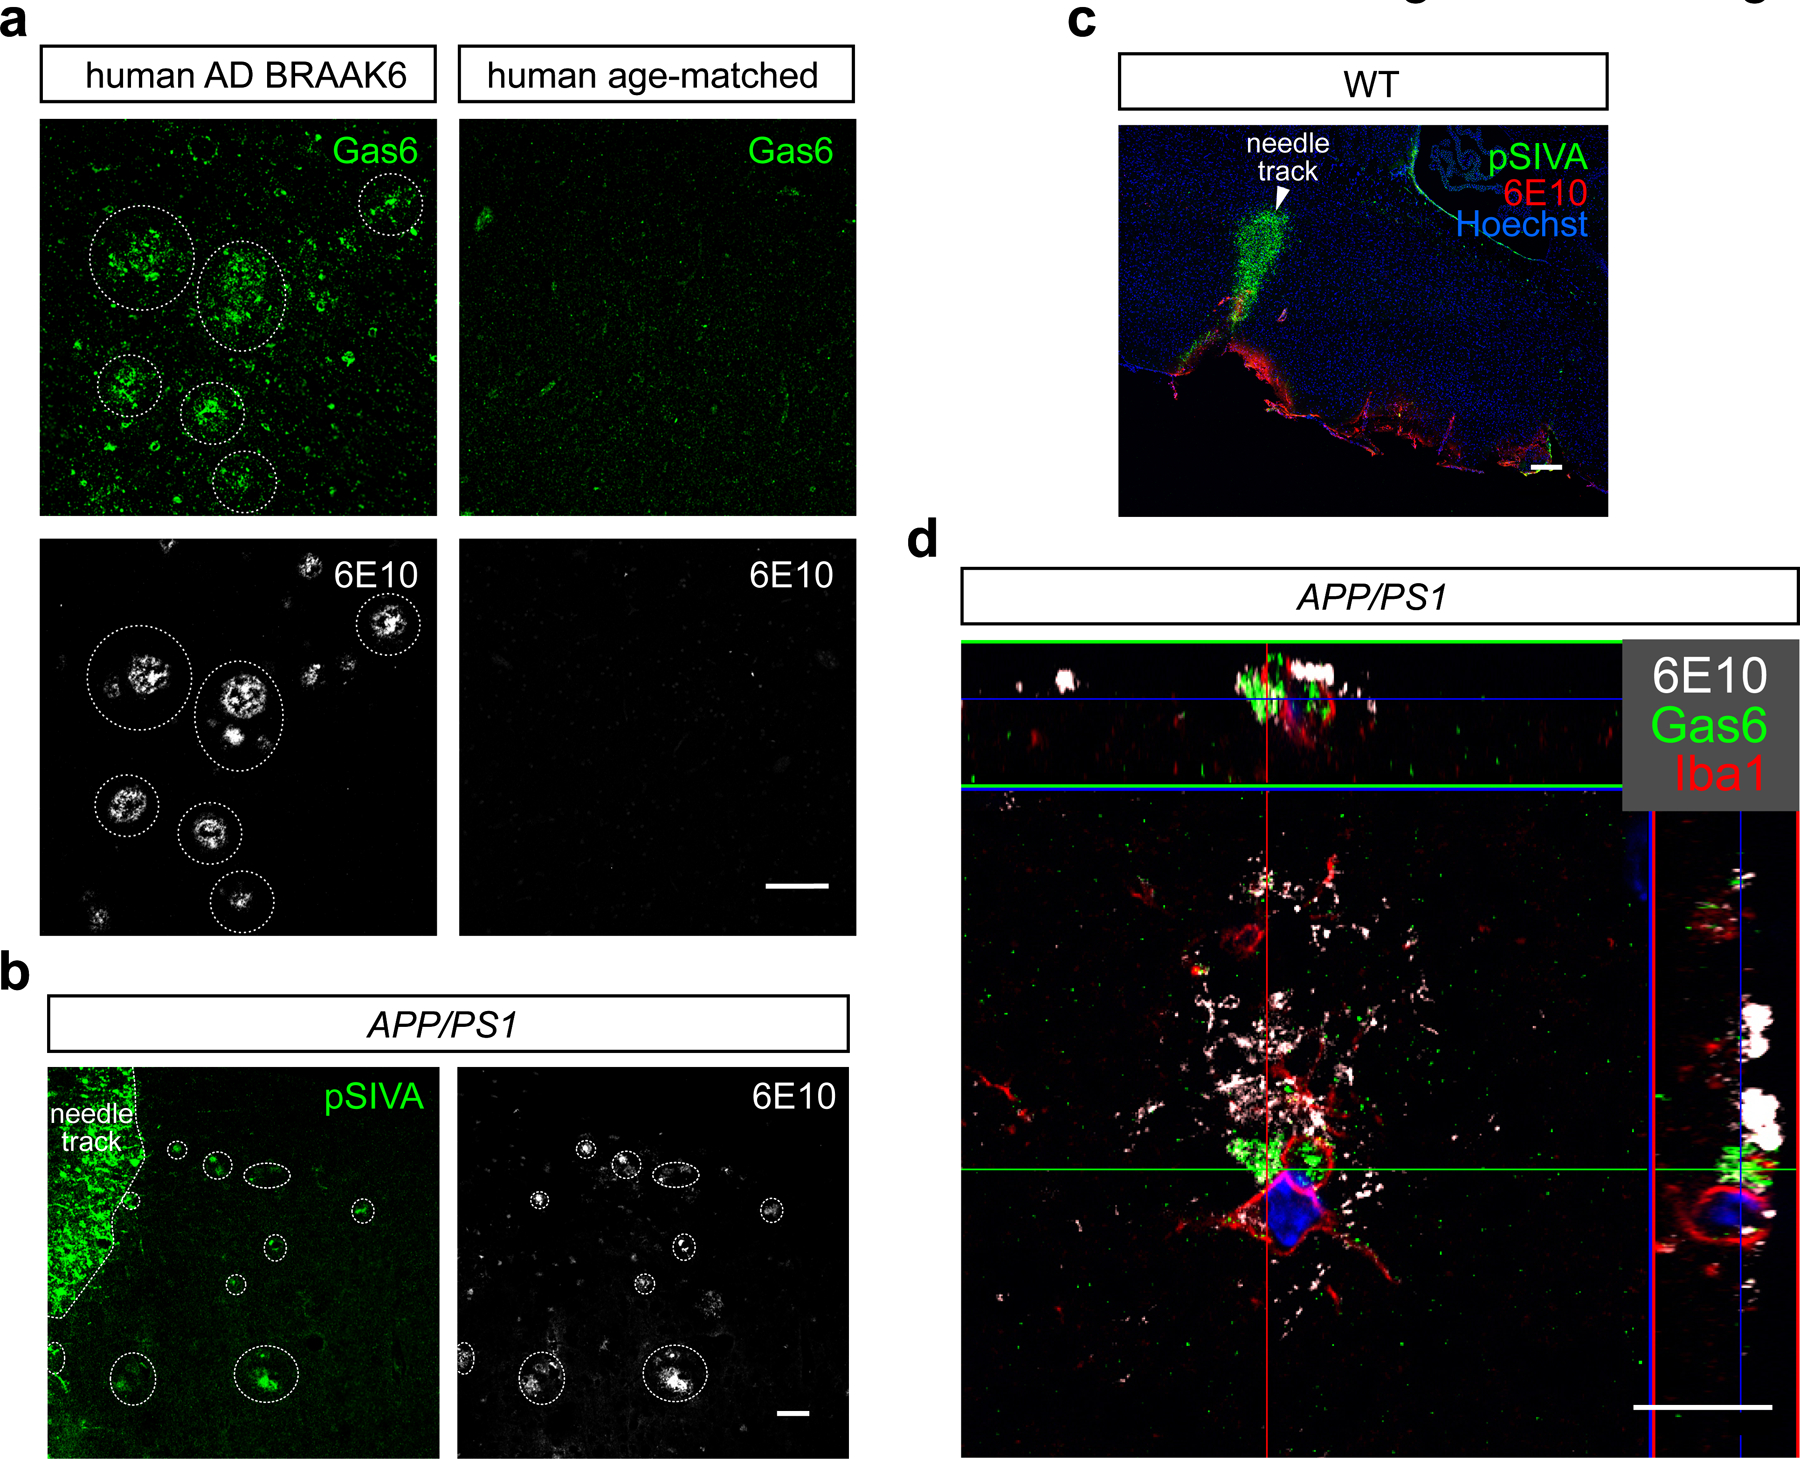
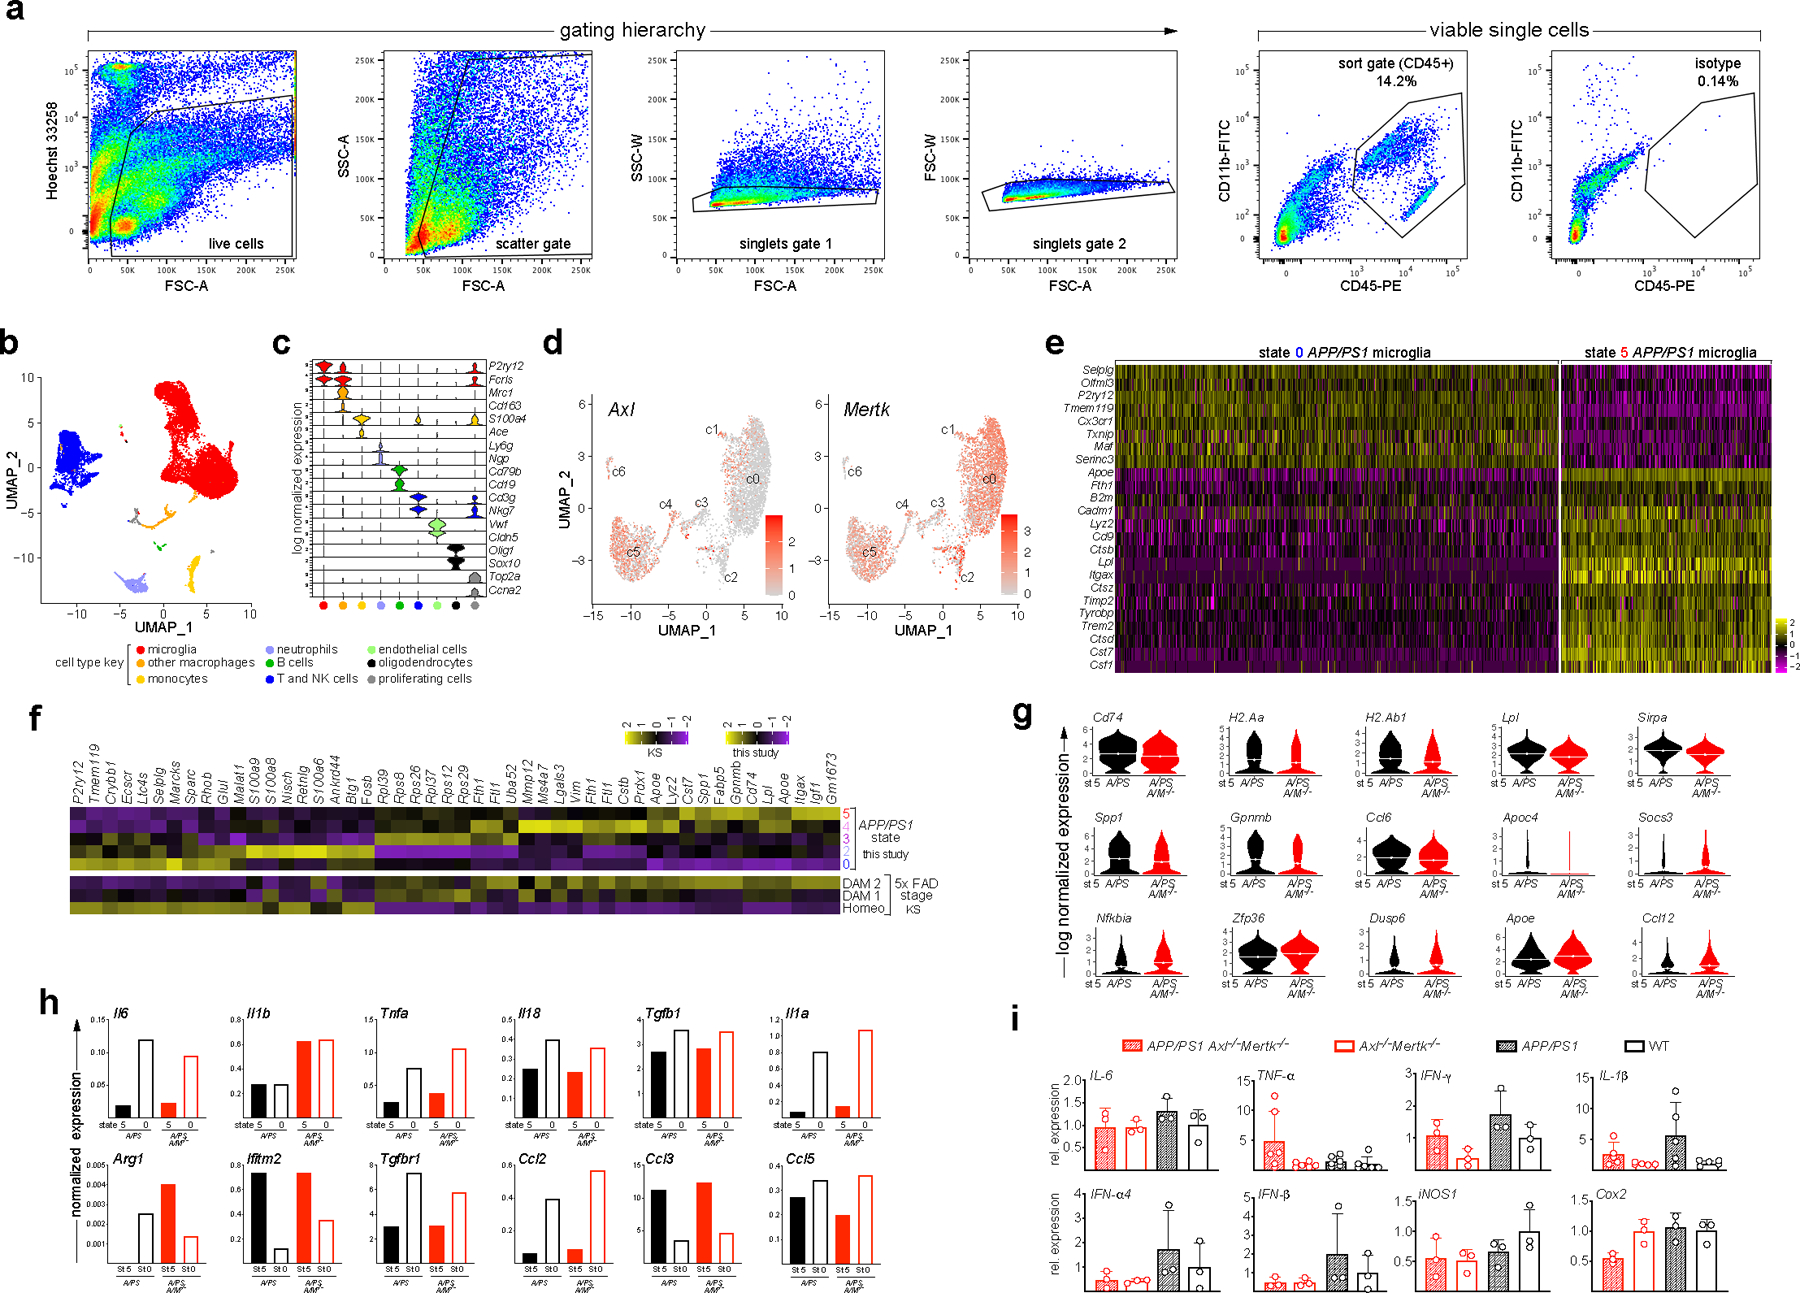
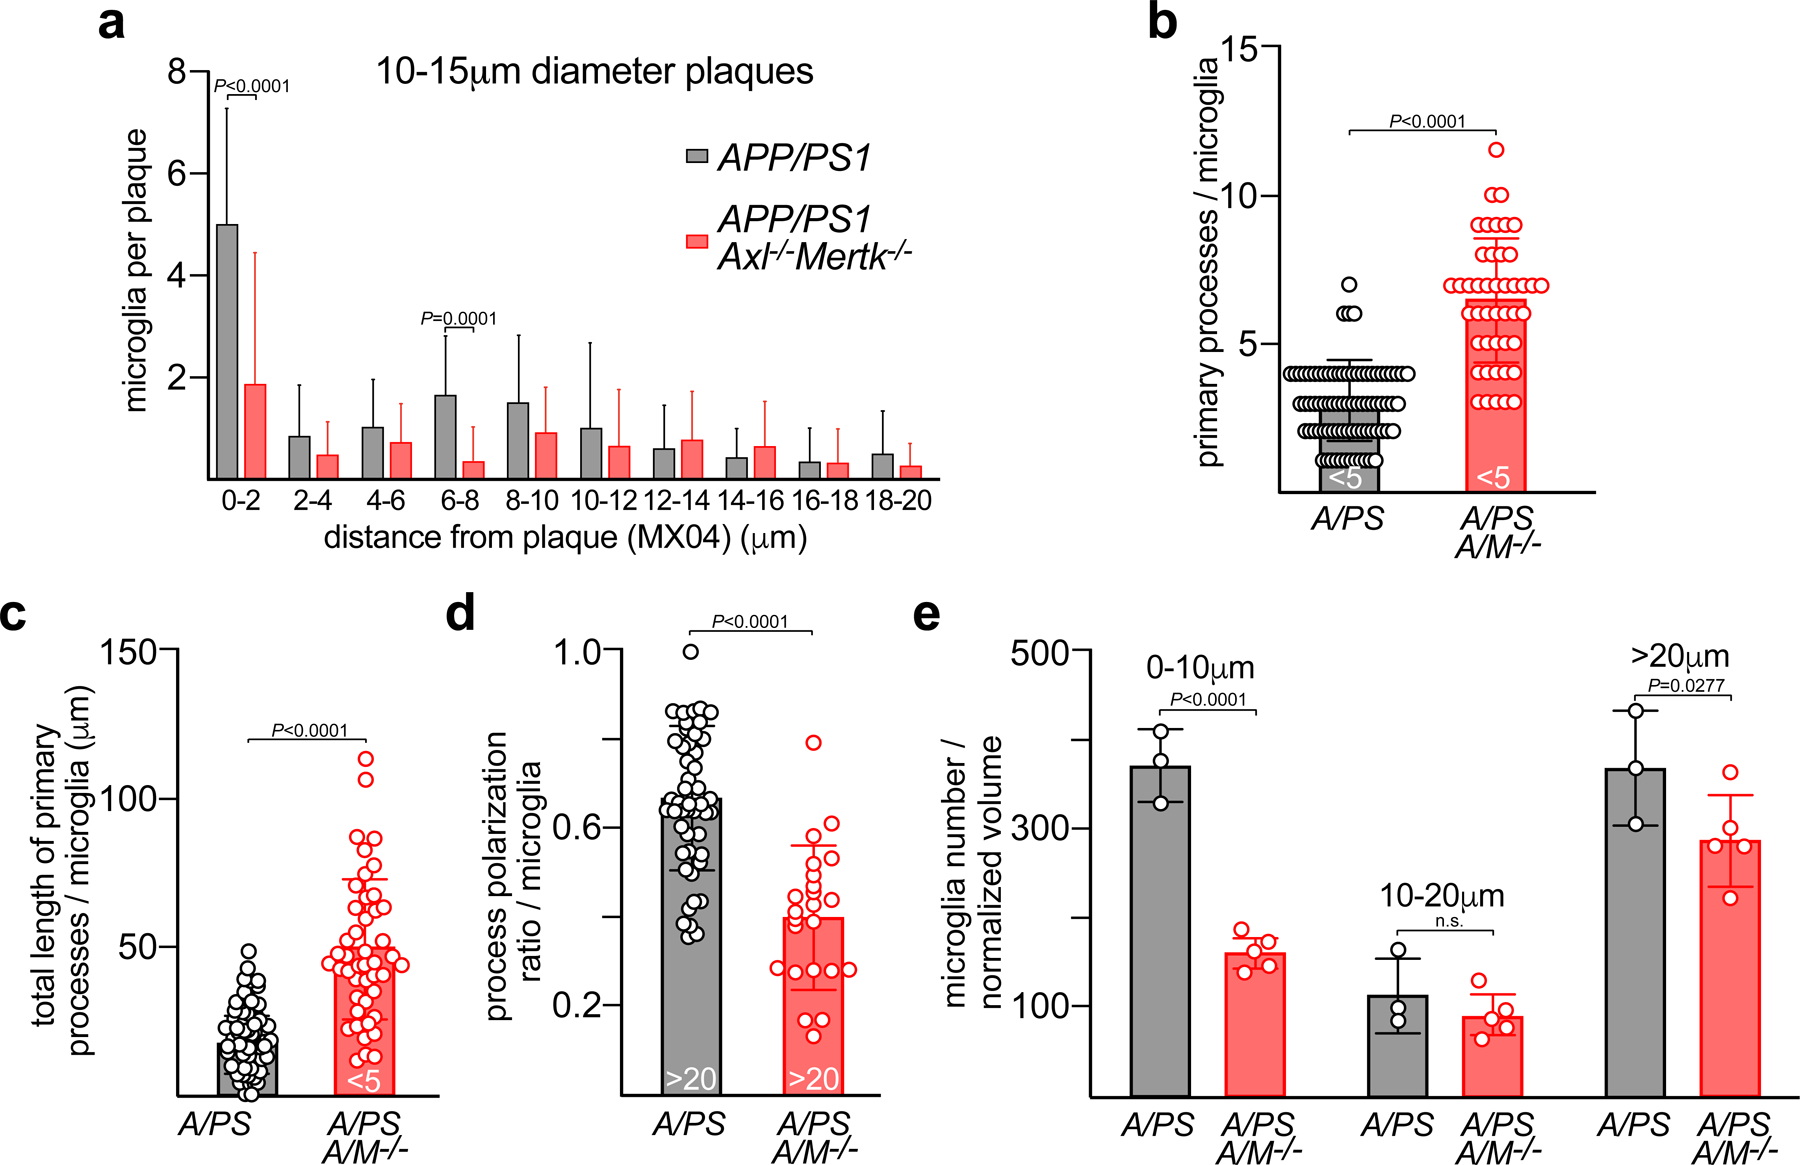
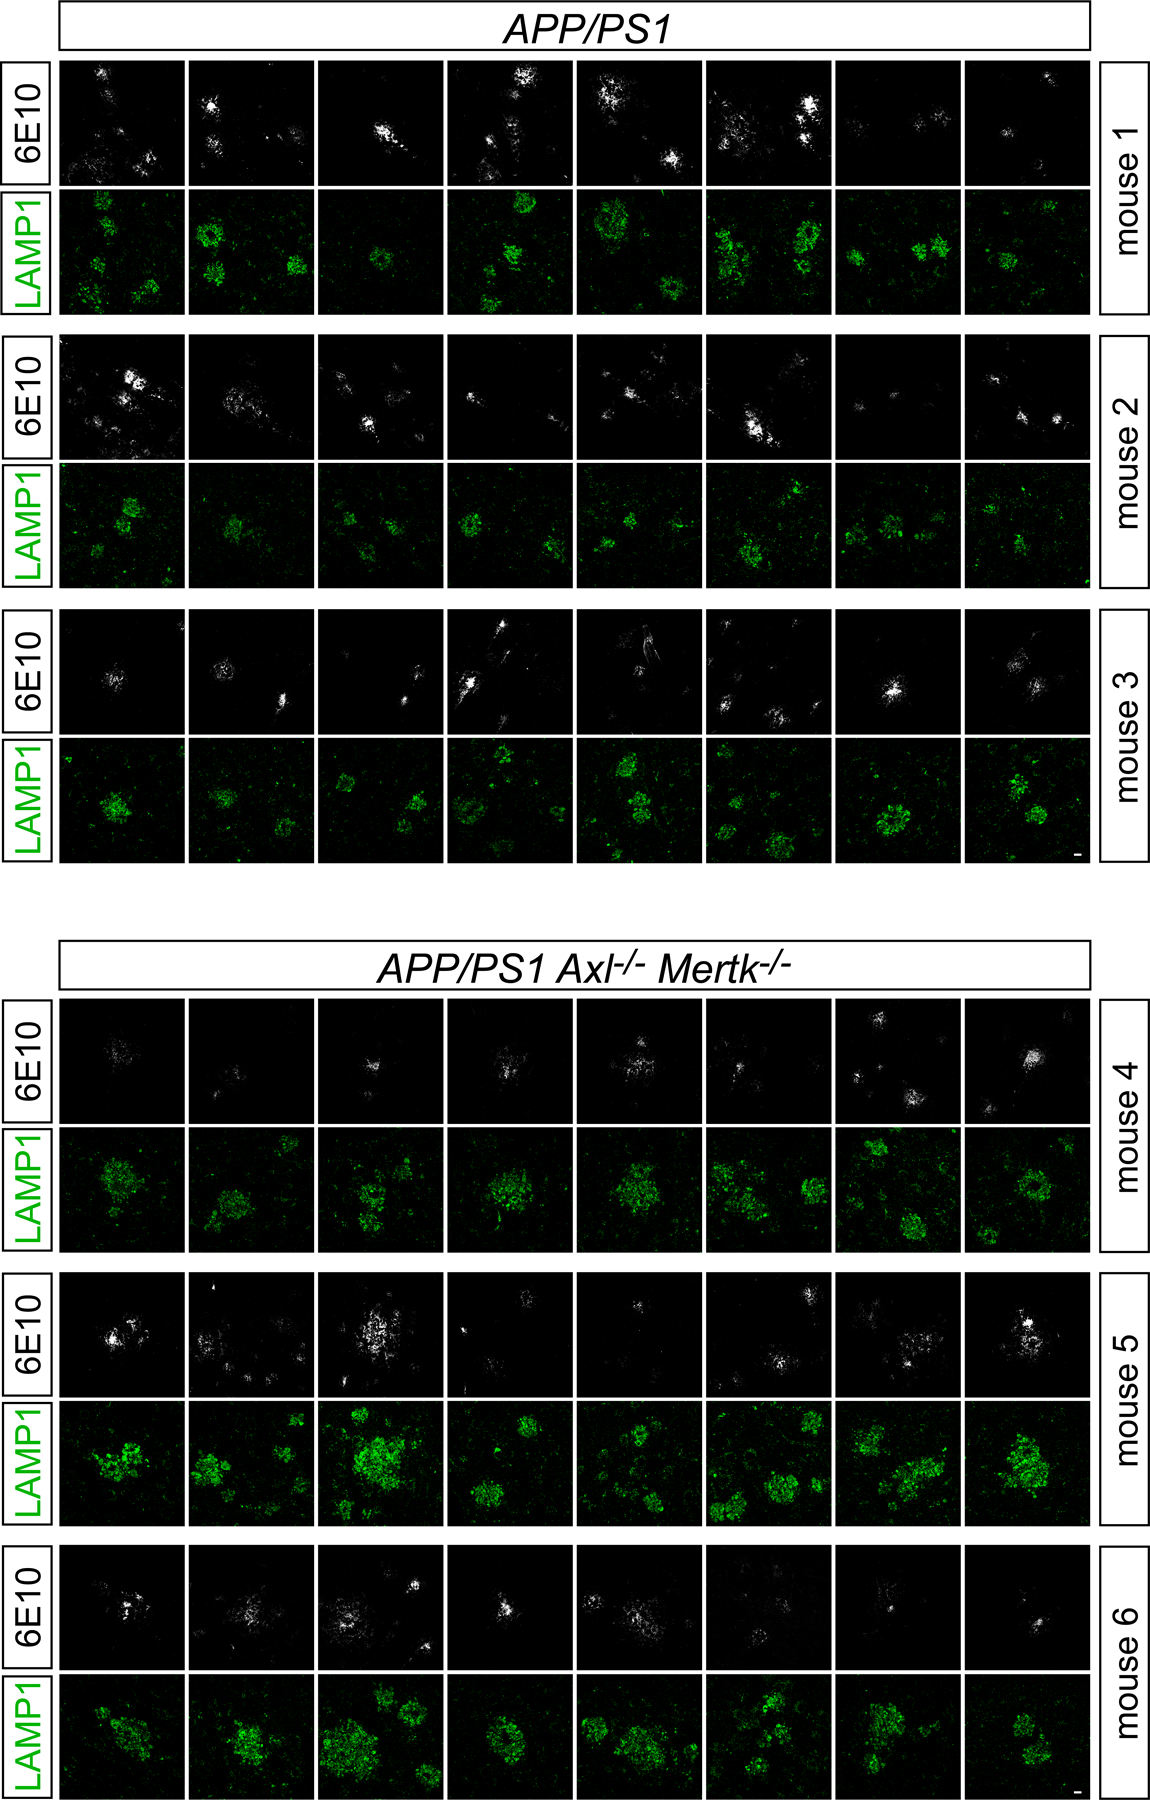
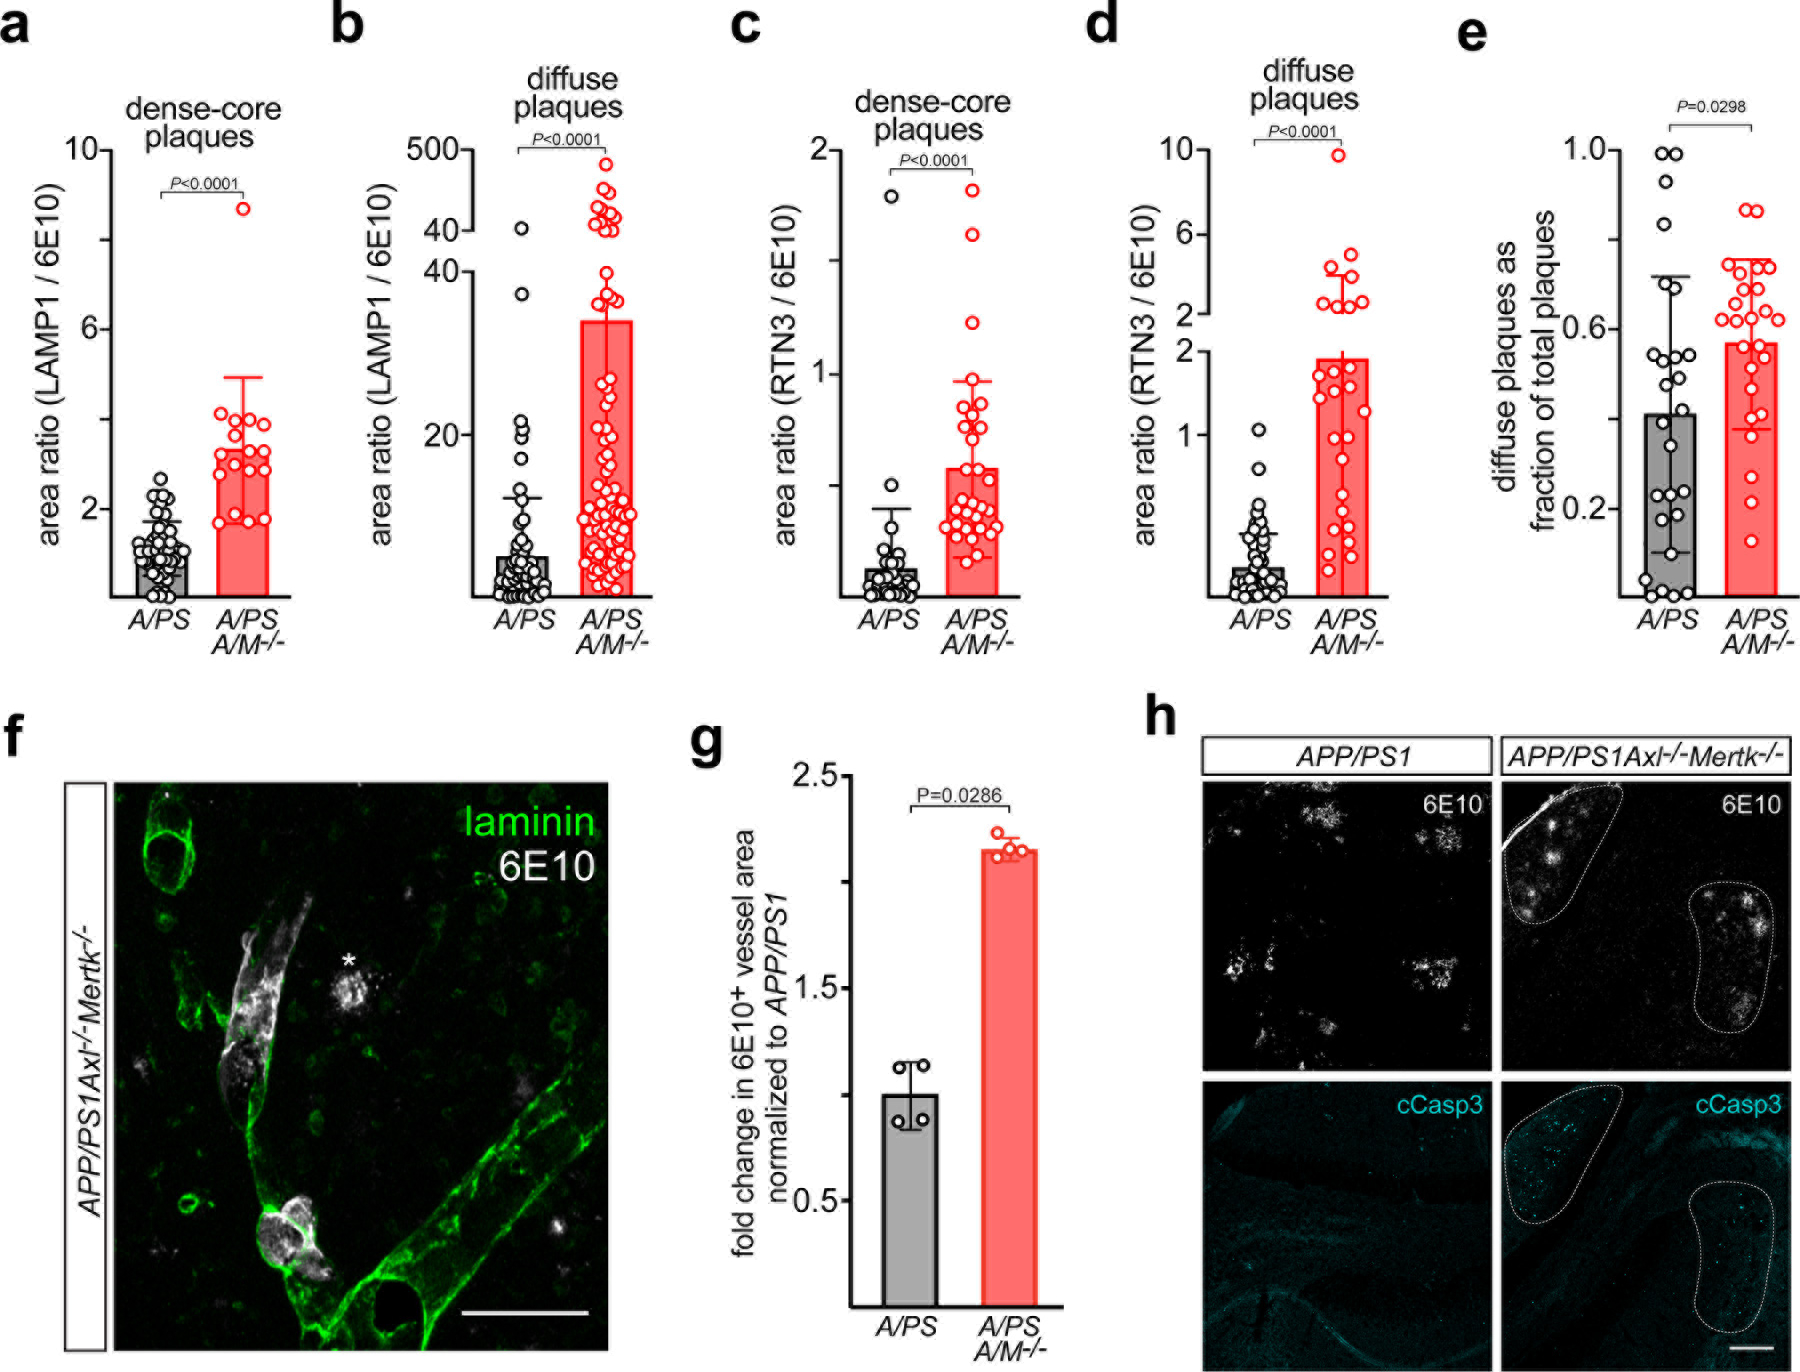
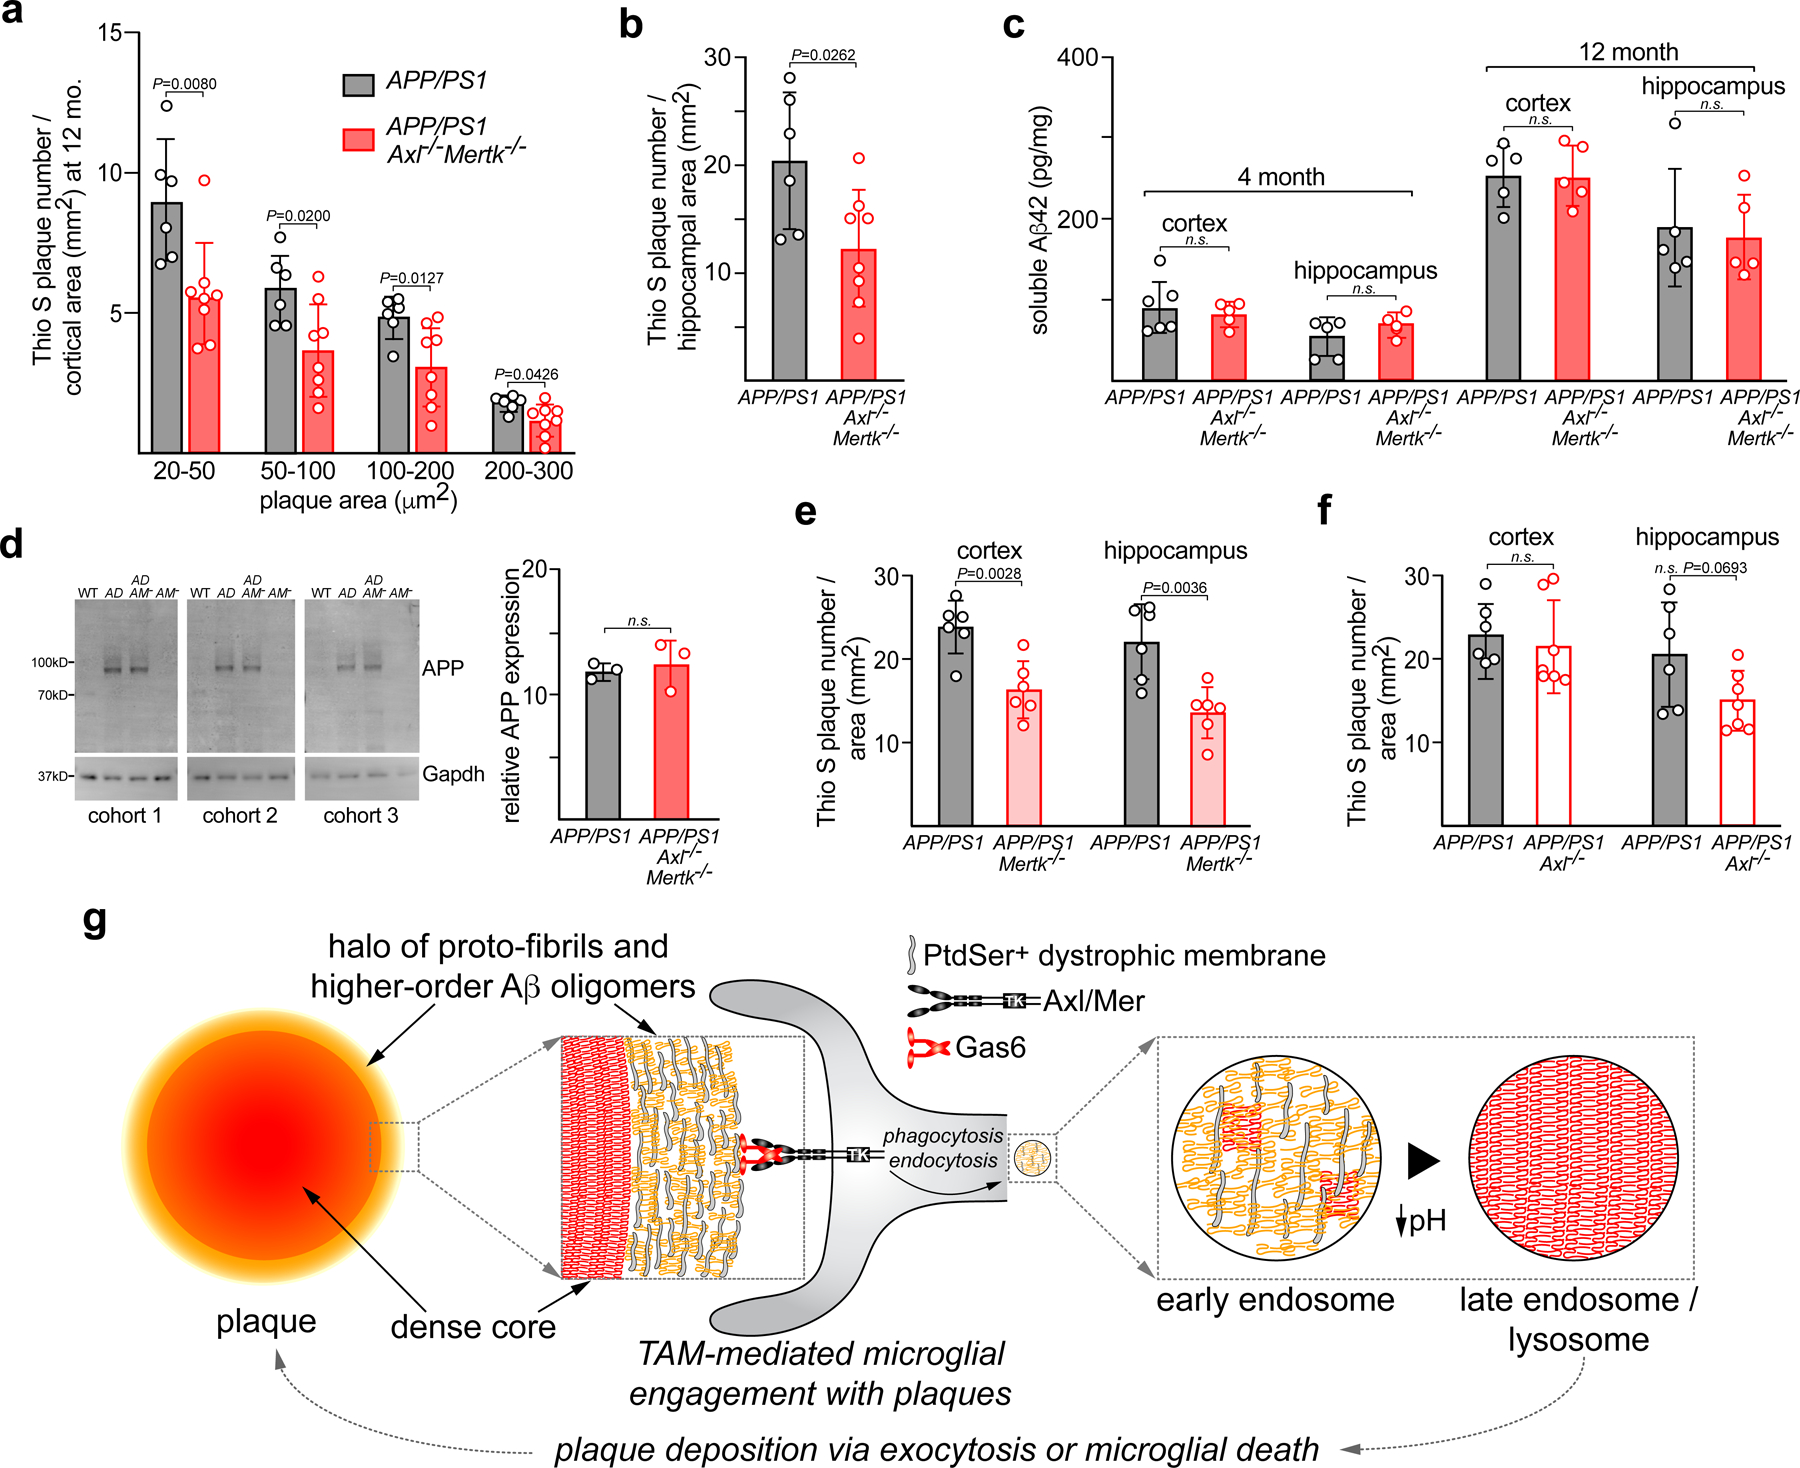
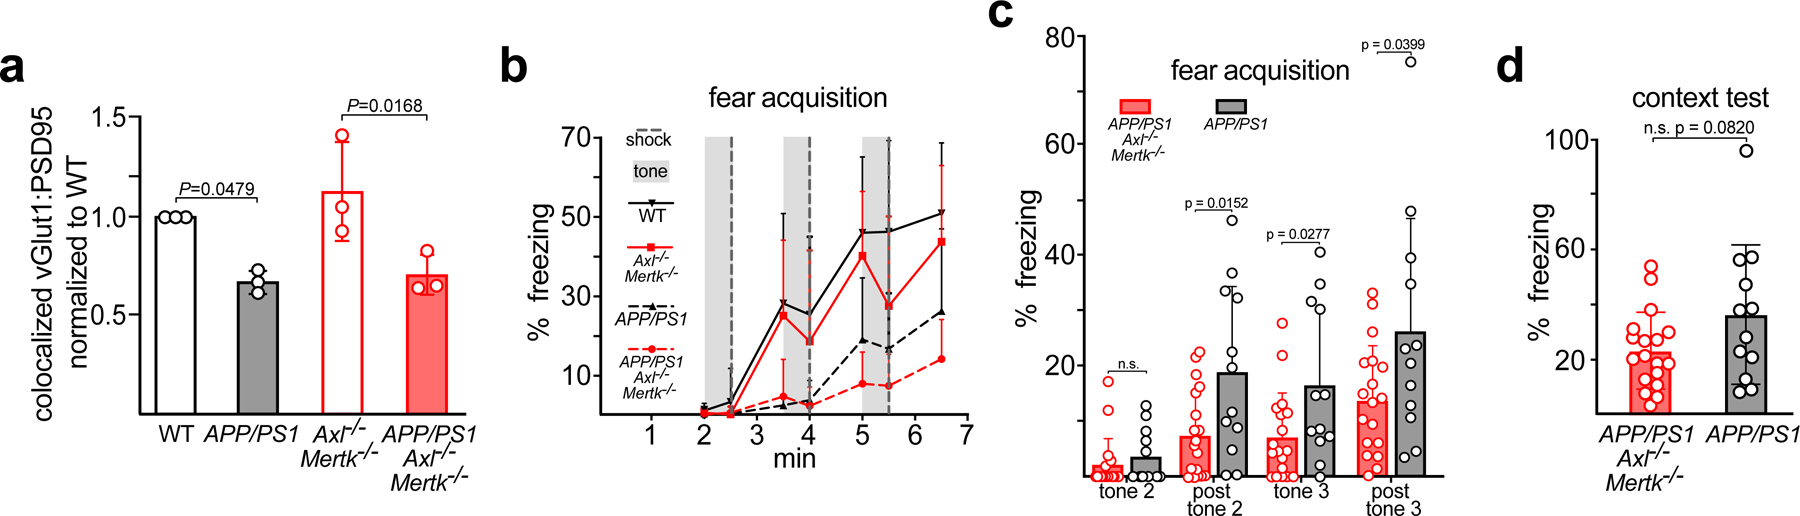
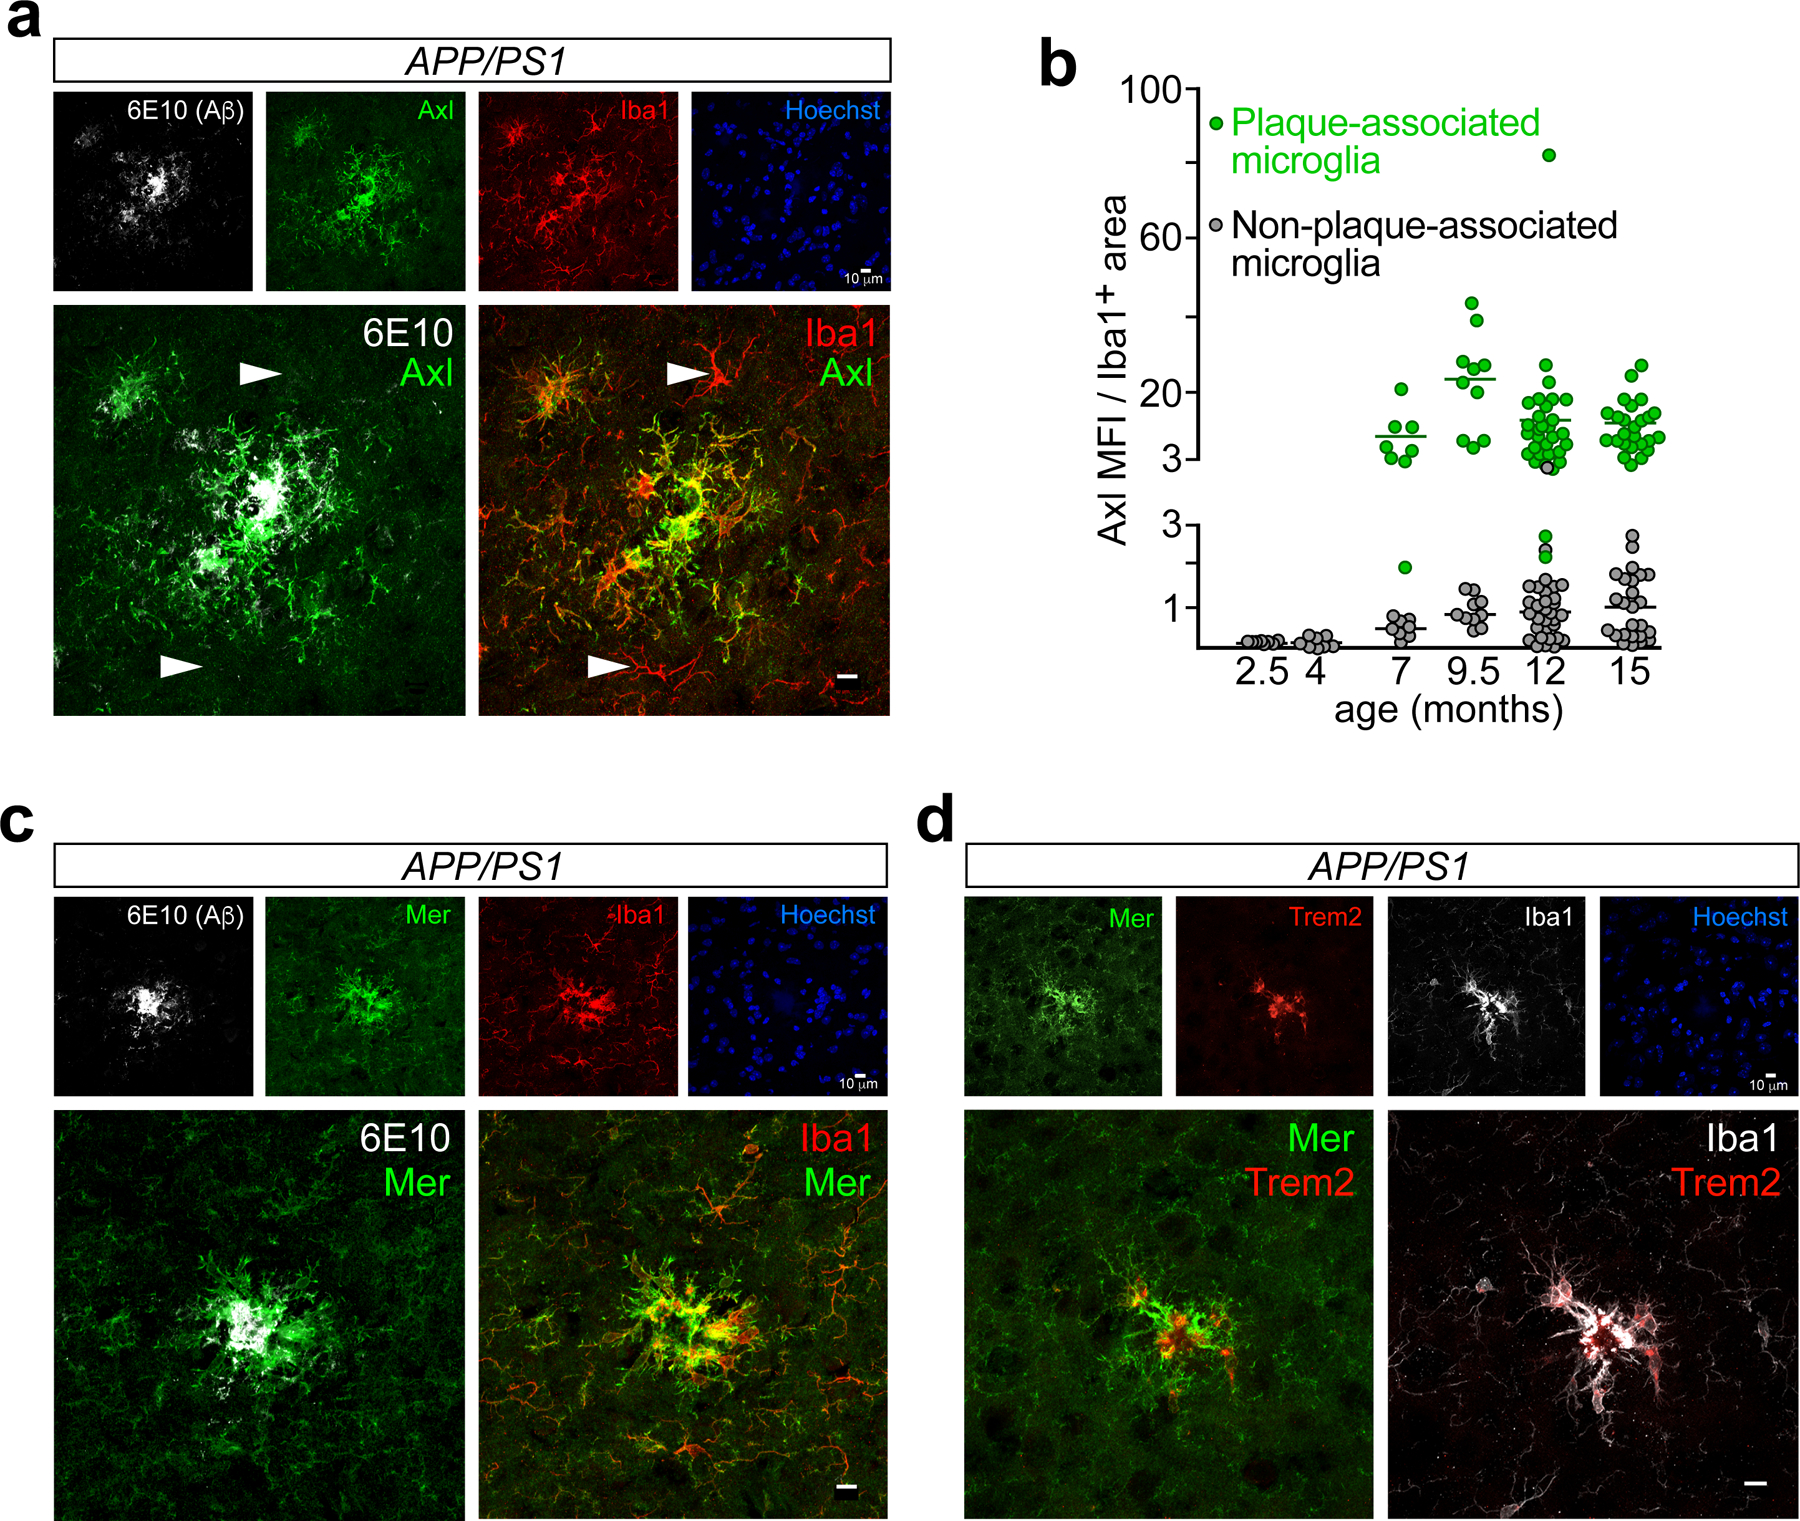
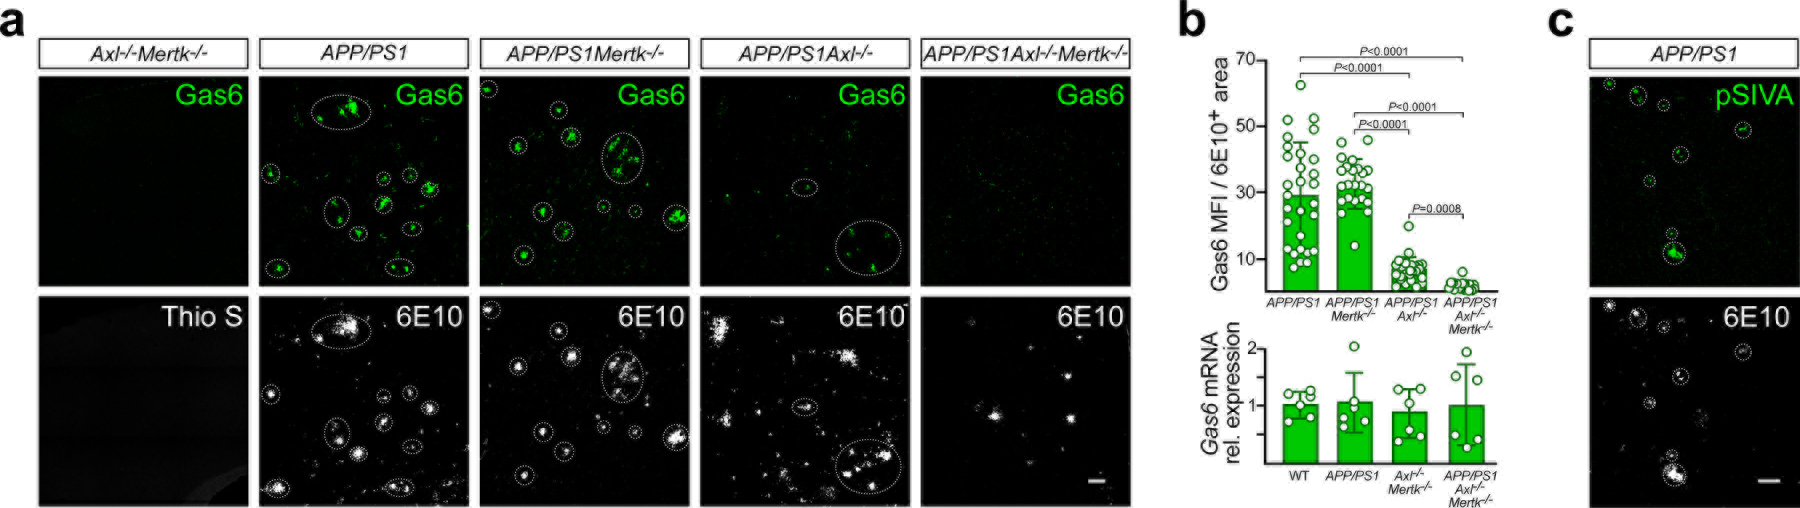
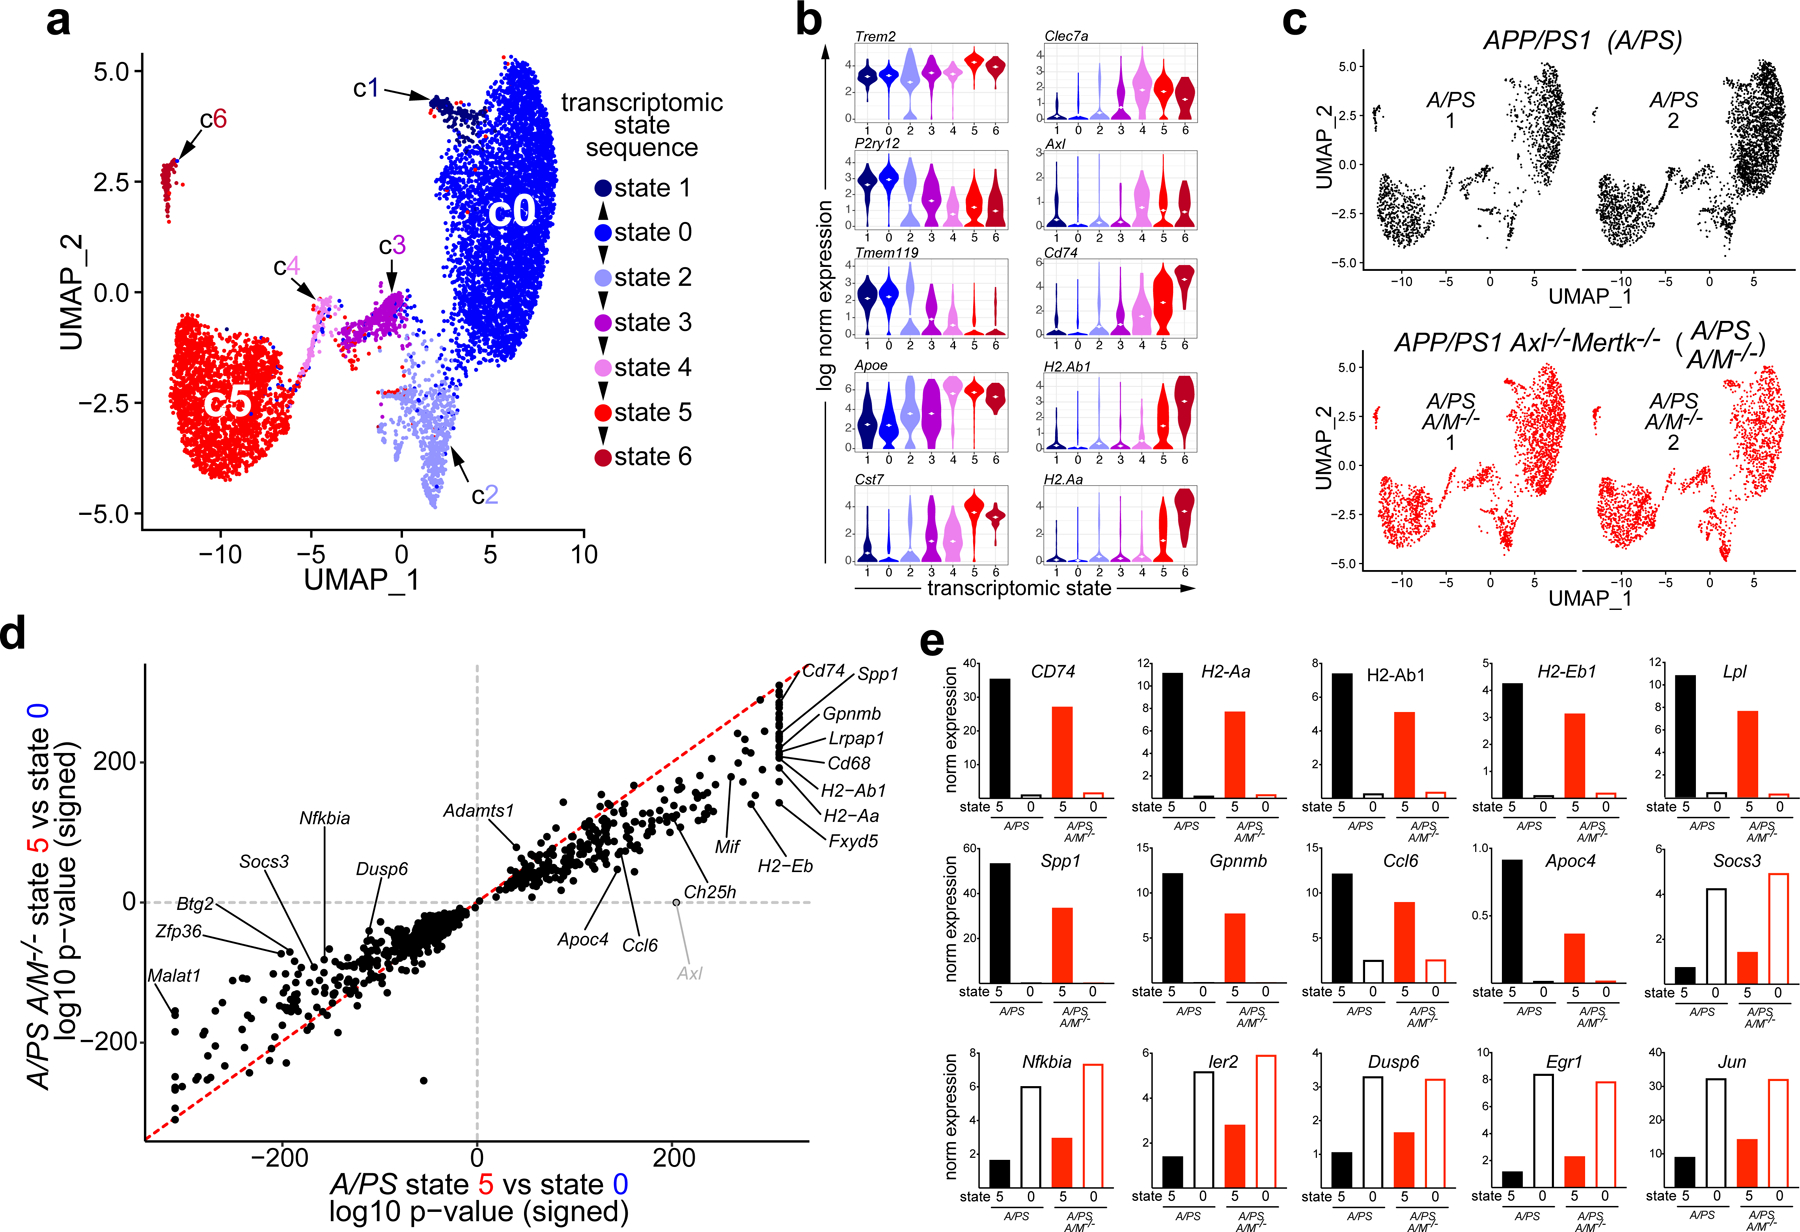
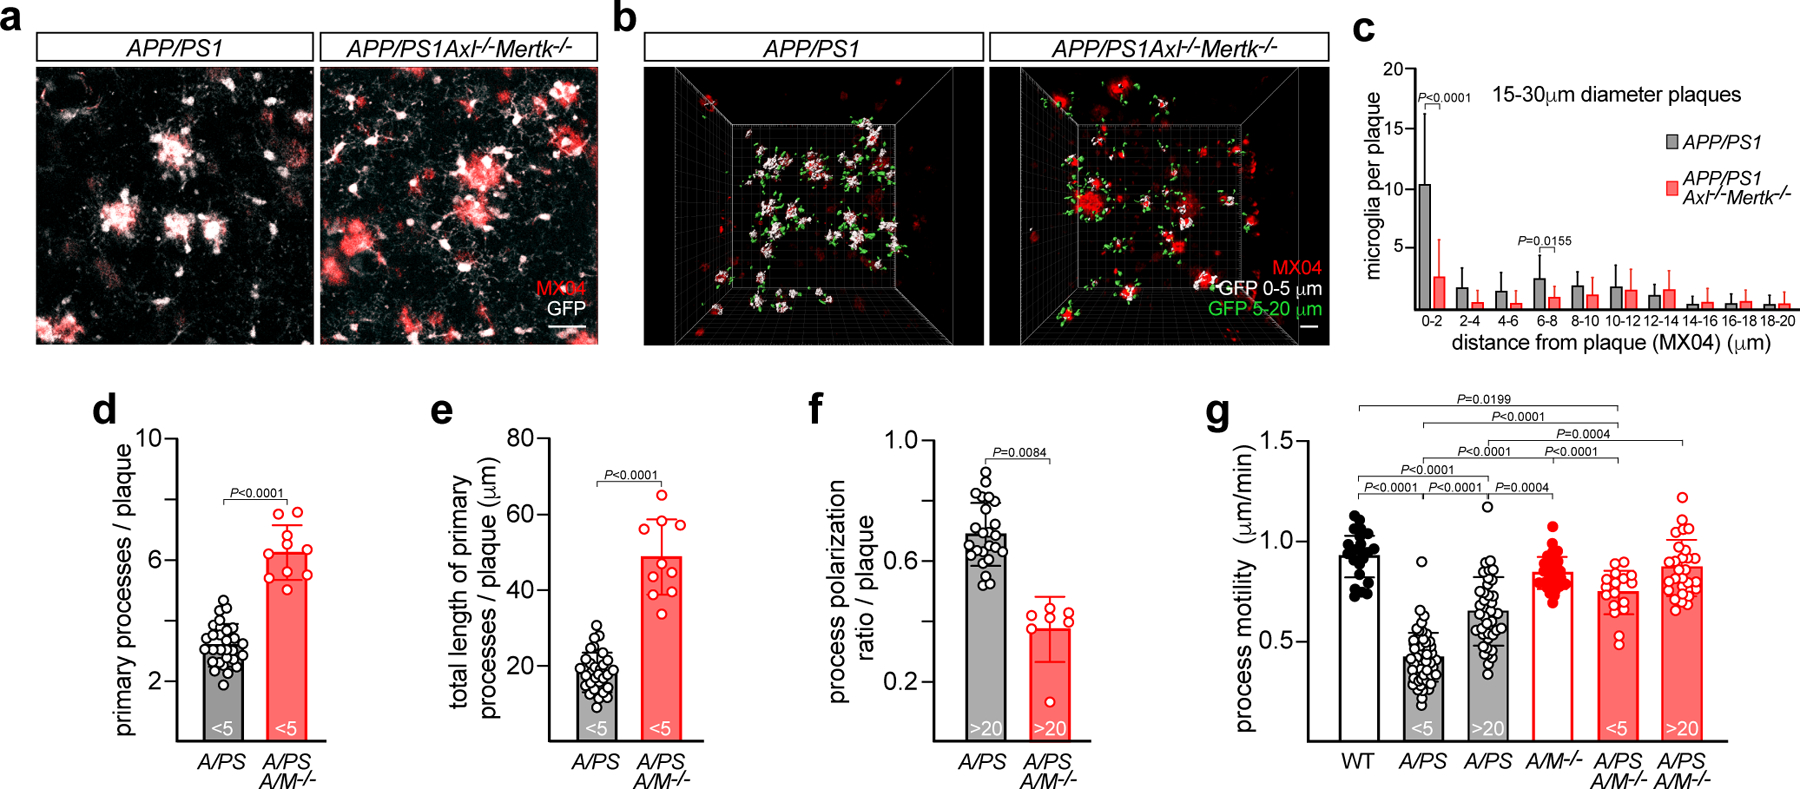
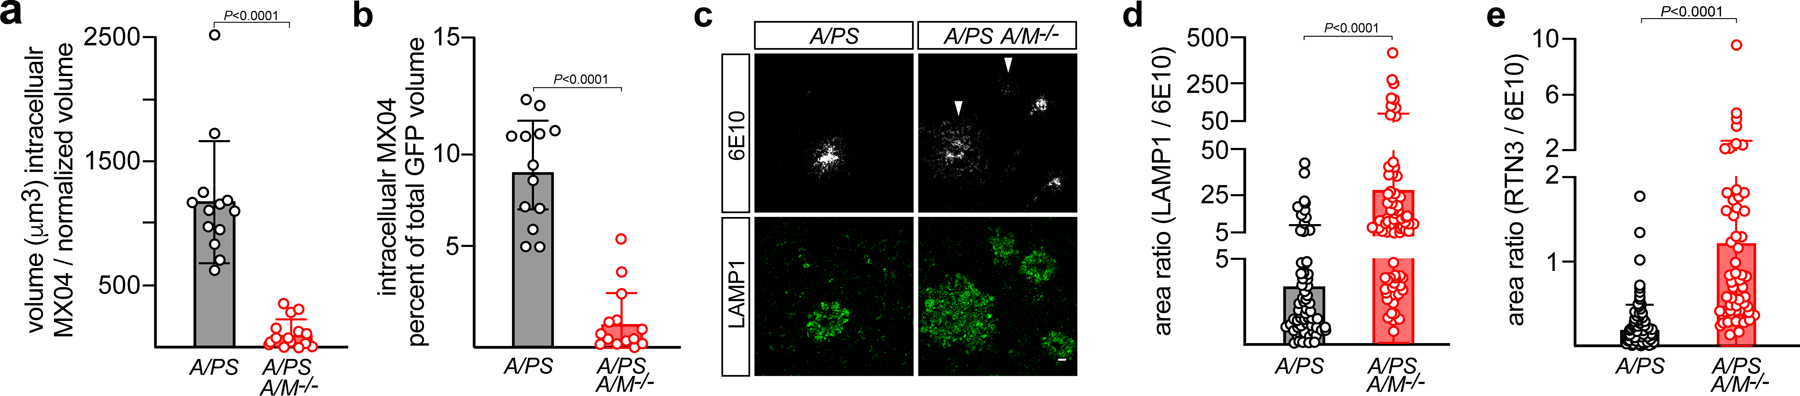
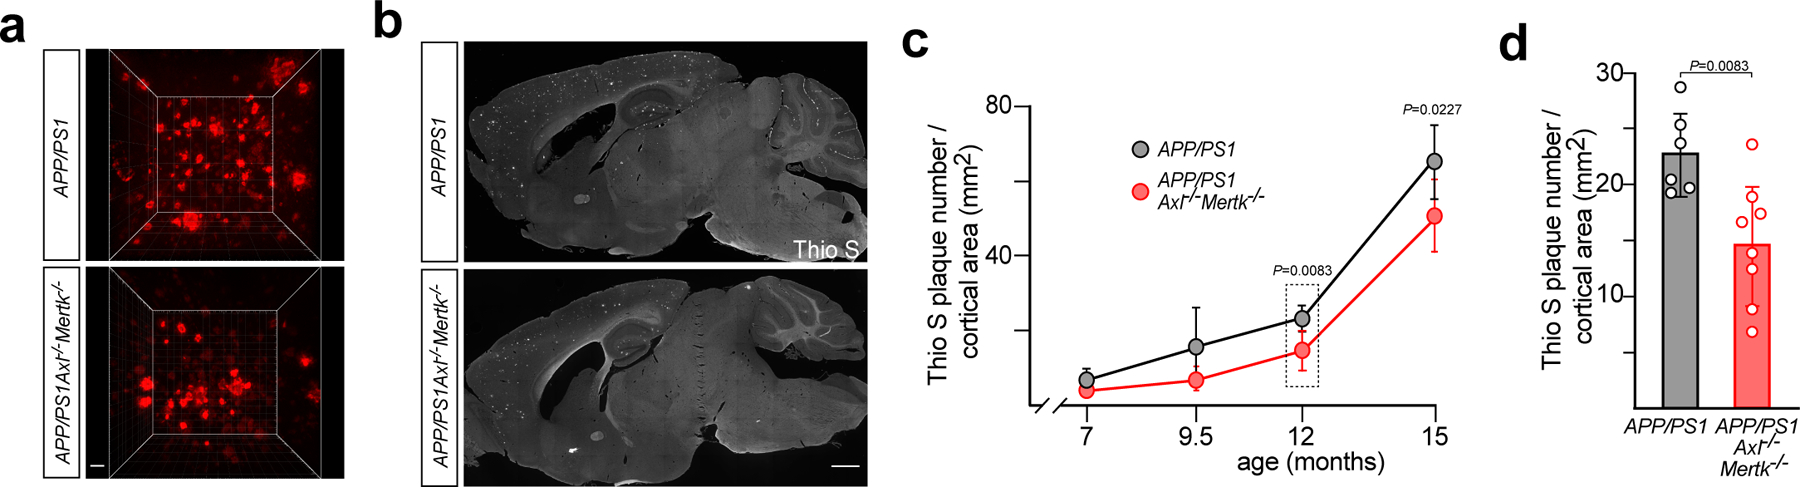
Two microglial TAM receptor tyrosine kinases, Axl and Mer, have been linked to Alzheimer's disease, but their roles in disease have not been tested experimentally. We find that in Alzheimer's disease and its mouse models, induced expression of Axl and Mer in amyloid plaque-associated microglia was coupled to induced plaque decoration by the TAM ligand Gas6 and its co-ligand phosphatidylserine. In the APP/PS1 mouse model of Alzheimer's disease, genetic ablation of Axl and Mer resulted in microglia that were unable to normally detect, respond to, organize or phagocytose amyloid-β plaques. These major deficits notwithstanding, TAM-deficient APP/PS1 mice developed fewer dense-core plaques than APP/PS1 mice with normal microglia. Our findings reveal that the TAM system is an essential mediator of microglial recognition and engulfment of amyloid plaques and that TAM-driven microglial phagocytosis does not inhibit, but rather promotes, dense-core plaque development.


Conflict of interest statement

Competing interests: The authors declare no competing interests.

Figures

Extended Data Fig. 1
Extended Data Fig. 1. Expression of Axl, Mer, TMEM119, Trem2, and GFAP in plaque-burdened AD brains.
(a) Axl protein (green, lower panels) is undetectable in WT (left) and APP/PS1 (right) microglia (Iba1, red, upper panels) in the 4mo cortex, prior to the appearance of plaques in APP/PS1 mice. n = 3 per genotype. (b) Axl protein (green) in 15 mo APP41 mice (n = 3) is up-regulated in cortical microglia (Iba1, red) contacting Aβ plaques (6E10, white), and is also often concentrated in plaque centers, consistent with strong prior activation of Axl and subsequent cleavage of its ectodomain. (As is seen for other RTKs, robust activation of Axl results in nearly complete cleavage of the ectodomain from the cell surface.) Hoechst 33258 stains nuclei. (c) Expression of Mer protein (green) in 15 mo APP41 mice is seen in all cortical microglia (Iba1, red), but is further up-regulated in microglia that invest Aβ plaques (6E10, white). (d) Quantification of Mer up-regulation in Iba1+ plaque-associated microglia (PAM) versus non-plaque-associated microglia (NPAM) in APP/PS1 mice at 9.5 months. (e) Axl (green) and Trem2 (red) are up-regulated in the same Iba1+ (white) microglia cell in the 9.5 mo APP/PS1 cortex. (f) Expression of the homeostatic microglial marker TMEM119 (green) is lost in cortical microglia that surround plaques (6E10, white) in 15 mo APP41 mice, except for an occasional 1–2 cells at the center of plaques. (g) This same TMEM119 down-regulation is seen in 15 mo APP/PS1 mice. TMEM119 microglia surrounding 6E10+ plaques are strongly Iba1+. (h) The up-regulated Mer expression (green) seen in 15 mo APP41 mice is not in GFAP+ reactive astrocytes (red). (Activated S100b+ astrocytes are also negative for Mer expression by IHC). Circles mark the position of Aβ plaques. Representative images obtained from immunostaining of N ≥ 3 sections from n ≡ 3 mice of each genotype. Scale bars: 10μm (ac, e, h), 100μm (f, g). Mann-Whitney test (d). For all supplementary figure panels, data are represented as mean ±1 STD.
Extended Data Fig. 2
Extended Data Fig. 2. Gas6 and PtdSer decoration of Aβ plaques.
(a) Gas6 protein (green) decorates 6E10+ plaques (white) on sections of postmortem cortex from human patients with advanced (BRAAK stage 6) AD (left panels), but is not evident in the plaque-free cortex of cognitively normal age-matched controls (right panels). Representative images obtained from immunostaining of ≥3 sections from 3 individuals of each condition. (b) Visualization of externalized PtdSer in 15 mo APP/PS1 cortex following stereotaxic injection of pSIVA (green, left panel). pSIVA binds to externalized PtdSer in the needle track of the injection, where cells are damaged and undergoing apoptosis, and also to the PtdSer associated with all 6E10+ amyloid plaques adjacent to the injection site (white, right panel.) (c) A similar pSIVA injection in 15 mo WT mice labels only the needle track of the injection, since there are no plaques in these mice. (d) Airyscan super-resolution image of the juxtaposition of plaque-associated microglia (Iba1, red), Gas6 (green), and Aβ plaque (6E10, white) in 12 mo APP/PS1 mice (n = 5). Scale bars: 100μm (a), 50μm (b), 200μm (c), 10μm (d). n = 3 and 2 for APP/PS1 and WT control, respectively (b, c) from two independent experiments.
Extended Data Fig. 3
Extended Data Fig. 3. Transcriptomics of APP/PS1 and APP/PS1Axl−/−Mertk−/− microglia as quantified by single cell RNA-seq
(a) Sorting scheme for isolation of CD45+ single cells. FSC and SSC, forward and side scatter, respectively. A, area; W, width. (b) Uniform manifold approximation and projection (UMAP) clustering of CD45+ cells sorted from 18 mo APP/PS1 (A/PS) and APP/PS1Axl−/−Mertk−/− (A/PS A/M−/−) cortices (combined) and annotated using the 18 marker genes in b. (c) Violin plots of population log-transformed normalized expression of the indicated genes in the indicated cell types. Cell type key applies to a and b. (d) Log-transformed normalized expression of Axl (left) and Mertk (right) mRNA in APP/PS1 cells within the microglial clusters defined in Fig. 3a. (e) Heat map of the scaled expression levels of the indicated genes in individual cells within transcriptomic state (cluster) 0 and state 5 microglia in the APP/PS1 cortex at 18 mo. (f) Comparative composite heat maps for the indicated genes across stages and transcriptomic states in 5xFAD and APP/PS1 mice, as quantified in this study (top five rows) and in Keren-Shaul et al. (bottom three rows), respectively. Values shown as z-scaled log-transformed normalized average of each group. (g) Violin plots of the log-transformed normalized expression distribution of the indicated genes at transcriptomic state 5 in A/PS (black) versus A/PS A/M−/− (red) microglia, as determined by single cell RNA-seq (scRNA-seq). Dotted lines indicate mean. (h) Mean expression level of the indicated cytokine and chemokine genes in state 5 versus state 0 microglia in A/PS (black) versus A/PS A/M−/− (red) microglia at 18 mo, as determined by scRNA-seq. (i) Relative expression level of the indicated inflammatory regulator mRNAs in RNA isolated from total cortex of mice of the indicated genotypes at 12 mo, as determined by qRT-PCR. n = 3–6. Kruskal-Wallis test with Dunn’s multiple comparison test. Data are represented as mean ±1 STD.
Extended Data Fig. 4
Extended Data Fig. 4. APP/PS1Axl−/−Mertk−/− microglia are unresponsive to Aβ plaques
(a) Distribution of distance of microglial cell body centroids, in 2μm bins, from the edge of MX04-labeled Aβ plaques with diameters of 10–15μm in APP/PS1 (gray) and APP/PS1Axl−/−Mertk−/− (red) cortex. Values obtained for 56 and 23 plaques from 3 and 4 mice for APP/PS1 and APP/PS1Axl−/−Mertk−/−, respectively. (b) Number of imaged GFP+ primary processes per PAM (microglia <5μm from plaques) in APP/PS1 (gray, A/PS) and APP/PS1Axl−/−Mertk−/− (red, A/PS A/M−/−) cortex. (c) Summed length of primary microglial processes per PAM in APP/PS1 (gray) and APP/PS1Axl−/−Mertk−/− (red) cortex. (d) Process polarization ratio to nearest plaque per NPAM (microglia >20μm from plaques; see Materials and Methods) in APP/PS1 (gray) and APP/PS1Axl−/−Mertk−/− (red) cortex. (e) Quantification of microglial cell density in the cortex of 16 mo APP/PS1 (gray) and APP/PS1Axl−/−Mertk−/− (red) mice for microglia 0–10 μm, 10–20 μm, and >20 μm from the edge of the nearest plaque. Data points are from 45–129 cells (PAM) investing 10–29 plaques (b, c), and 21–49 cells peripheral to 7–24 plaques (d) from n = 3 mice per genotype (bd). Points in e represent 3–5 imaging volumes from 3 APP/PS and 4 APP/PS1Axl−/−Mertk−/− mice. Two-way ANOVA with Sidak’s multiple comparison test (a, e) and Mann-Whitney’s test (b-d). Data are represented as mean ±1 STD.
Extended Data Fig. 5
Extended Data Fig. 5. Expansive areas of plaque-associated dystrophic LAMP1+ membrane and poorly compacted plaques in the APP/PS1Axl−/−Mertk−/− brain.
A montage of 24 paired sections in both APP/PS1 (top six rows) and APP/PS1Axl−/−Mertk−/− (bottom six rows) cortex, each stained with antibodies to both LAMP1 (green) and 6E10 (white). Each 6E10 image is paired with (from the same section as) the LAMP image immediately below. This montage, which is a subset of the images used to generate the data in Fig. 5d, is composed of images taken from three different mice of each genotype at 12 months. Note that: (a) 6E10+ Aβ plaques are in general more compact and brightly stained in APP/PS1 mice and more diffuse and weakly stained in APP/PS1Axl−/−Mertk−/− mice; and (b) the area occupied by LAMP1+ membrane is in general much larger in APP/PS1Axl−/−Mertk−/− mice. Scale bars: 10μm.
Extended Data Fig. 6
Extended Data Fig. 6. Accumulation of LAMP1+ dystrophic membrane and apoptotic cell debris in the APP/PS1Axl−/−Mertk−/− brain.
(a) Quantification of LAMP1/6E10 area ratio as in Fig. 5d, but only for dense-core plaques (plaques with solid 6E10+ cores with areas > 100μm2). (b) Quantification of LAMP1/6E10 area ratio as in Fig. 5d, but only for diffuse plaques (plaques without solid 6E10+ cores with areas > 100μm2). (c) Quantification of RTN3/6E10 area ratio as in Fig. 5e, but only for dense-core plaques. (d) Quantification of RTN3/6E10 area ratio as in Fig. 5e, but only for diffuse plaques. (e) Quantification of the density of diffuse plaques (defined as above) expressed as a fraction of total plaques in the cortex of mice of the indicated genotypes at 12 mo. Data represent diffuse plaques quantified from N = 4–5 sections from n= 6 mice per group. (f) Representative example of cerebral amyloid angiopathy (CAA) in the cortex of a 15 mo APP/PS1Axl−/−Mertk−/− mouse. 6E10+ Aβ material (white) is evident within laminin+ blood vessels (green). Asterisk marks an Aβ plaque in the parenchyma. (g) Quantification (see Methods) of CAA in the somatosensory cortex of 15 mo APP/PS1Axl−/−Mertk−/− mice (A/PS A/M−/−) relative to APP/PS1 mice (A/PS). n=4/group and measurements were averaged from N ≥ 15 sections (spanning ≥ 1.8mm3 of brain volume) per mouse. (h) cCasp3+ apoptotic debris (cyan, lower panels) accumulates around 6E10+ Aβ plaques (upper panels) in the APP/PS1Axl−/−Mertk−/− (right panels) but not the APP/PS1 (left panels) hippocampus at 12 mo. Images are representative of n = 3 mice per genotype from three independent experiments. Scale bars: 100μm. Data are 18–47 (a), 67–78 (b), 30–43 (c) and 26–52 (d) plaques investigated from N ≥ 3 sections per mouse from n = 3 mice of each genotype from at least 3 independent replicates. Mann-Whitney test (ae, g). Data are represented as mean ±1 STD.
Extended Data Fig. 7
Extended Data Fig. 7. TAM (Mer) signaling promotes dense-core Aβ plaque accumulation with functional consequences.
(a) Thio S plaque density in APP/PS1 (gray) versus APP/PS1Axl−/−Mertk−/− (red) cortex for plaques of the indicated size at 12 months. (b) Thio S+ plaque density (all plaque sizes) in APP/PS1 (gray) versus APP/PS1Axl−/−Mertk−/− (red) hippocampus at 12 months. (c) Soluble Aβ42 levels quantified in APP/PS1 (gray) versus APP/PS1Axl−/−Mertk−/− (red) cortex and hippocampus at 4 and 12 mo, as indicated. n= 5–6 per genotype. (d) Quantitative LI-COR western blot measurement of APP protein levels in the 12 mo cortex of 3 cohorts of mice (4 genotypes each cohort) of the indicated genotypes demonstrates no change in APP expression in APP/PS1 mice upon mutation of Axl and Mertk. Blots left and quantification right. (e) ThioS+ plaque density (all plaque sizes) in APP/PS1 (gray) versus APP/PS1Mertk−/− (pink) cortex and hippocampus at 12 months. (f) Thio S+ plaque density (all plaque sizes) in APP/PS1 (gray) versus APP/PS1Axl−/− (white) cortex and hippocampus at 12 months. Data points represent plaque density in n= 6–8 mice of the indicated genotypes averaged from N ≥ 5 cortical sections for each brain. Mann-Whitney test (a, c, d, i, j) and Student’s t-test (b, e, f). Data are represented as mean ±1 STD. (g) TAM-mediated microglial recognition, phagocytosis, and consolidation of Aβ plaques. Microglial Axl and Mer are bridged to the PtdSer-rich dystrophic membranes of plaques via TAM ligands, whose amino-terminal and carboxy-terminal domains bind PtdSer and Axl/Mer, respectively, . Gas6 is shown, but a role for the Mer ligand Pros126 is not excluded. Engagement of the PtdSer-TAM ligand-TAM receptor complex activates the TAM tyrosine kinases (TK), which drives phagocytosis of forming plaque material. Internalized phagocytic cargo is eventually transferred to lysosomes, whose acidic interiors promote the aggregation of large, insoluble Aβ fibrils. Exocytosis or microglial death then delivers this aggregated material to growing dense-core plaques.
Extended Data Fig. 8
Extended Data Fig. 8. Functional consequences of TAM deletion in APP/PS1 mice.
(a) Quantification of the 3D colocalization of the excitatory pre- and post-synaptic markers vGlut1 and PSD95 in the 15mo hippocampus (CA1) (see Methods), as an index of synaptic connectivity. The previously documented decrease in co-localization of these markers in APP/PS1 mice is not altered by the combined mutation of Axl and Mertk. Stack size is 85 × 85 ×3 μm3 per image, averaged 3 images per CA1 section across 3–5 sections per mouse. Data points represent synaptic density index in n = 3 mice of the indicated genotypes. (b) Acquisition of association between a 30 s auditory tone and a subsequent co-terminal 2 s 0.5 mA foot shock, expressed as percent time immobile (% freezing) during the indicated intervals, over three successive trial intervals in 15 mo mice of the indicated genotypes (see Methods). (c) Data in b plotted for the indicated genotypes with the indicated statistical significance per interval. (d) Contextual fear memory as assayed by percent of a 3 minute interval in which mice of the indicated genotypes were immobile (% freezing) when returned to the same testing cage 24 h after the fear acquisition trials of h (see Methods). A cohort of group-housed male mice (n = 12–20/group) were used in the behavioral assay. Data points in h represent the mean % freezing of each group in the interval duration immediately prior to the point. Each data point in d is the % freezing of one animal in the duration of the testing period. Kruskal Wallis test followed by Dunn’s multiple comparison test (a) and Mann-Whitney test (c, d). Data are represented as mean ±1 STD.
Fig. 1.
Fig. 1.. TAM receptor up-regulation is strictly plaque-associated.
(a) Axl protein (green) in 9.5 mo APP/PS1 mice is up-regulated in microglia (Iba1, red) that are in contact with Aβ plaques (6E10, white), but not in microglia not contacting plaques (arrowheads in lower panels). Iba1 expression is also up-regulated in plaque-associated microglia. Hoechst stains nuclei. (b) Quantification of Axl mean fluorescence intensity (MFI) in cortical Iba1+ microglia in APP/PS1 mice over time reveals marked Axl up-regulation co-incident with the first deposition of plaques at ~5 mo, only in plaque-associated Iba1+ cells (green points). (c) Expression of Mer protein (green) in 9.5 mo APP/PS1 mice is seen in all cortical microglia (Iba1, red), but is further up-regulated in microglia that invest Aβ plaques (6E10, white). (d) The same cortical microglia that up-regulate Mer (green) and Iba1 (white) protein expression in 9.5 mo APP/PS1 mice also up-regulate expression of Trem2 (red). Lower panels in a, c, and d are enlargements of upper panels. a, c, and d contain representative images from N ≥ 3 sections per mouse from n = 3 mice from at least three independent replicates. Data in b were measured from N ≥ 3 images per mouse from n = 3 and 5 mice for 2.5 – 9.5 mo and 12 and 15 mo timepoints, respectively. All scale bars: 10μm.
Fig. 2.
Fig. 2.. Gas6 and phosphatidylserine decorate all Aβ plaques.
(a) There is no Gas6 protein (green) and are no plaques (Thio S, white, since 6E10 is human-specific) in the cortex of 12 mo WT (not shown) or Axl−/−Mertk−/− mice (left panels), but abundant Gas6 specifically associated with Aβ plaques (6E10, white) in APP/PS1 mice (second panels). Plaque-associated Gas6 is unchanged in APP/PS1Mertk−/− mice (third panels), severely reduced in APP/PS1Axl−/− mice (fourth panels), and eliminated entirely in APP/PS1Axl−/−Mertk−/− mice (fifth panels). Dotted ovals mark Gas6/6E10 coincidence. (b) (Upper graph) Quantification of results in a expressed as Gas6 MFI per 6E10+ area. (Lower graph) There is no change in the expression of cortical Gas6 mRNA between the indicated genotypes (n = 6 mice per group). (c) Externalization of PtdSer (detected with pSIVA, green, upper panel) in the cortex of 15 mo APP/PS1 mice is specific to 6E10+ Aβ plaques (lower panel). a and c contain representative images from N ≥ 3 sections from n = 4 and 3 mice of each genotype, respectively, from 3 and 2 independent replicates. a is quantified in b (upper). Data in b and all subsequent panels in the paper are represented as mean ±1 STD. Scale bars: 50μm. Kruskal Wallis test followed by Dunn’s multiple comparison test (b).
Fig. 3.
Fig. 3.. TAM regulation of the microglial transcriptome in disease.
(a) Seven microglial cell clusters (c) defining seven transcriptomic states in combined APP/PS1 and APP/PS1 Axl−/−Mertk−/− microglia at 18 mo, displayed by uniform manifold approximation and projection (UMAP). c0 and c5 comprise major homeostatic (NPAM) and activated (PAM) transcriptomic states, respectively. (b) Violin plots for expression distribution of the indicated genes for the indicated microglial transcriptomic states, as defined in a. Dotted lines indicate mean. (c) UMAP for individual biological replicates of APP/PS1 (A/PS) and APP/PS1 Axl−/−Mertk−/− (A/PS A/M−/−) microglia yields the same cluster number and mapping for all replicates. (d) Scatter plot for signed log10 adjusted p-value of shared differentially expressed (DE) genes between state 5 vs state 0 in A/PS and A/PS A/M−/− microglia, respectively. Log10 adjusted p-value was signed by the up/down-regulation of the gene. Grey dot indicates where Axl would have been, since it was only differentially expressed in A/PS. (e) Normalized mean microglial expression of the indicated genes in transcriptomic state 0 versus 5, in A/PS (black) versus A/PS A/M−/− (red) microglia. DE analysis was performed by Seurat function “FindAllMarkers” and “FindMarkers” with default Wilcoxon Rank Sum test and logFC > 0.25 on pooled biological replicates. Genes with Bonferroni adjusted p-value < 0.05 were considered to be significant.
Fig. 4.
Fig. 4.. Microglia use Axl and Mer to detect, engage, and react to Aβ plaques.
(a) Representative video stills from two-photon imaging of microglia (GFP signal, white) and amyloid plaques (MX04 signal, red) in 16 mo APP/PS1 and APP/PS1Axl−/−Mertk−/− cortex. (b) Imaris surface builds of microglial volumes at 0–5μm (white) and 5–20μm (green) from the edge of nearest plaque (red) in APP/PS1 and APP/PS1Axl−/−Mertk−/− cortex, representative of image volumes in cortices of n = 3 APP/PS1 and 5 APP/PS1 Axl−/−Mertk−/− mice. Scale bars: 30μm. (c) Distribution of distances of microglial cell body centroids from the edge of Aβ plaques in APP/PS1 and APP/PS1Axl−/−Mertk−/− cortex. 22 and 37 plaques were investigated from 3 and 4 mice for APP/PS1 and APP/PS1Axl−/−Mertk−/−, respectively. (d) Primary microglial processes per nearest plaque for microglia <5μm from plaques (PAM) in APP/PS1 (A/PS) and APP/PS1Axl−/−Mertk−/− (A/PS A/M−/−) cortex. (e) Summed length of primary microglial processes per nearest plaque for PAM in APP/PS1 and APP/PS1Axl−/−Mertk−/− cortex. (f) Process polarization to nearest plaque (ratio of summed length of primary processes oriented toward plaque to summed length of all primary processes) for NPAM (microglia >20μm from plaques) in APP/PS1 and APP/PS1Axl−/−Mertk−/− cortex. (g) Process motility for cortical PAM, NPAM, and non-diseased microglia in mice of the indicated genotypes. Data points are from 7–29 representative plaques from n = 3 mice from both genotypes (df), and 18–52 microglia from 2 (WT and Axl−/−Mertk−/−) and 3 (APP/PS1 and APP/PS1Axl−/−Mertk−/−) mice (g). Data represented as mean ±1 STD. Mann-Whitney test (d-f) and Kruskal Wallis test followed by Dunn’s multiple comparison test (g).
Fig. 5.
Fig. 5.. TAM-deficient microglia can neither phagocytose nor organize plaques.
(a, b) MX04-labeled Aβ plaque material engulfed within GFP+ microglia, imaged in vivo, in 16 mo. APP/PS1 (A/PS) versus APP/PS1Axl−/−Mertk−/− (A/PS A/M−/−) cortex, normalized to imaging volume (a) and the volume of GFP+ cells (b). (c) Representative images of the halo of LAMP1+ dystrophic membranes (green, lower panels) that surround 6E10+ plaques in 12 mo APP/PS1 (A/PS; left) versus APP/PS1Axl−/−Mertk−/− (A/PS A/M−/−; right) cortex. Arrowheads mark weakly-staining, diffuse 6E10+ plaques, which are more common in the APP/PS1Axl−/−Mertk−/− brain (see also Extended Data Fig. 5). Scale bar: 10μm. (d) Quantification of the ratio of LAMP1+ area to 6E10+ plaque area across all plaque sizes, both dense-core and diffuse. (e) Quantification of ratio RTN3+ area to 6E10+ plaque area across all plaque sizes, both dense-core and diffuse. Data are 13–15 volumetric images from n= 3 and 4 mice for APP/PS1 and APP/PS1Axl−/−Mertk−/−, respectively (ab). Data are 94–113 plaques (d) and 56–95 plaques (e) investigated from N ≥ 3 sections per mouse from n = 3 mice of each genotype. Mann-Whitney test (a, b, d, e). Data represented as mean ±1 STD.
Fig. 6.
Fig. 6.. TAM-driven microglial phagocytosis favors dense-core plaque formation.
(a) Representative two-photon imaging volumes (X and Y 350μm, Z 300μm) of MX04-labeled plaques in 16 mo APP/PS1 and APP/PS1Axl−/−Mertk−/− cortex, as observed in image volumes in cortices of n = 3 (APP/PS1) and 5 (APP/PS1 Axl−/−Mertk−/−) mice. Scale bar: 30μm. (b) Representative sagittal sections from 12 mo APP/PS1 and APP/PS1Axl−/−Mertk−/− brains from at least 3 independent replicates, stained for dense-core plaques with thioflavin S (Thio S), quantified in d and Extended Data Fig. 7a, b. Scale bar: 1mm. (c) Quantification (see Methods) of Thio S-labeled dense-core Aβ plaque density, for cross-sectional plaque areas of all sizes, in APP/PS1 (gray) and APP/PS1Axl−/−Mertk−/− (red) cortex over time. Boxed data at 12 mo are detailed in d. n=4–8 per genotype per time point. (d) Thio S-labeled plaque density in cortex (of APP/PS1 (gray) and APP/PS1Axl−/−Mertk−/− (red) mice at 12 mo. Data points represent plaque density in n= 6 APP/PS1 and 8 APP/PS1Axl−/−Mertk−/− mice of the indicated genotypes averaged from N = 5 cortical sections of each brain. Student’s t-test (c, d). Data represented as mean ±1 STD.

Comment in

Similar articles

Cited by

References

    1. Lemke G Biology of the TAM receptors. Cold Spring Harbor Perspectives 5(11), 10.1101/cshperspect.a009076. (2013). - DOI - PMC - PubMed
    1. Lu Q & Lemke G Homeostatic regulation of the immune system by receptor tyrosine kinases of the Tyro 3 family. Science 293, 306–311 (2001). - PubMed
    1. Lemke G How macrophages deal with death. Nat Rev Immunol 19, 539–549 (2019). - PMC - PubMed
    1. Scott RS et al. Phagocytosis and clearance of apoptotic cells is mediated by MER. Nature 411, 207–211 (2001). - PubMed
    1. Zagórska A, Través PG, Lew ED, Dransfield I & Lemke G Diversification of TAM receptor tyrosine kinase function. Nat Immunol 15, 920–928 (2014). - PMC - PubMed

Publication types

MeSH terms