. 2021 May;53(5):638-649.
doi: 10.1038/s41588-021-00840-z. Epub 2021 Apr 15.

A genome-wide atlas of co-essential modules assigns function to uncharacterized genes

Affiliations

A genome-wide atlas of co-essential modules assigns function to uncharacterized genes

Michael Wainberg et al. Nat Genet. 2021 May.

Abstract

A central question in the post-genomic era is how genes interact to form biological pathways. Measurements of gene dependency across hundreds of cell lines have been used to cluster genes into 'co-essential' pathways, but this approach has been limited by ubiquitous false positives. In the present study, we develop a statistical method that enables robust identification of gene co-essentiality and yields a genome-wide set of functional modules. This atlas recapitulates diverse pathways and protein complexes, and predicts the functions of 108 uncharacterized genes. Validating top predictions, we show that TMEM189 encodes plasmanylethanolamine desaturase, a key enzyme for plasmalogen synthesis. We also show that C15orf57 encodes a protein that binds the AP2 complex, localizes to clathrin-coated pits and enables efficient transferrin uptake. Finally, we provide an interactive webtool for the community to explore our results, which establish co-essentiality profiling as a powerful resource for biological pathway identification and discovery of new gene functions.


Conflict of interest statement

Competing interests

The authors declare no competing interests.

Figures

Extended Data Fig. 1|
Extended Data Fig. 1|. Co-essentiality profiling and the limitations of Pearson’s correlation.
a. The concept of co-essentiality: (left) a pair of functionally related genes are both essential in some cell lines and both non-essential in other lines. Essentiality can be quantified from CRISPR screens as the logarithm of the growth effect of the gene’s knockout (intuitively, the number of times fewer cells with the knockout doubled during the screen, compared to control cells). (Right) a pair of unrelated genes have uncorrelated essentiality across cell lines. b. Simulation of how biological relatedness between cell lines inflates Pearson’s correlation p-values. Duplicating each point 10 times with slight noise (analogous to duplicating each screen in 10 related lines) makes the previously non-significant (p = 0.6) blue correlation highly significant (p = 0.007) and the significant red correlation (p = 7 × 10⁻⁵) substantially more so (p = 2 × 10−103), despite similar correlation magnitudes.
Extended Data Fig. 2|
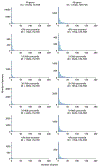
Extended Data Fig. 2|. Quantile-quantile plots for Pearson’s and GLS.
Quantile-quantile plots for Pearson’s correlation and GLS p-values (an alternate visualization of the p-value histograms in Fig. 1b). The observed p-values (y), sorted from largest to smallest, are plotted against the uniform distribution of p-values (x) expected under the null hypothesis.
Extended Data Fig. 3|
Extended Data Fig. 3|. Number of co-essential partners per gene by average gene essentiality.
Histograms of genes’ number of co-essential partners at 1% and 10% FDR as a function of the gene’s average essentiality (pre-bias-correction CERES score) across lines.
Extended Data Fig. 4|
Extended Data Fig. 4|. GLS improves recall of known functional interactions in co-essential gene pairs with and without PCA-based bias correction.
Enrichment of interactions from GLS- and Pearson’s-based co-essentiality using the DepMap dataset, as well as co-expression using the COXPRESdb dataset, in CORUM, hu.MAP and STRING, considering the top 1-10 partners per gene, similar to Fig. 2a but including GLS- and Pearson’s-based co-essentiality done both with and without PCA-based bias correction.
Extended Data Fig. 5|
Extended Data Fig. 5|. Benchmarking of cluster density d.
F1 score (harmonic mean of precision and recall) for various values of the module density parameter d on CORUM, hu.MAP and STRING. F1 scores represent the performance of a binary network based on the modules (that is “are genes A and B in the same module?”) at predicting a binary network based on the benchmark dataset (that is “are genes A and B partners in the benchmark dataset?”).
Extended Data Fig. 6|
Extended Data Fig. 6|. Benchmarking of syntenic versus non-syntenic genes.
Enrichment of syntenic (both genes on same chromosome) and non-syntenic co-essential pairs for annotated interactions CORUM, hu.MAP and STRING databases, using the same benchmarking strategy as in Fig. 2a.
Extended Data Fig. 7|
Extended Data Fig. 7|. Number of genes assigned putative functions by various co-essentiality module detection methods, after excluding syntenic modules.
Number of genes in non-syntenic clusters/modules at least N-fold enriched for some GO term with at least 5 total genes present across all clusters/modules, excluding the gene itself from the enrichment calculation, for various N from 10 to 1000.
Extended Data Fig. 8|
Extended Data Fig. 8|. Strength of correct functional predictions of our modules versus same-size Pearson.
Maximum GO term enrichment across all correctly predicted GO terms, for each of the n = 1407 genes correctly predicted by both our modules and same-size Pearson, shown as a boxplot (left) and swarmplot (right). Boxplot centre represents median, bounds of box represent 25th and 75th percentiles, and minima and maxima represent the minimum and maximum values, respectively.
Extended Data Fig. 9|
Extended Data Fig. 9|. Additional functional characterization of TMEM189 suggests a secondary role in sphingolipid biosynthesis.
a. Abundances (relative to Safe-targeting sgRNA control #1) of very long chain sphingomyelin species (with acyl chain length indicated on x-axis) in cell extracts prepared from HeLa cells transduced with indicated sgRNAs. sgSafe data and sgTMEM189 data are from same data set represented in Fig. 4c. n = 4 biologically independent cell extracts. Data are presented as mean+/− s.d. b. Volcano plot of mass spectrometric (TMT) analysis of TMEM189-GFP immunoprecipitates. Data are from same mass spectrometry analysis as data shown in Fig. 5d.
Extended Data Fig. 10|
Extended Data Fig. 10|. A web tool for interactive exploration of the co-essential network.
Example use case for the interactive web tool (http://coessentiality.net). A gene, KRAS, was selected using the dropdown menu at top left and is marked with a red arrow in the scatterplot below. Genes selected for analysis – KRAS and its gene neighborhood – are designated with red points in the main panel (left). The heatmap panel (top right) shows that KRAS-mutant lines (selected for display using the search bar above the heat map and indicated as black marks in the “Mutation” bar above the heatmap) are enriched in a cluster (far right) that is marked by increased essentiality of KRAS. The pathway enrichment panel (bottom right) shows strong enrichments for Ras signaling and related pathways. The points in the main panel have also been selected in the tissue search bar (top middle) to be colored according to the average essentialities of each gene in kidney-derived cell lines. Gene sets can also be either saved or uploaded as csv files using the respective buttons in the top center (under “Gene set download/upload”). Some web colors and font sizes were optimized for display in this figure.
Fig. 1 |
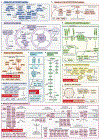
Fig. 1 |. Construction of a genome-wide co-essentiality network.
a, Overview of our approach. ER, endoplasmic reticulum; ncRNA, noncoding RNA; NFκB, nuclear factor κ-light-chain-enhancer of activated B cells; GPI, glycosylphosphatidylinositol. b, Histograms of GLS and Pearson’s correlations across all pairs of genes. c, Global structure of the co-essentiality network, with manually annotated ‘neighborhoods’ highly enriched for particular pathways and complexes. d, Selected neighborhoods with manually defined known pathway members indicated in color and other genes in gray.
Fig. 2 |
Fig. 2 |. GLS improves recall of known functional interactions in co-essential gene pairs and modules.
a, Enrichment of interactions from GLS- and Pearson’s correlation-based co-essentiality using the DepMap dataset, as well as co-expression using the COXPRESdb dataset, in CORUM, hu.MAP, STRING and DoRothEA, considering the top 1–10 partners per gene. b, Number of genes in nonsyntenic clusters/modules at least N-fold enriched for some GO term with at least five total genes present across all clusters/modules, excluding the gene itself from the enrichment calculation, for various N values from 10 to 1,000. c, Number of genes for which correct GO term-based functional predictions are made only by co-essential modules (‘GLS + ClusterONE’) or only by same-size Pearson’s modules across GO term enrichment thresholds, and the ratio (red line) of the number of genes uniquely correctly predicted by co-essential modules to the number of genes uniquely correctly predicted by same-size Pearson’s modules.
Fig. 3 |
Fig. 3 |. Co-essential modules recapitulate known pathways and nominate new pathway members.
ak, Ten examples of co-essential modules. All genes in each module are shown. Genes without previous evidence of pathway involvement are indicated as either ‘uncharacterized’ (UniProt annotation score <3) or ‘other’. Red inhibitory arrows between gene pairs indicate both negative regulation and negatively correlated essentiality profiles. In a, c, g, i and j, core pathway members not included in the module are shown in gray. Subunit counts for mitochondrial respiration complexes were based on HUGO Gene Nomenclature Committee gene sets as of September 2020 (ref. ). b,c, PI3P, phosphatidyl-inositol-3-phosphate. c, LC3s, microtubule-associated 1A/1B-light chain (LC3) family members. d, glyco, fucose and glucose modifications transferred to NOTCH1 by POFUT1 and POGLUT1; NICD, notch intracellular domain; TGF-β1, transforming growth factor β1. f, IFN, interferon; ISGs, interferon-stimulated genes. g, 2-P-L, 2-phospholactate (toxic byproduct of pyruvate kinase M1/M2 (PKM)). h, BAF, BRG- or HBRM-associated factors complex; PBAF, poly(bromo-BAF) complex. k, CoQ, coenzyme Q.
Fig. 4 |
Fig. 4 |. TMEM189 encodes the enzyme PEDS required for synthesis of plasmalogen lipids.
a, Schematic of module no. 2,213 with manual annotations of gene function. Uncharacterized gene selected for validation is shown in red box. PEX7 is shown importing cytosolic alkylglyceronephosphate synthase across the peroxisomal membrane into the peroxisome matrix. PEDS enzymatic activity is indicated in red. CDP-Eth, cytidine diphosphate ethanolamine; P-Eth, phosphoethanolamine. b, Heatmap of bias-corrected essentiality scores of genes in module 2,213 in 485 cancer cell lines. c, Volcano plot of all lipid species detected in lipidomic experiment, with ratio of lipid abundance in extracts derived from sgSafe-1-expressing cells relative to sgTMEM189-1-expressing cells plotted on the x axis. d, Total abundance (relative to Safe-targeting sgRNA control no. 1) of 37 unambiguously identified plasmenylethanolamine species in cell extracts prepared from HeLa cells transduced with indicated sgRNAs. The error bars represent the s.d. (n = 4 cell extracts). Data are presented as mean ± s.d. e, Total abundance (relative to Safe-targeting sgRNA control no. 1) of 30 unambiguously identified plasmanylethanolamine species in cell extracts prepared from HeLa cells transduced with indicated sgRNAs. The error bars represent the s.d. (n = 4 cell extracts). Data are presented as mean ± s.d. f, Top: schematic of generation of RAW.12 derivative of RAW264.7 macrophage-like line with confirmed deficiency in PEDS activity, as reported in Zoeller et al.. Bottom: western blotting (IB) with anti-TMEM189 antibodies of extracts derived from HeLa-Cas9 cells expressing sgSafe or sgTMEM189, and from RAW264.7 parental line and RAW.12 (PEDS deficient) line. Western blots show representative data from experiments performed three times.
Fig. 5 |
Fig. 5 |. C15orf57 is required for efficient clathrin-mediated endocytosis of transferrin.
a, Schematic of module no. 2,067. Uncharacterized gene selected for validation is shown in red. b, Heatmap of bias-corrected essentiality scores of genes in module no. 2,067 in 485 cancer cell lines. c, Transferrin–pHrodo uptake assay for clathrin-mediated endocytosis (24-h timepoint). Data are presented as mean ± s.d. (n = 3 replicate wells, two-tailed Student’s t-test). The data shown represent three independent experiments. d, Volcano plot of mass spectrometric (tandem mass tag) analysis of C15orf57–GFP IPs. e, Extracts prepared from indicated HeLa cell extracts were subjected to immunoprecipitation with anti-RFP magnetic resin. Extracts and IP samples were resolved by sodium dodecylsulfate–polyacrylamide gel electrophoresis followed by western blotting with indicated antibodies. *GFP-specific species; **mCherry-specific species. Data represent two western blots from one experiment. f, Microscopy of HeLa cells transduced with C15orf57–GFP and AP2S1–mCherry constructs. Images show data representing two experiments. Scale bar, 20 μm.
Fig. 6 |
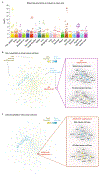
Fig. 6 |. Identification of cancer-type-specific module dependencies.
a, Differential essentiality of co-essential modules in cell lines derived from 20 tissue types. The −log10(P values) for each module are plotted for each tissue (Methods). Red bars indicate FDR thresholds for each tissue type. aero., aerodigestive; Auto., autonomic; CNS, central nervous system; Hem., hematological; lymph., lymphoma. b, Average bias-corrected gene essentiality in breast cancer cell lines plotted on 2D co-essentiality network, with the gene neighborhood containing ESR1 highlighted on the right. c, Average bias-corrected gene essentiality in skin cancer cell lines plotted on a 2D co-essentiality network, with the gene neighborhood containing BRAF/MITF-pathway genes highlighted on the right.

References

    1. Barabási A-L & Oltvai ZN Network biology: understanding the cell’s functional organization. Nat. Rev. Genet 5, 101–113 (2004). - PubMed
    1. Chuang H-Y, Hofree M & Ideker T A decade of systems biology. Annu. Rev. Cell Dev. Biol 26, 721–744 (2010). - PMC - PubMed
    1. Stuart JM, Segal E, Koller D & Kim SK A gene-coexpression network for global discovery of conserved genetic modules. Science 302, 249–255 (2003). - PubMed
    1. Costanzo M et al. A global genetic interaction network maps a wiring diagram of cellular function. Science 353, aaf1420 (2016). - PMC - PubMed
    1. Horlbeck MA et al. Mapping the genetic landscape of human cells. Cell 174, 953–967.e22 (2018). - PMC - PubMed

Publication types