. 2021 May;53(5):719-728.
doi: 10.1038/s41588-021-00843-w. Epub 2021 Apr 15.

ZNF410 represses fetal globin by singular control of CHD4

Affiliations

ZNF410 represses fetal globin by singular control of CHD4

Divya S Vinjamur et al. Nat Genet. 2021 May.

Abstract

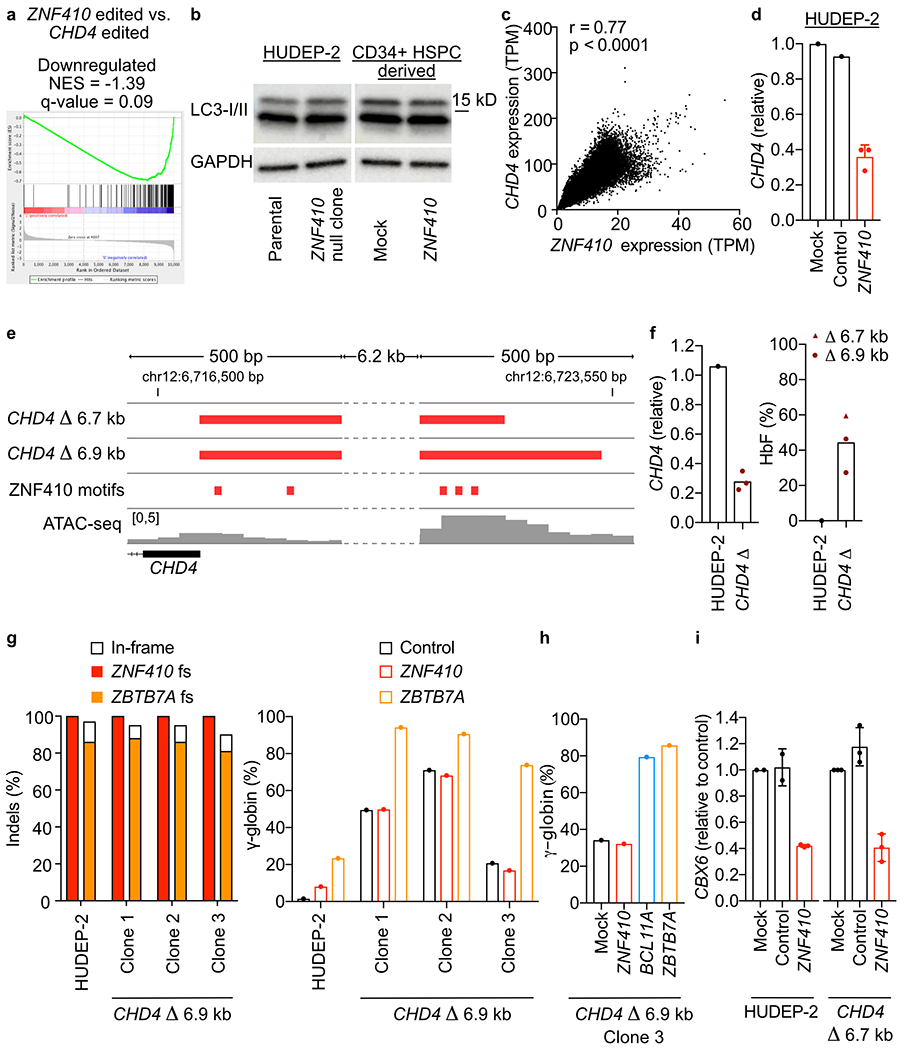
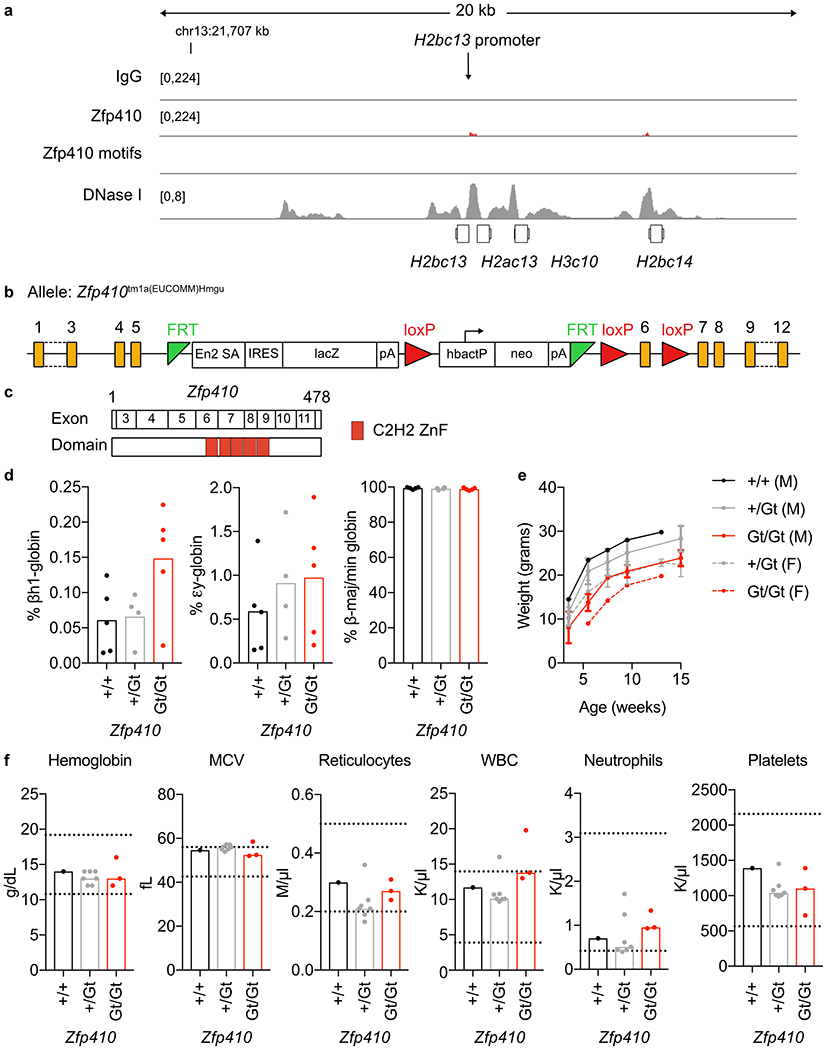
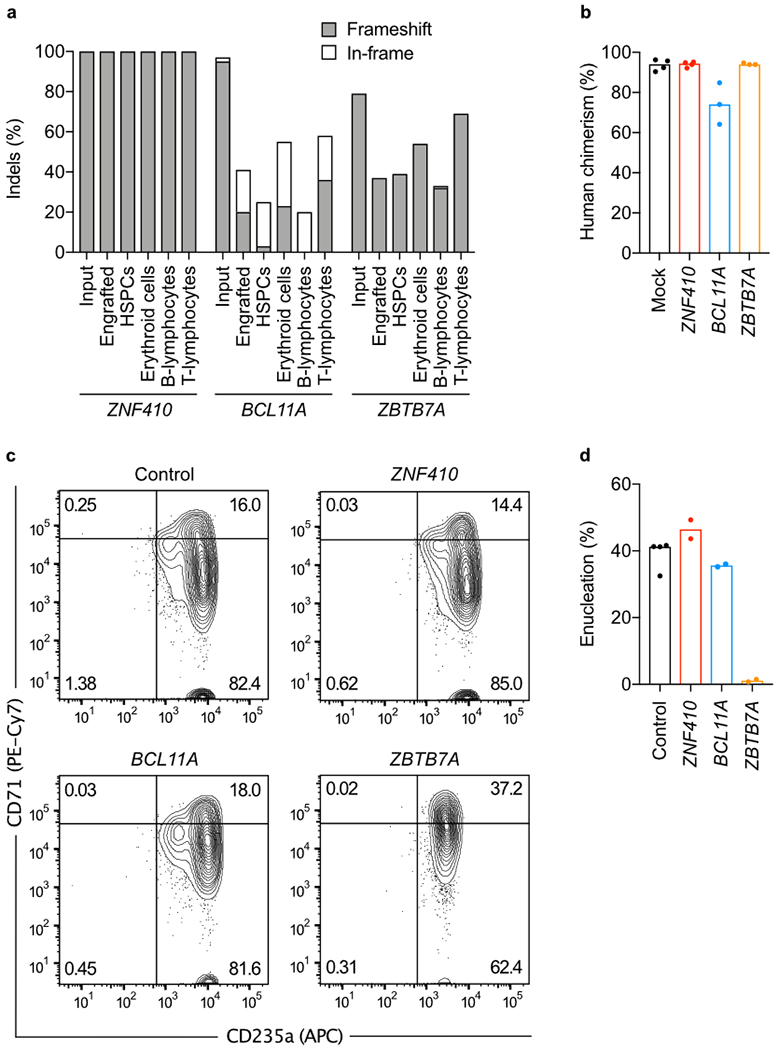
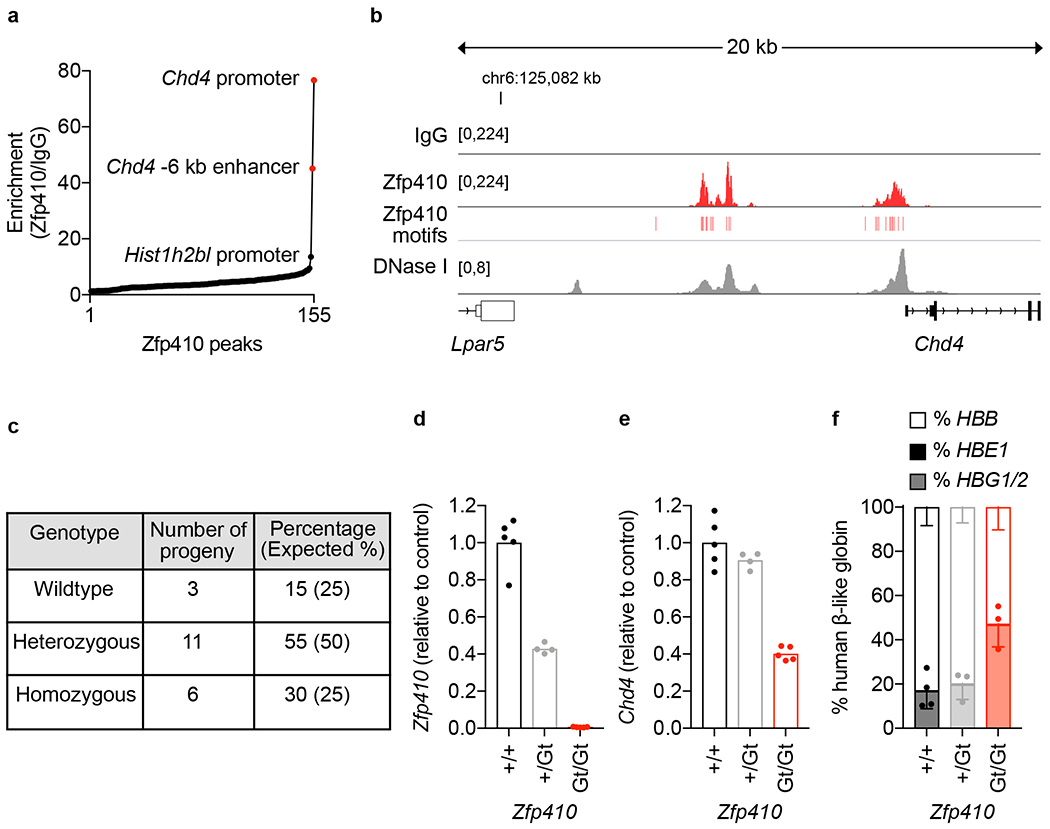
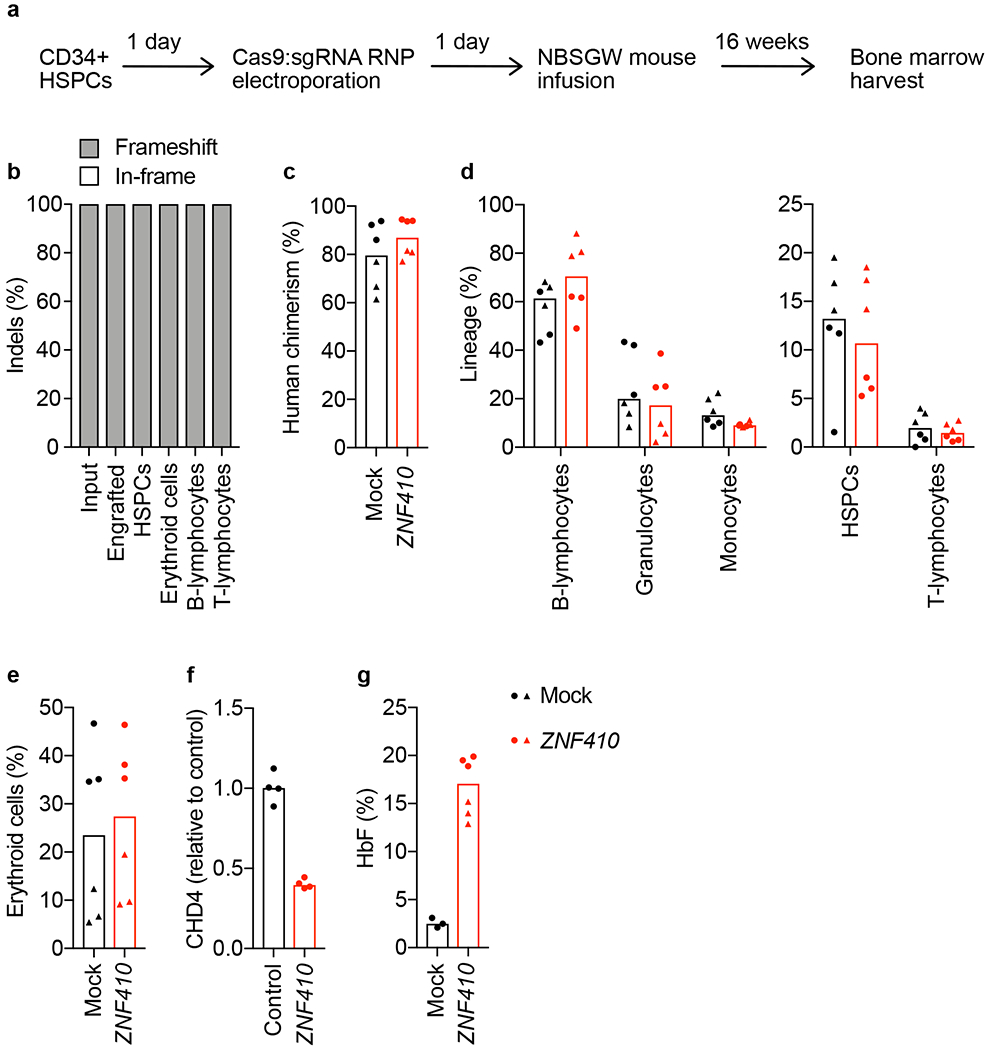
Known fetal hemoglobin (HbF) silencers have potential on-target liabilities for rational β-hemoglobinopathy therapeutic inhibition. Here, through transcription factor (TF) CRISPR screening, we identify zinc-finger protein (ZNF) 410 as an HbF repressor. ZNF410 does not bind directly to the genes encoding γ-globins, but rather its chromatin occupancy is concentrated solely at CHD4, encoding the NuRD nucleosome remodeler, which is itself required for HbF repression. CHD4 has two ZNF410-bound regulatory elements with 27 combined ZNF410 binding motifs constituting unparalleled genomic clusters. These elements completely account for the effects of ZNF410 on fetal globin repression. Knockout of ZNF410 or its mouse homolog Zfp410 reduces CHD4 levels by 60%, enough to substantially de-repress HbF while eluding cellular or organismal toxicity. These studies suggest a potential target for HbF induction for β-hemoglobin disorders with a wide therapeutic index. More broadly, ZNF410 represents a special class of gene regulator, a conserved TF with singular devotion to regulation of a chromatin subcomplex.


Conflict of interest statement

Competing interests statement

D.E.B. and D.S.V. are co-inventors on a patent related to ZNF410 disruption. The authors declare no other competing interests.

Figures

Extended Data Figure 1.
HUDEP-2 cells were edited at ZNF410 or AAVS1 (control) using sgRNA:Cas9 RNP electroporation. (a) Efficient editing was achieved with all five ZNF410 targeting gRNAs (n=1 for each gRNA). Cells were cultured in EDM2 for 8 days and (b) cell count and (c) viability data were recorded on alternate days for five individual gRNAs targeting ZNF410 (sg 1-5, n=3 for sg 1, n=1 for sg 2-5) in comparison to mock (n=3) and AAVS1 (control, n=3) targeted cells. Data are presented as mean values and error bars are standard deviation. (d) Robust y-globin induction was obtained with all five ZNF410 targeting gRNAs (n=1 for each gRNA) in comparison to mock (n=1) and AAVS1 (control, n=1) targeted cells. (e) HUDEP-2/Cas9 cells nontransduced (mock, n=3) or transduced with ZNF410 targeting sgRNA (n=4) assayed on day 9 of erythroid differentiation with RT-qPCR for HBE1 (p=0.1426, ns), HBB (p=0.0353) and HBA (p = 0.0122) expression. All values are relative to Catalase expression (endogenous control) and expressed as fold change relative to mock for each biological replicate. Data are presented as mean values and error bars are standard deviation. Statistically significant differences were determined using paired Student’s t-test comparing ZNF410 targeted cells to mock. (f) Three HUDEP-2 ZNF410 biallelic KO clones were generated using paired genomic cleavages that delete the entire coding sequence. Clones were generated in two successive steps. In the first step a HUDEP-2 clone heterozygous for ZNF410 deletion was isolated. The ZNF410 null allele in this clone is designated Null cl. allele 1 and its sequence is shown on the left. In the second step this heterozygous ZNF410 deletion clone was retargeted and three biallelic ZNF410 null clones were isolated with the sequences of the second ZNF410 null allele in each clone shown on the right of the figure.
Extended Data Figure 2.
(a) Immunoblot showing protein expression of ZNF410, CHD4, and members of the HbF repressive NuRD subcomplex - GATAD2A, MTA2, MBD2, HDAC2 and RBBP4 - in ZNF410 targeted primary erythroblasts on Day 11 of erythroid culture. GAPDH included as loading control. (b) Growth curve of ZNF410 targeted primary erythroblasts (n=3) compared to mock (n=3) and safe control (n=3) targeted cells over 18 days of erythroid differentiation culture. Data are presented as mean values and error bars are standard deviation. (c) HBG1/2 (p<0.05), HBE1 (ns), HBB (p<0.01) and HBA1/2 (ns) globin gene expression measured by RT-qPCR in ZNF410 targeted (n=3) compared to Mock (n=3) and safe control targeted (n=3) primary erythroblasts. Catalase was used as the endogenous normalization control. Values are displayed relative to the mean of mock samples. Statistical tests compare ZNF410 targeted and mock samples, ns not significant. Data are presented as mean values and error bars are standard deviation. (d) ZNF410 targeted (n=1) by RNP electroporation of Cas9 and sgRNA in CD34+ HSPCs from a sickle cell disease patient and subsequently differentiated to erythroid cells in vitro. At the end of erythroid culture (day 18), HbF level was measured by hemoglobin HPLC and compared to mock (n=1) and safe control (n=1) targeted cells.
Extended Data Figure 3.
(a-c) α-like and -like globin gene clusters and GALNT18 intron 1 with a cluster of 6 ZNF410 motifs indicating absence of ZNF410 occupancy in representative CUT&RUN control IgG (n=9) and anti-HA (n=7) in HUDEP-2 cells over-expressing HA-tagged ZNF410, control IgG (n=1) and anti-ZNF410 (n=1) in HUDEP-2 cells, and control IgG (n=2) and anti-ZNF410 (n=2) in CD34+ HSPC derived erythroid precursors. Positions of ZNF410 motifs (red rectangles), accessible chromatin by representative ATAC-seq in HUDEP-2 cells (gray peaks, n=3) and DNA sequence conservation by SiPhy rate.
Extended Data Figure 4.
(a) The third most enriched peak for ZNF410 binding (following CHD4 promoter and −6 kb enhancer) by CUT&RUN with anti-HA antibody in HUDEP-2 cells over-expressing ZNF410-HA was at TIMELESS intron 1. Representative CUT&RUN control IgG (n=9) and anti-HA (n=7) in HUDEP-2 cells over-expressing HA-tagged ZNF410, control IgG (n=1) and anti-ZNF410 (n=1) in HUDEP-2 cells, and control IgG (n=2) and anti-ZNF410 (n=2) in CD34+ HSPC derived erythroid precursors. Positions of ZNF410 motifs (red rectangles), accessible chromatin by representative ATAC-seq in HUDEP-2 cells (gray peaks, n=3), DNA sequence conservation by SiPhy rate, and repetitive elements from RepeatMasker. (b) A total of 5 peaks were identified by CUT&RUN with anti-ZNF410 antibody in HUDEP-2 cells. The top 4 peaks were at the CHD4 promoter or −6 kb enhancer, the fifth was at DPY19L3 intron 5. (c) A total of 5 peaks were identified by CUT&RUN with anti-ZNF410 antibody in CD34+ HSPC derived erythroid precursors. All 5 peaks were at the CHD4 promoter or −6 kb enhancer. (d) Peak of ZNF410 occupancy at DPY19L3 intron 5 in HUDEP-2 cells.
Extended Data Figure 5.
(a) Comparison of genes downregulated in ZNF410 and CHD4 mutant cells by GSEA (b) LC3-I/II and GAPDH (control) immunoblot in unedited parental and ZNF410 null HUDEP-2 cells (left panel) and mock and ZNF410 targeted primary erythroblasts (c) Correlation of ZNF410 and CHD4 expression across 54 human tissues from GTEx (Pearson r=0.77, p<0.0001) (d) CHD4 expression in ZNF410 targeted (n=3) compared to mock (n=1) and AAVS1 (n=1) targeted control HUDEP-2 cells. Data are mean values, error bars are standard deviation. (e) Cas9 paired cleavages with CHD4-proximal-gRNA-1 and CHD4-distal-gRNA-1 (CHD4 Δ 6.7 kb) or CHD4-proximal-gRNA-1 and CHD4-distal-gRNA-2 (CHD Δ 6.9 kb) were used to generate HUDEP-2 clones with biallelic deletions spanning both of the ZNF410 binding regions upstream of CHD4. Positions of ZNF410 motifs (red rectangles) and accessible chromatin by ATAC-seq (gray peaks) (f) CHD4 expression in CHD4 Δ 6.9 kb clones (n=3) compared to HUDEP-2 cells (n=1) (left panel) and HbF level measured by hemoglobin HPLC in CHD4 Δ 6.7 kb (n=1) and Δ 6.9 kb (#2 and #3, n=2) clones compared to HUDEP-2 cells (n=1) (right panel). (g) CHD4 Δ 6.9 kb clones and HUDEP-2 cells were subjected to AAVS1 (negative control), ZNF410 and ZBTB7A targeting using RNP electroporation of 3X-NLS-Cas9 and sgRNA. Left panel, editing efficiency measured by indel frequency in HUDEP-2 cells (n=1) and CHD4 Δ 6.9 kb clones (n=3) targeted with ZNF410 or ZBTB7A sgRNAs. The shaded portion of the bar represents the percentage of indels resulting in frameshift (fs) alleles. The white portion of the bar represents in-frame indels. Right panel, HBG expression relative to total β-like globin (HBG+HBB) in HUDEP-2 cells (n=1) and CHD4 Δ 6.9 kb clones (n=3) targeted with AAVS1 (negative control), ZNF410 or ZBTB7A sgRNAs. (h) HBG expression relative to total β-like globin (HBG+HBB) in CHD4 Δ 6.9 kb clone 3 (n=1) subjected to ZNF410, BCL 11A and ZBTB7A targeting using RNP electroporation of 3xNLS-Cas9 and sgRNA compared to mock (n=1) cells. (i) CBX6 expression in mock, AAVS1 and ZNF410 targeted HUDEP-2 cells (n=2 for mock and control, n=3 for ZNF410 targeted) and CHD4 Δ 6.7 kb HUDEP-2 cells (n=3 for mock, control and ZNF410 targeted). Catalase was used as the endogenous normalization control. CBX6 expression in targeted cells is shown relative to expression in mock cells. Data are mean values, error bars are standard deviation.
Extended Data Figure 6.
(a) CUT&RUN performed in mouse erythroieukemia (MEL) cells using anti-Zfp410 antibody (n=3) and IgG control (n=3). The third most enriched Zfp410 peak (following Chd4 promoter and Chd4 −6 kb enhancer) was at the Hist1h2bl promoter. No Zfp410 motifs were identified at this locus, which overlaps accessible chromatin (DNase-seq, gray peaks). (b) Diagram of the Zfp410 gene trap allele. A targeting cassette including splice acceptor site upstream of LacZ was inserted into Zfp410 intron 5 thus disrupting full-length expression. Schema obtained along with mouse ES cells from EuMMCR, Germany. (c) Exon and domain structure of mouse Zfp410. (d) Mouse embryonic (βh1 and εy) and adult β-major/minor globin gene expression measured by RT-qPCR in Zfp410 Gt/Gt (n=5) mouse E14.5 fetal liver erythroid cells compared to heterozygous (n=4) and wildtype (n=5) control animals. (e) Weight was measured at indicated time points over the course of 15 weeks for wildtype male (+/+ (M), n=1), Zfp410 heterozygous male (+/Gt (M), n=2), Zfp410 homozygous male (Gt/Gt (M), n=2), Zfp410 heterozygous female (+/Gt (F), n=5) and Zfp410 homozygous female (Gt/Gt (F), n=1) mice. Data are presented as mean values and error bars are standard deviation. (f) Peripheral blood hematological parameters for wildtype (n=1), Zfp410 +/Gt (n=7) and Zfp410 Gt/Gt (n=3) mice, with normal ranges for hemoglobin, mean corpuscular volume (MCV), reticulocyte, white blood cell (WBC), neutrophil and platelet count shown by dotted lines.
Extended Data Figure 7.
CD34+ HSPCs from donor 3 were edited by RNP electroporation targeting ZNF410, BCL11A or ZBTB7A and infused to NBSGW mice or subject to in vitro erythroid differentiation. (a) Indel frequency at ZNF410, BCL11A and ZBTB7A was quantified in input cells 4 days after electroporation, and in engrafted total or sorted cells at bone marrow (BM) harvest. The percentage of frameshift alleles is represented in gray and the percentage of in-frame alleles is represented in white. (b) Comparison of engraftment assessed by human CD45+ staining compared to total CD45+ cells in xenografts of ZNF410 (n=4), BCL11A (n=3) and ZBTB7A (n=3) edited and mock control (n=4) CD34+ HSPCs. Each symbol represents one mouse. (c, d) Erythroid maturation, evaluated based on CD71 and CD235a immunophenotype and enucleation frequency, was assessed on day 18 of in vitro erythroid culture in safe control (n=4), ZNF410 (n=2), BCL11A (n=2) and ZBTB7A (n=2) targeted primary erythroblasts.
Extended Data Figure 8.
Hierarchy of FACS gates and representative plots for each gate are shown for a representative control (mock) transplanted bone marrow sample. The first gate was plotted to delineate the cell population of interest (POI) and avoid debris. The second and third gates were plotted to exclude doublets. Values in plots are for respective gates.
Figure 1.
Figure 1.. ZNF410 is an HbF repressor.
(a) Schematic of CRISPR/Cas9-based knockout screen in HUDEP-2 cells to identify repressors of HbF expression. (b) HbF enrichment and cell fitness scores for each of 1,591 transcription factors and 13 genes of the NuRD complex. The gene ZNF410 was prioritized for further study based on positive HbF enrichment score, neutral cell fitness score and unknown role in erythropoiesis and globin regulation. (c) HUDEP-2/Cas9 cells nontransduced (mock) or transduced with nontargeting (NT) or ZNF410 targeting sgRNA assayed on day 9 of erythroid differentiation with intracellular staining (HbF+ cells, P = 0.0096), RT-qPCR (%HBG1/2 expression relative to total HBG1/2 and HBB expression, fold-change relative to mock; P = 0.0081) and HPLC (HbF level, P = 0.0004). Data are presented as mean values and error bars are standard deviation (n = 3). P values were calculated by two-tailed Student’s t-test comparing NT to ZNF410 edited. (d) Intracellular HbF staining of HUDEP-2 wildtype (wt, n = 1) cells and three ZNF410 knockout HUDEP-2 clones (n = 1 for each clone) without or with (gray bars) re-expression of ZNF410. (e) ZNF410 targeted by RNP electroporation of Cas9 and sgRNA in CD34+ HSPCs and subsequently differentiated to erythroid cells in vitro. Bars indicate median value, experiments performed in 4 individual donors including biological triplicate for donor 4 (total n = 6 replicates). At the end of erythroid culture (day 18), erythroid maturation was assessed by surface expression of CD71 and CD235a and enucleation frequency by Hoechst staining. Representative FACS plots are shown. Quadrant values indicated are mean ± SD; two-tailed Student’s t-test comparing ZNF410 edited to mock for CD71+CD235a+ and CD71CD235a+ quadrants did not show significant differences (P > 0.05). HbF level measured by HPLC was increased in ZNF410 edited primary erythroid cells compared to mock control cells (P < 0.0001).
Figure 2.
Figure 2.. ZNF410 chromatin occupancy is restricted to two CHD4 elements with densely clustered motifs.
(a) Dense mutagenesis of ZNF410 coding sequence by pooled screening of 180 sgRNAs (NGG PAM restricted). Each circle represents enrichment score of an individual sgRNA, black line LOWESS curve. The 5 C2H2 zinc-finger domains (red rectangles) of ZNF410 appear essential for HbF repression. (b) Genome-wide ZNF410 chromatin occupancy identified by CUT&RUN in HUDEP-2 samples with ZNF410-HA over-expression using anti-HA antibody compared to IgG control (n = 4 for each). The two peaks with greatest enrichment of ZNF410 binding were at the CHD4 promoter and CHD4 −6 kb enhancer. The next most enriched peaks, at CHD4 intron 2 and TIMELESS intron 1, showed substantially less enrichment. (c) Genome-wide ZNF410 motif occurrences (identified from JASPAR and mapped by pwmscan) across 3-kb sliding windows. Only three windows comprised more than two ZNF410 motifs, including the CHD4 promoter (16 motifs), CHD4 −6 kb enhancer (11 motifs), and GALNT18 intron 1 (6 motifs). (d) CHD4 locus at 100-kb (top panel) or 1.9-kb resolution (bottom panels) indicating ZNF410 binding (red peaks) at the CHD4 promoter and CHD4 −6 kb enhancer regions in representative control IgG (n = 9) and anti-HA (n = 7) samples in HUDEP-2 cells over-expressing HA-tagged ZNF410, control IgG (n = 1) and anti-ZNF410 (n = 1) in HUDEP-2 cells, and control IgG (n = 2) and anti-ZNF410 (n = 2) in CD34+ HSPC derived erythroid precursors. Positions of ZNF410 motifs (red rectangles), cleavage frequency (footprint) from ZNF410-HA CUT&RUN (red bars), accessible chromatin by ATAC-seq (gray peaks, n = 3) and DNA sequence conservation by SiPhy rate.
Figure 3.
Figure 3.. ZNF410 represses HbF by activating CHD4.
(a) RNA-seq differential gene expression analysis of ZNF410 (n = 3) compared to AAVS1 (n = 3) targeted HUDEP-2 cells. Downregulated and upregulated genes defined by Padj < 0.01 and log2 fold-change<−1 or >1 respectively. (b) Comparison of genes upregulated in ZNF410 and CHD4 mutant cells by GSEA shows enrichment of CHD4 regulated genes in the ZNF410 regulated gene set. (c) Pearson correlation between ZNF410 dependency and CHD4 dependency across 558 cell lines identifies CHD4 as the most ZNF410 codependent gene. (d) CHD4 expression measured by RT-qPCR in ZNF410 targeted primary erythroblasts derived from CD34+ HSPCs (n = 3, P < 0.01) compared to safe sgRNA targeted control cells (n = 3) on day 7 and day 10 of erythroid culture. Data are presented as mean values and error bars are standard deviation. (e) Cas9 paired cleavages with CHD4-proximal-gRNA-1 and CHD4-distal-gRNA-1 were used to generate an element deletion clone (CHD4 Δ 6.7 kb), with the biallelic deletion spanning both of the ZNF410 binding regions upstream of CHD4. (f) CHD4 expression measured by RT-qPCR in the CHD4 Δ 6.7 kb clone (n = 1) compared to 3 individual HUDEP-2 cell clones (n = 3) plated in parallel. HBG expression relative to total β-like globin (HBG+HBB) measured by RT-qPCR in the CHD4 Δ 6.7 kb deletion clone (n = 1) compared to control clones (n = 3). Data are presented as median values. (g) CHD4 Δ 6.7 kb clone and HUDEP-2 cells were subjected to control (safe, n = 1) and ZNF410 targeting (n = 1) by RNP electroporation. Relative CHD4 and HBG expression measured by RT-qPCR. (h) RNA-seq differential gene expression analysis of ZNF410 targeted (n = 3) compared to AAVS1 targeted (n = 3) CHD4 Δ 6.7 kb clones. Downregulated and upregulated genes defined by Padj<0.01 and log2 fold-change<−1 or >1 respectively.
Figure 4.
Figure 4.. Zfp410-deficient mice are viable with unremarkable hematology.
(a) CUT&RUN in mouse erythroleukemia (MEL) cells using anti-Zfp410 antibody (n = 3) and IgG control (n = 3). Enrichment for Zfp410 binding concentrated at Chd4 promoter (~77-fold enrichment) and Chd4 −6 kb enhancer (~45-fold enrichment) peaks. The next most enriched peak was at the Hist1h2bl promoter (~14-fold enrichment). (b) Chd4 locus showing Zfp410 binding (red peaks) at the Chd4 promoter and Chd4 −6 kb enhancer in representative IgG control (n = 3) and anti-Zfp410 (n = 3) samples. Positions of Zfp410 motifs (red rectangles) and accessible chromatin by DNase-seq (gray peaks). (c) Mouse ES cells heterozygous for Zfp410 gene-trap allele (Gt), obtained from EuMMCR, were used to generate heterozygous (Zfp410 +/Gt) and homozygous (Zfp410 Gt/Gt) gene-trap mice, with Zfp410+/Gt intercrosses yielding 20 progeny from 4 litters. (d) Zfp410 expression, measured by RT-qPCR using primers spanning exons 5 and 6, was diminished in Zfp410Gt/Gt (n = 5) mouse E14.5 fetal liver erythroid cells compared to heterozygous (n = 4, P < 0.0001) and wildtype (n = 5, P < 0.0001) control animals. (e) Chd4 expression, measured by RT-qPCR was decreased in Zfp410Gt/Gt (n = 5) mouse E14.5 fetal liver erythroid cells compared to heterozygous (n = 4, P < 0.0001) and wildtype (n = 5, P < 0.0001) control animals. (f) HBG1/2 expression, measured by RT-qPCR was elevated relative to total human β-like globin gene expression (HBE1 + HBG1/2 +HBB) in Zfp410Gt/Gt, β-YAC (n = 3) mouse E14.5 fetal liver erythroid cells compared to heterozygous (n = 3, P = 0.0178) and wildtype (n = 4, P = 0.0067) control animals. Data are presented as mean values and error bars are standard deviation. P values were calculated by two-tailed Student’s t-test for (d) - (f).
Figure 5.
Figure 5.. ZNF410-deficient human HSPCs derepress HbF and retain repopulation potential.
(a) Schematic of gene editing and transplant of human CD34+ HSPCs in immunodeficient NBSGW mice. Animals were euthanized 16 weeks post-transplant and bone marrow (BM) was harvested and sorted into various subpopulations by flow cytometry. (b-e) Two independent CD34+ HSPC donors were edited and transplanted into 6 mice for each condition (mock, n = 6 or ZNF410 edited, n = 6). Each symbol represents one mouse, recipients of donor 1 depicted as circles and donor 2 as triangles. Bars indicate median value. (b) Indel frequency at ZNF410 was quantified in input cells 4 days after electroporation and in total and sorted engrafted BM cells. Percentage of frameshift alleles is represented in gray and the percentage of in-frame alleles is represented in white for each bar. (c) Engraftment of human hematopoietic cells assessed by hCD45+ compared to total CD45+ cells. (d) B-lymphocytes (CD19+), granulocytes (CD33dim SSChigh) and monocytes (CD33bright SSClow) expressed as fraction of hCD45+ cells. HSPCs (CD34+) and T-lymphocytes (CD3+) expressed as fraction of hCD45+ CD19 CD33 cells. (e) Erythroid cells (hCD235a+) expressed as fraction of hCD45 mCD45 cells. (f) CHD4 expression measured by RT-qPCR in human erythroid cells from control (n = 4) and ZNF410 edited (n = 4) xenografts. (g) HbF measured by HPLC from hemolysates of sorted BM hCD235a+ cells from mock (n = 3) and ZNF410 edited (n = 6) xenografts.

Comment in

References

    1. Orkin SH & Bauer DE Emerging Genetic Therapy for Sickle Cell Disease. Annu. Rev. Med 70, 257–271 (2019). - PubMed
    1. Piel FB, Steinberg MH & Rees DC Sickle Cell Disease. The New England journal of medicine vol. 377 305 (2017). - PubMed
    1. Weatherall DJ The Evolving Spectrum of the Epidemiology of Thalassemia. Hematol. Oncol. Clin. North Am 32, 165–175 (2018). - PubMed
    1. Sankaran VG et al. Human Fetal Hemoglobin Expression Is Regulated by the Developmental Stage-Specific Repressor BCL11A. Science 322, 1839–1842 (2008). - PubMed
    1. Masuda T et al. Transcription factors LRF and BCL11A independently repress expression of fetal hemoglobin. Science 351, 285–289 (2016). - PMC - PubMed

References for Methods

    1. Kurita R et al. Establishment of Immortalized Human Erythroid Progenitor Cell Lines Able to Produce Enucleated Red Blood Cells. PLoS One 8, (2013). - PMC - PubMed
    1. Vinjamur DS & Bauer DE Growing and Genetically Manipulating Human Umbilical Cord Blood-Derived Erythroid Progenitor (HUDEP) Cell Lines. Methods Mol. Biol 1698, 275–284 (2018). - PubMed
    1. Giarratana MCC et al. Proof of principle for transfusion of in vitro-generated red blood cells. Blood 118, 5071–5079 (2011). - PMC - PubMed
    1. Shalem O et al. Genome-scale CRISPR-Cas9 knockout screening in human cells. Science 343, 84–87 (2014). - PMC - PubMed
    1. Sanjana NE, Shalem O & Zhang F Improved vectors and genome-wide libraries for CRISPR screening. Nat. Methods 11, 783–784 (2014). - PMC - PubMed

Publication types

MeSH terms