. 2019 Jan 8;31(1):251-259.
doi: 10.1021/acs.chemmater.8b04333. Epub 2018 Dec 9.

Gadolinium Doping Enhances the Photoacoustic Signal of Synthetic Melanin Nanoparticles: A Dual Modality Contrast Agent for Stem Cell Imaging

Affiliations

Gadolinium Doping Enhances the Photoacoustic Signal of Synthetic Melanin Nanoparticles: A Dual Modality Contrast Agent for Stem Cell Imaging

Jeanne E Lemaster et al. Chem Mater. .

Abstract

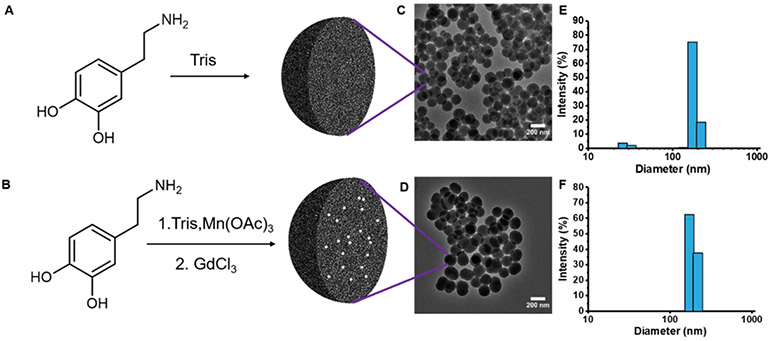
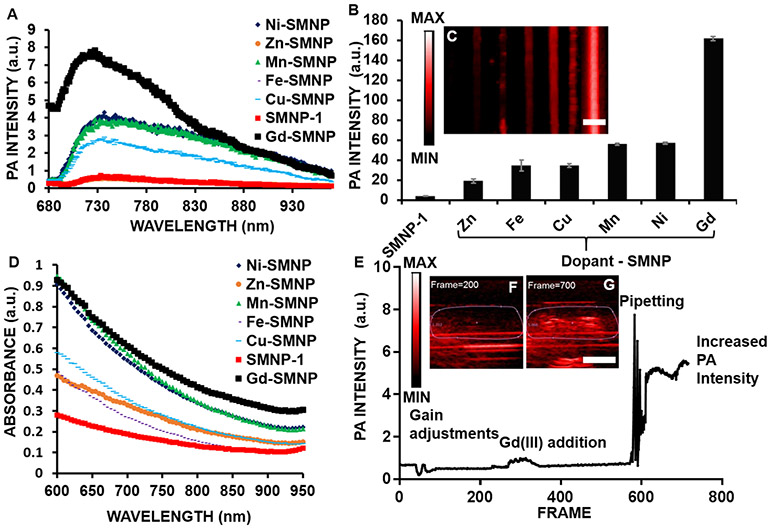
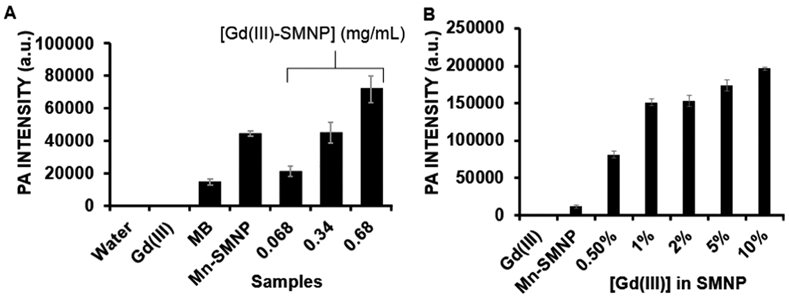
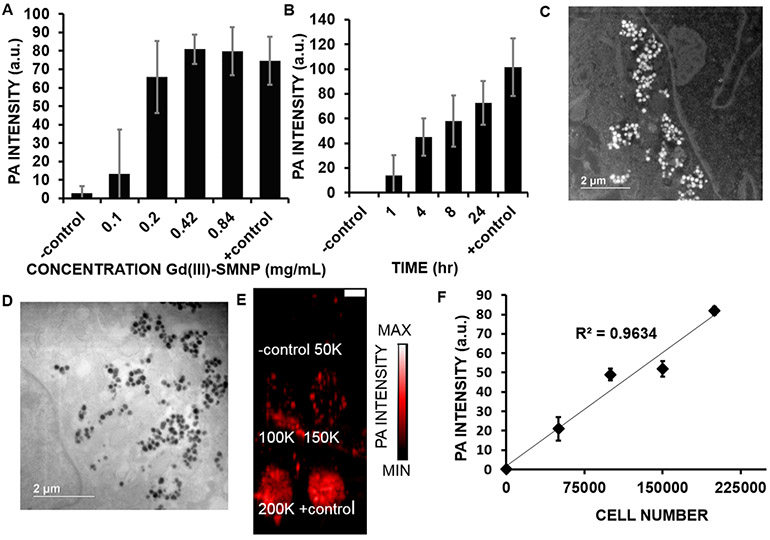
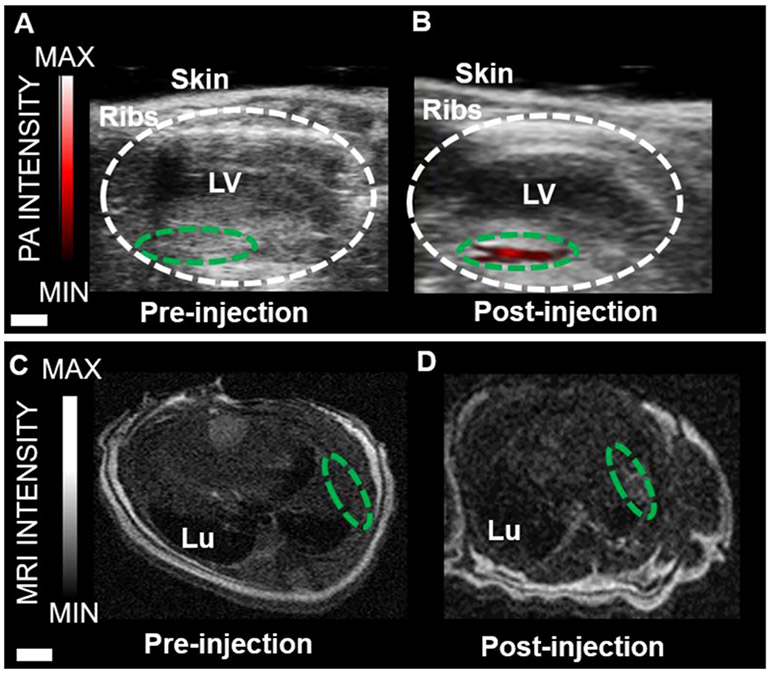
In this paper, we show that gadolinium-loaded synthetic melanin nanoparticles (Gd(III)-SMNPs) exhibit up to a 40-fold enhanced photoacoustic signal intensity relative to synthetic melanin alone and higher than other metal-chelated SMNPs. This property makes these materials useful as dual labeling agents because Gd(III)-SMNPs also behave as magnetic resonance imaging (MRI) contrast agents. As a proof-of-concept, we used these nanoparticles to label human mesenchymal stem cells. Cellular uptake was confirmed with bright-field optical and transmission electron microscopy. The Gd(III)-SMNP-labeled stem cells continued to express the stem cell surface markers CD73, CD90, and CD105 and proliferate. The labeled stem cells were subsequently injected intramyocardially in mice, and the tissue was observed by photoacoustic and MR imaging. We found that the photoacoustic signal increased as the cell number increased (R 2 = 0.96), indicating that such an approach could be employed to discriminate between stem cell populations with a limit of detection of 2.3 × 10⁴ cells in in vitro tests. This multimodal photoacoustic/MRI approach combines the excellent temporal resolution of photoacoustics with the anatomic resolution of MRI.


Figures

Figure 1.
Figure 1.
Synthesis and characterization of synthetic melanin nanoparticles (SMNPs). (A) Molecular structure of dopamine and route to nanoparticles, (B) synthesis of Gd(III)-doped SMNPs, (C) TEM micrograph of SMNPs shows spherical morphology and uniform size, (D) TEM micrograph of Gd(III)-doped SMNPs shows spherical morphology and uniform size, (E) DLS indicates a low dispersity solution and a particle size of 150 nm for SMNPs, (F) DLS data indicate a particle size of 160 nm for Gd(III)-doped SMNPs.
Figure 2.
Figure 2.
Photoacoustic (PA) imaging and intensity data of SMNPs and metal-doped SMNPs. (A) Photoacoustic spectra from 680 to 970 nm indicate a broad peak for all nanoparticle samples from 720 to 760 nm. (B) Gd(III)-SMNPs have the highest photoacoustic signal of nanoparticles doped with Ni, Zn, Cu, Mn, Fe, or Gd. The Gd(III)-doped SMNPs showed the highest photoacoustic signal and SMNPs without doping showed the lowest signal. (C) Photoacoustic imaging intensity of SMNPs and metal-doped SMNPs (Ni, Zn, Cu, Mn, Fe, and Gd). (D) Absorbance data of SMNPs and metal-doped (Ni, Zn, Cu, Mn, Fe, Gd-doped) SMNPs indicated that Gd(III) had the highest absorbance from 700 to 950 nm. (E) Quantification of photoacoustic imaging intensity for live exchanging of Mn(III)-SMNPs with Gd(III). Mn(III)-SMNPs were used to increase the Gd(III) loading via Mn–Gd ion exchange to observe the photoacoustic intensity change in real time with mixing via pipetting. The photoacoustic intensity shows a change in signal upon addition of Gd(III) (1 mg/mL) to Mn(III)-doped SMNPs (0.68 mg/mL); (F, G) Snapshots from the in situ photoacoustic movie at frames 200 and 700, respectively. The scale bar in panels C and G represents 4 mm.
Figure 3.
Figure 3.
Photoacoustic (PA) intensity of Gd(III)-doped SMNPs is dependent on the concentration of SMNPs and Gd(III). (A) Photoacoustic intensity data, where 0.68, 0.34, and 0.068 represent the 5% Gd-SMNP concentrations (mg/mL). Mn(III)-SMNPs without Gd(III) doping (0.68 mg/mL), MB (0.4 mM), H2O, and Gd(III) (40 mg/mL) are controls. (B) Photoacoustic intensity data with constant Mn-SMNP concentration, where 0.5–10% represent the concentration of Gd(III) in Mn-SMNPs. Nanoparticle concentration for all is 0.2 mg/mL. The error bars represent the standard deviation of the ROIs (n = 8).
Figure 4.
Figure 4.
Optimization of hMSC labeling parameters. (A) Increasing concentrations of nanoparticles (0.1–0.84 mg/mL of Gd(III)-SMNPs) were used to label 150 000 hMSCs; the photoacoustic signal increased accordingly. For panels (A) and (B), unlabeled hMSCs were the negative control. Gd(III)-SMNPs (0.152 μmol/mL Gd(III)) were the positive control. (B) The effect of incubation time on photoacoustic intensity of 150 000 hMSCs treated with 0.42 mg/mL of Gd(III)-SMNPs. The photoacoustic intensity increased as time increased from 1 to 24 h. *Indicates p-value <0.05. (C) Dark-field scanning transmission electron microscopy (STEM) of hMSCs treated with Gd(III)-SMNPs (4 h, 0.42 mg/mL), where the white dots indicate the Gd(III)-SMNPs. (D) TEM microscopy of hMSCs treated with Gd(III)-SMNPs (4 h, 0.42 mg/mL), where the black dots indicate the Gd(III)-SMNPs. (E) Photoacoustic imaging data of hMSCs labeled with Gd(III)-SMNPs. The photoacoustic intensity increased upon increasing the incubation time from 1 to 24 h, suggesting increased internalization of the particles with increasing time. The scale bar represents 1 cm. (F) Photoacoustic intensity data of 0–200 000 hMSCs labeled with Gd(III)-SMNPs showed a linear relationship between cell number and photoacoustic intensity.
Figure 5.
Figure 5.
Photoacoustic and MR imaging of Gd(III)-SMNPs-labeled hMSCs implanted into mouse hearts. (A) Photoacoustic imaging of the longitudinal axis view of live mouse heart pre-injection. The area circled in white represents the left ventricle (LV). The area circled in green represents the area of the left ventricle wall before injection. (B) Photoacoustic imaging of the longitudinal axis view of a live mouse heart post-injection. For this, 500 000 hMSCs labeled with Gd(III)-SMNPs were injected. The green-circled area shows the increase in photoacoustic imaging intensity (red). (C) Transverse MRI view of a mouse heart pre-injection. The green-circled area represents the LV wall. Lu is the lung. (D) Transverse MRI view of a mouse heart post-injection. For this, 500 000 hMSCs labeled with Gd(III)-SMNPs were injected. The green-circled area shows the increase in MRI signal intensity in the LV wall. The scale bar in A and B represents 2 mm; the scale bar for C and D represents 5 mm.

References

    1. Simon JD; Peles DN The Red and the Black. Acc. Chem. Res 2010, 43, 1452–1460. - PubMed
    1. Meredith P; Sarna T The Physical and Chemical Properties of Eumelanin. Pigm. Cell Res 2006, 19, 572–594. - PubMed
    1. Simon JD Spectroscopic and Dynamic Studies of the Epidermal Chromophores Trans-Urocanic Acid and Eumelanin. Acc. Chem. Res 2000, 33, 307–313. - PubMed
    1. Xiao M; Li Y; Zhao J; Wang Z; Gao M; Gianneschi NC; Dhinojwala A; Shawkey MD Stimuli-Responsive Structurally Colored Films from Bioinspired Synthetic Melanin Nanoparticles. Chem. Mater 2016, 28, 5516–5521.
    1. Xiao M; Li Y; Allen MC; Deheyn DD; Yue X; Zhao J; Gianneschi NC; Shawkey MD; Dhinojwala A Bio-Inspired Structural Colors Produced Via Self-Assembly of Synthetic Melanin Nanoparticles. ACS Nano 2015, 9, 5454–5460. - PubMed

LinkOut - more resources