. 2021 Apr 1:2021:6616654.
doi: 10.1155/2021/6616654. eCollection 2021.

Impact of Personal Protection Habits on the Spread of Pandemics: Insights from an Agent-Based Model

Affiliations

Impact of Personal Protection Habits on the Spread of Pandemics: Insights from an Agent-Based Model

Lindsay Álvarez-Pomar et al. ScientificWorldJournal. .

Abstract

Background: After several waves of spread of the COVID-19 pandemic, countries around the world are struggling to regain their economies by slowly lifting mobility restrictions and social distance measures applied during the crisis. Meanwhile, recent studies provide compelling evidence on how contact distancing, the use of face masks, and handwashing habits can reduce the risk of SARS-CoV-2 transmission. In this context, we investigated the effect that these personal protection habits can have in preventing new waves of contagion.

Methods: We extended an agent-based COVID-19 epidemic model in a simulated community to incorporate the mechanisms of these aforementioned personal care habits and measure their incidence in person-to-person transmission. A full factorial experiment design was performed to illustrate the extent to which the interplay between these personal habits is effective in mitigating the spread of disease. A global sensitivity analysis was performed on the parameters that control these habits to further validate the results.

Results: We found that observing physical distance is the dominant habit in reducing disease transmission, although adopting either or both of the other two habits is necessary to some extent to suppress a new outbreak entirely. When physical distance is not observed, adherence to the use of masks or handwashing has a significant decrease in infections and mortality, but the epidemic still unfolds. We also found that in all scenarios, the combined effect of adhering to the three habits is more powerful than adopting them separately.

Conclusions: Our findings suggest that a broad adherence of the population to voluntary self-care habits would help contain unfold of new outbreaks. The purpose of our model is illustrative and contributes to ratify the importance of urging citizens to adopt the amalgam of personal care habits as a primary collective protection measure to prevent communities from returning to confinements, while immunisation is carried out in late stages of the pandemic.


Conflict of interest statement

The authors declare that they have no conflicts of interest.

Figures

Figure 1
Figure 1
Representative SIRE curves for scenarios with SD = 0% and different combinations of MU and HW proportions (green, susceptible; red, infectious; blue, recovered; black, extinct).
Figure 2
Figure 2
Representative SIRE curves for scenarios with SD = 50% and different combinations of MU and HW proportions (green, susceptible; red, infectious; blue, recovered; black, extinct).
Figure 3
Figure 3
Representative SIRE curves for scenarios with SD = 100% and different combinations of MU and HW proportions (green, susceptible; red, infectious; blue, recovered; black, extinct).
Figure 4
Figure 4
Mortality results. Box plots represent average and standard deviation of the cumulative count of deaths in each scenario. Scenarios are labelled according to the willingness of agents to adhere to personal health habits such as social distance, mask user, or hands washer (SD%, MU%, and HW%). Baseline scenarios were defined varying the proportion of social distancers in the population assuming no agents adopt using masks or washing hands. In each panel, the baseline scenario is coloured blue (left, 0%-0%-0%; middle, 50%-0%-0%; right, 100%-0%-0%). Scenarios with statistical significant difference compared to their corresponding panel baseline (blue) are coloured green (p value <0:05); otherwise, they are coloured red.
Figure 5
Figure 5
Cases results. Box plots represent average and standard deviation of the cumulative count of infections in the population. Scenarios are labelled according to the willingness of agents to adhere to personal health habits such as social distance, mask user, or hands washer (SD%, MU%, and HW%). Baseline scenarios were defined varying the proportion of social distancers in the population assuming no agents adopt using masks or washing hands. In each panel, the baseline scenario is coloured blue (left, 0%-0%-0%; middle, 50%-0%-0%; right, 100%-0%-0%). Scenarios with statistical significant difference compared to their corresponding panel baseline (blue) are coloured green (p value <0:05); otherwise, they are coloured red.
Figure 6
Figure 6
Confirmed cases results. Box plots represent average and standard deviation of the cumulative count of only those cases reported as diagnosed. Scenarios are labelled according to the willingness of agents to adhere to personal health habits such as social distance, mask user, or hands washer (SD%, MU%, and HW%). Baseline scenarios were defined varying the proportion of social distancers in the population assuming no agents adopt using masks or washing hands. In each panel, the baseline scenario is coloured blue (left, 0%-0%-0%; middle, 50%-0%-0%; right, 100%-0%-0%). Scenarios with statistical significant difference compared to their corresponding panel baseline (blue) are coloured green (p value <0:05); otherwise, they are coloured red.
Figure 7
Figure 7
Recovered results. Box plots represent average and standard deviation of the cumulative count of agents that recovered from disease. Scenarios are labelled according to the willingness of agents to adhere to personal health habits such as social distance, mask user, or hands washer (SD%, MU%, and HW%). Baseline scenarios were defined varying the proportion of social distancers in the population assuming no agents adopt using masks or washing hands. In each panel, the baseline scenario is coloured blue (left, 0%-0%-0%; middle, 50%-0%-0%; right, 100%-0%-0%). Scenarios with statistical significant difference compared to their corresponding panel baseline (blue) are coloured green (p value <0:05); otherwise, they are coloured red.
Figure 8
Figure 8
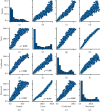
Pairwise correlations and frequency distribution of output variables, reported with p < 0.001.
Figure 9
Figure 9
Correlation analysis between outcome variables and input parameters, reported with p < 0.001.
Figure 10
Figure 10
Sensitivity indices for first (S1) and total order (ST) variabilities of input parameters on each of the outcome variables, with a 95% confidence interval.

References

    1. Pichler A., Pangallo M., del Rio-Chanona R. M., Lafond F., Farmer J. D. Production networks and epidemic spreading: how to restart the UK economy? 2020. http://arxiv.org/abs/200510585.
    1. Fernandes N. Economic effects of coronavirus outbreak (COVID-19) on the world economy. 2020. - DOI
    1. Coibion O., Gorodnichenko Y., Weber M. The Cost of the COVID-19 Crisis: Lockdowns, Macroeconomic Expecta-Tions, and Consumer Spending. Cambridge, MA, USA: National Bureau of Economic Research; 2020.
    1. Ferguson N., Laydon D., Nedjati Gilani G., et al. Report 9: Impact of Non-pharmaceutical Interventions (NPIs) to Reduce COVID19 Mortality and Healthcare Demand. London, UK: Imperial College; 2020.
    1. Lai S., Ruktanonchai N. W., Zhou L., et al. Effect of non-pharmaceutical interventions to contain COVID-19 in China. Nature. 2020;585(7825):410–413. doi: 10.1038/s41586-020-2293-x. - DOI - PMC - PubMed

LinkOut - more resources