. 2021 Mar 30:15:649876.
doi: 10.3389/fnins.2021.649876. eCollection 2021.

Cerebrospinal Fluid Biomarkers of Myeloid and Glial Cell Activation Are Correlated With Multiple Sclerosis Lesional Inflammatory Activity

Affiliations

Cerebrospinal Fluid Biomarkers of Myeloid and Glial Cell Activation Are Correlated With Multiple Sclerosis Lesional Inflammatory Activity

Ruturaj Masvekar et al. Front Neurosci. .

Abstract

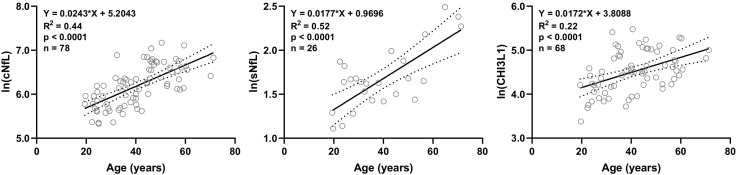
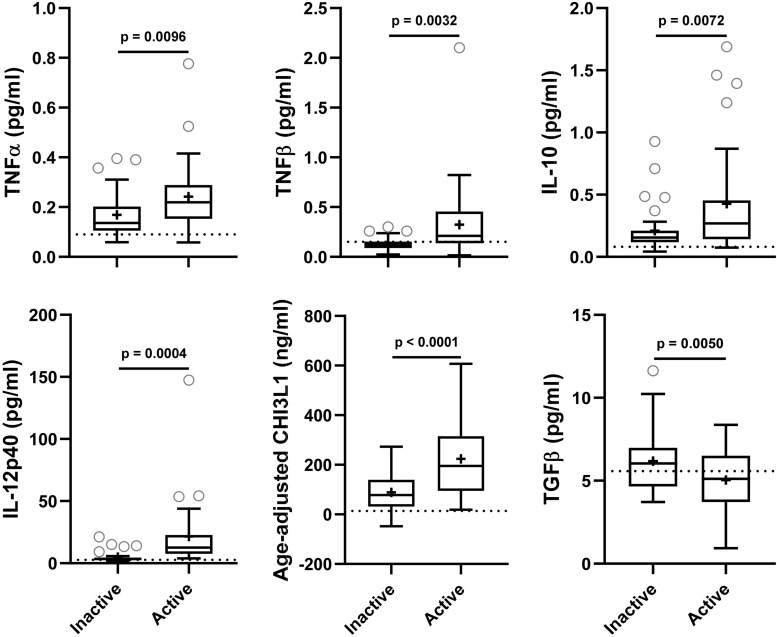
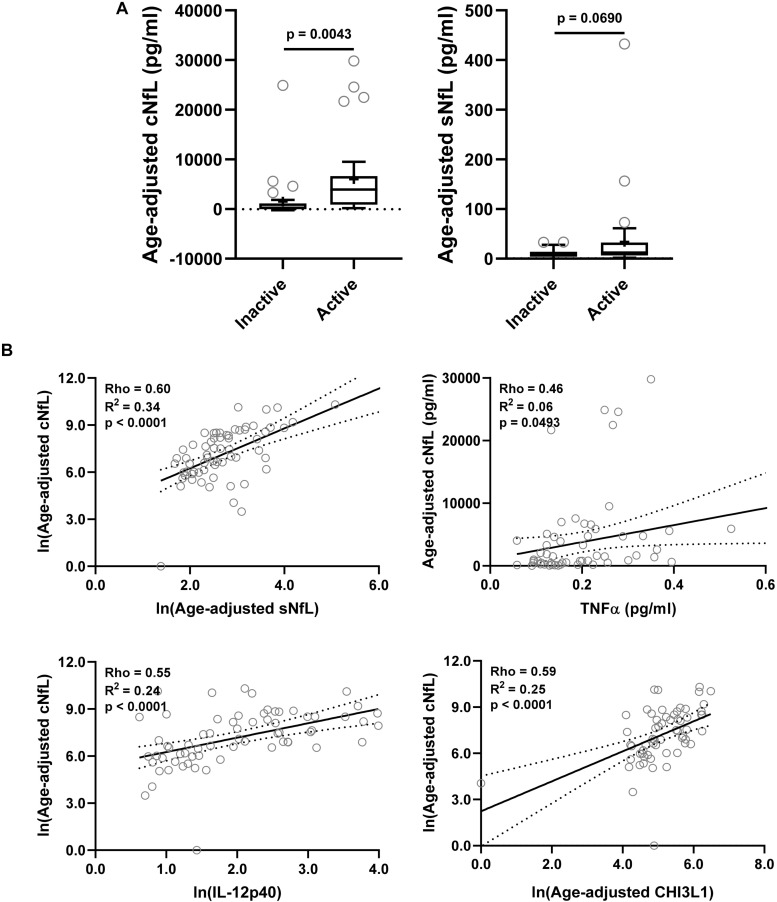
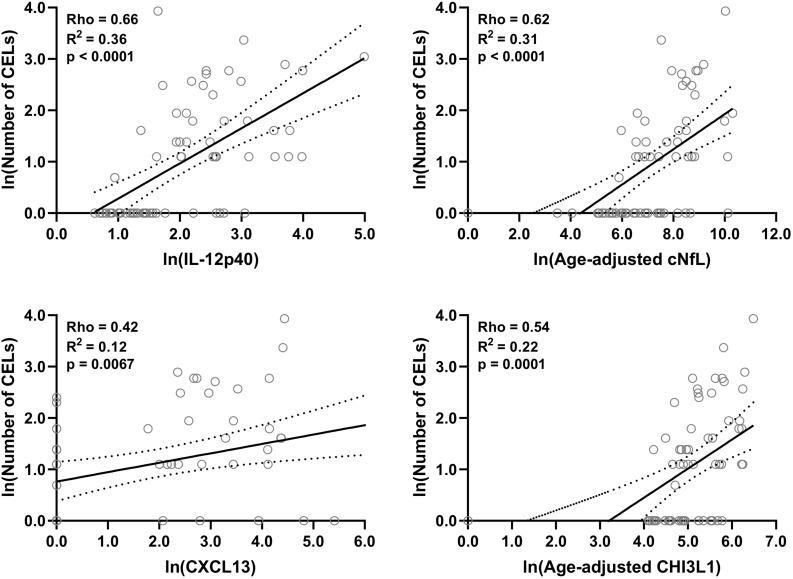
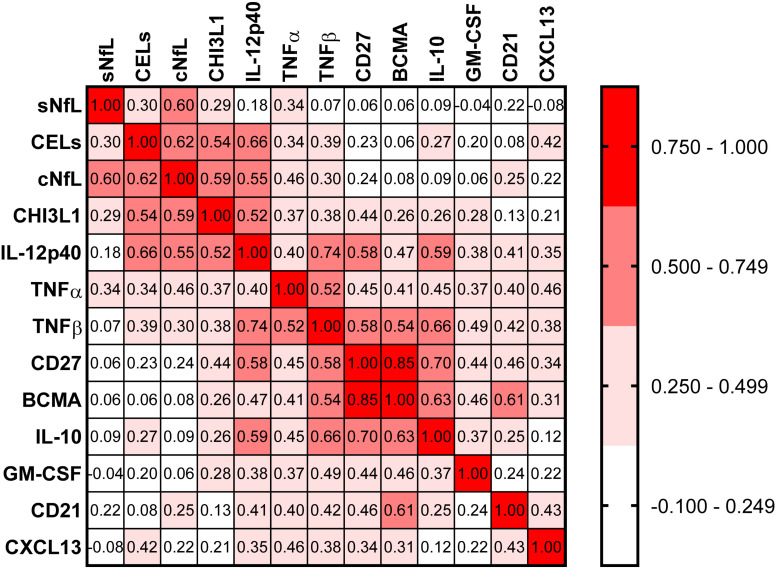
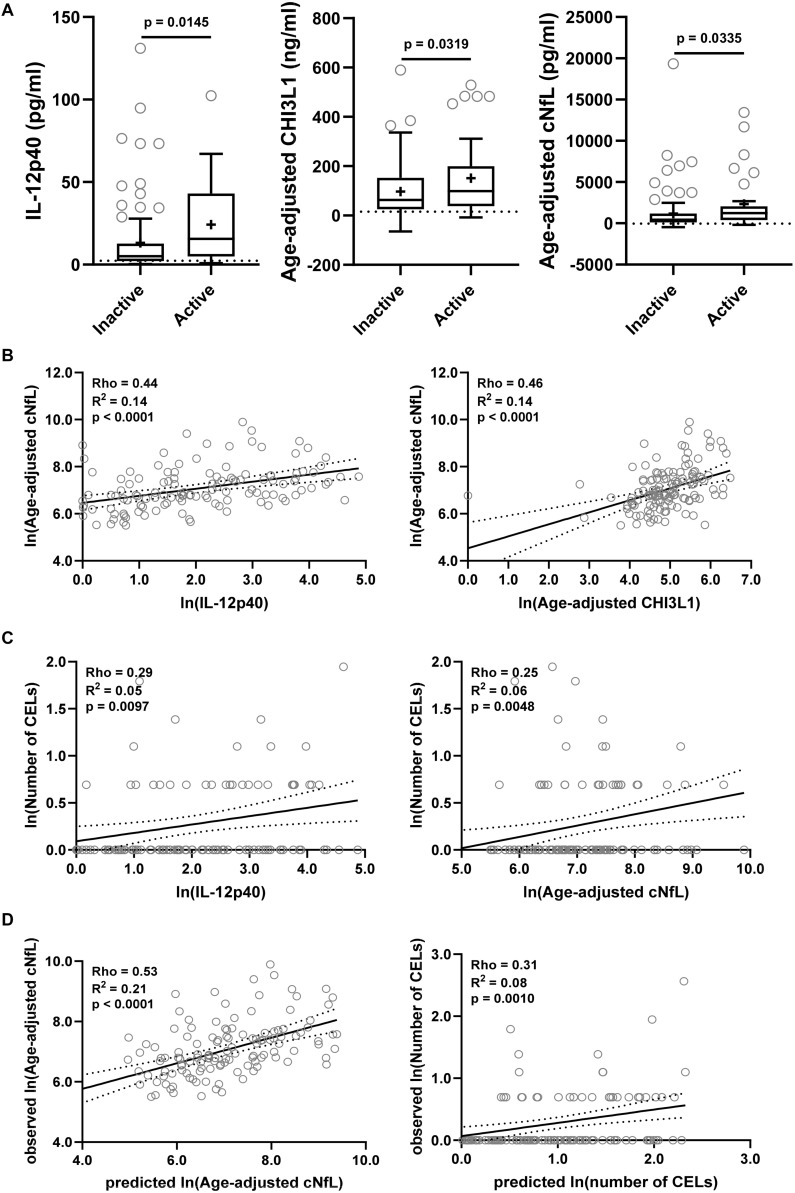
Multiple sclerosis (MS)-related inflammation can be divided into lesional activity, mediated by immune cells migrating from the periphery to the central nervous system (CNS) and non-lesional activity, mediated by inflammation compartmentalized to CNS tissue. Lesional inflammatory activity, reflected by contrast-enhancing lesions (CELs) on the magnetic resonance imaging (MRI), is effectively inhibited by current disease modifying therapies (DMTs). While, the effect of DMTs on non-lesional inflammatory activity is currently unknown. Reliable and simultaneous measurements of both lesional and non-lesional MS activity is necessary to understand their contribution to CNS tissue destruction in individual patients. We previously demonstrated that CNS compartmentalized inflammation can be measured by combined quantification of cerebrospinal fluid (CSF) immune cells and cell-specific soluble markers. The goal of this study is to develop and validate a CSF-biomarker-based molecular surrogate of MS lesional activity. The training cohort was dichotomized into active (CELs > 1 or clinical relapse) and inactive lesional activity (no CELs or relapse) groups. Matched CSF and serum samples were analyzed for 20 inflammatory and axonal damage biomarkers in a blinded fashion. Only the findings from the training cohort with less than 0.1% probability of false positive (i.e., p < 0.001) were validated in an independent validation cohort. MS patients with lesional activity have elevated IL-12p40, CHI3L1, TNFα, TNFβ, and IL-10, with the first two having the strongest effects and validated statistically-significant association with lesional activity in an independent validation cohort. Marker of axonal damage, neurofilament light (NfL), measured in CSF (cNfL) was also significantly elevated in MS patients with active lesions. NfL measured in serum (sNfL) did not differentiate the two MS subgroups with pre-determined significance, (p = 0.0690) even though cCSF and sNfL correlated (Rho = 0.66, p < 0.0001). Finally, the additive model of IL12p40 and CHI3L1 outperforms any biomarker discretely. IL12p40 and CHI3L1, released predominantly by immune cells of myeloid lineage are reproducibly the best CSF biomarkers of MS lesional activity. The residuals from the IL12p40/CHI3L1-cNfL correlations may identify MS patients with more destructive inflammation or contributing neurodegeneration.

Keywords: axonal damage; cerebrospinal fluid biomarkers; contrast-enhancing lesions; lesional inflammatory activity; multiple sclerosis.


Conflict of interest statement

MK contributed to this work as a former employee of NINDS, NIH, and the opinions expressed in this manuscript do not represent her current affiliation – Eli Lilly Japan K.K., Kobe, Japan. The remaining authors declare that the research was conducted in the absence of any commercial or financial relationships that could be construed as a potential conflict of interest.

Figures

FIGURE 1
FIGURE 1
In HD subjects’ research database, linear regression of CSF and serum NfL (cNfL and sNfL) and CHI3L1 with age as an independent variable was analyzed; All three biomarkers were significantly (R2 = 0.44, 0.52 and 0.22, respectively, and p < 0.0001) correlated with age.
FIGURE 2
FIGURE 2
In the training cohort, biomarker concentrations were compared across lesional activity subgroups (inactive versus active, n = 35 each subgroup). Dotted line represents median of HDs and “+” sign represents mean of respective subgroup. Data only for biomarkers which are statistically significantly different (p < 0.01; unpaired t-test) between two subgroups is depicted here.
FIGURE 3
FIGURE 3
In the training cohort, (A) CSF and serum NfL (cNfL and sNfL) concentrations were compared across MS lesional activity subgroups (n = 35 each subgroup). The median concentration of HDs is represented with a dotted line, and the mean for respective subgroups is represented with “+” sign. cNfL was significantly elevated in MS patients with active lesional activity (p < 0.0043; unpaired t-test). However, though sNfL was elevated in active MS patients it did not reach predefined statistical significance (p = 0.0690). (B) Within MS patients (n = 70) correlations between cNfL and all other biomarkers were analyzed; Only for statistically significantly (p < 0.01; Spearman correlation analysis) correlated biomarkers linear regression with cNfL as a dependent variable was analyzed. Solid line represents “line of best fit,” and dotted line represents 95% confidence intervals.
FIGURE 4
FIGURE 4
In the training cohort, within MS patients (n = 70) correlations between number of CELs and all biomarkers were analyzed; Only for statistically significantly (p < 0.01; Spearman correlation analysis) correlated biomarkers linear regression with number of CELs as a dependent variable was analyzed. Solid line represents “line of best fit,” and dotted line represents 95% confidence intervals.
FIGURE 5
FIGURE 5
In the training cohort, correlations between all biomarkers were analyzed using Spearman analysis. In correlogram, the color intensity of each cell denotes the correlation coefficient (Spearman Rho) for correlation between respective biomarkers. All biomarkers were analyzed, but only biomarkers which have at least one statistically significant (p < 0.01) correlation are depicted here.
FIGURE 6
FIGURE 6
The findings from the training cohort with a stronger statistical effect (p < 0.01; IL-12p40, CHI3L1, and cNfL) were then validated in an independent validation cohort. (A) Biomarker concentrations were compared across lesional activity subgroups (inactive versus active, n = 96 and 34, respectively). Dotted line represents median of HDs and “+” sign represents mean of respective subgroup. (B) In MS patients (n = 130) correlations between cNfL and IL-12p40, CHI3L1 were analyzed using Spearman analysis. Linear regression of IL-12p40 and CHI3L1 with cNfL as a dependent variable was analyzed. Solid line represents “line of best fit,” and dotted line represents 95% confidence intervals. (C) In MS patients (n = 130) correlations between number of CELs and all biomarkers were analyzed using Spearman analysis; Only for statistically significantly (IL-12p40 and cNfL; p < 0.01) correlated biomarkers linear regression with number of CELs as a dependent variable was analyzed. (D) In validation cohort, the cNfL concentrations were predicted using combined linear regression model of IL-12p40 and CHI3L1 (from training cohort), and number of CELs were predicted using combined linear regression model of IL-12p40, CHI3L1 and cNfL. And then linear regression between predicted and observed values were analyzed.

Similar articles

Cited by

References

    1. Alirezaei Z., Pourhanifeh M. H., Borran S., Nejati M., Mirzaei H., Hamblin M. R. (2020). Neurofilament light chain as a biomarker, and correlation with magnetic resonance imaging in diagnosis of CNS-Related disorders. Mol. Neurobiol. 57 469–491. 10.1007/s12035-019-01698-3 - DOI - PMC - PubMed
    1. Androdias G., Reynolds R., Chanal M., Ritleng C., Confavreux C., Nataf S. (2010). Meningeal T cells associate with diffuse axonal loss in multiple sclerosis spinal cords. Ann. Neurol. 68 465–476. 10.1002/ana.22054 - DOI - PubMed
    1. Barbour C., Kosa P., Varosanec M., Greenwood M., Bielekova B. (2020). Molecular models of multiple sclerosis severity identify heterogeneity of pathogenic mechanisms. medRxiv [Preprint]. 10.1101/2020.05.18.20105932 - DOI - PMC - PubMed
    1. Barnett M. H., Prineas J. W. (2004). Relapsing and remitting multiple sclerosis: pathology of the newly forming lesion. Ann. Neurol. 55 458–468. 10.1002/ana.20016 - DOI - PubMed
    1. Bielekova B., Goodwin B., Richert N., Cortese I., Kondo T., Afshar G., et al. (2000). Encephalitogenic potential of the myelin basic protein peptide (amino acids 83-99) in multiple sclerosis: results of a phase II clinical trial with an altered peptide ligand. Nat. Med. 6 1167–1175. 10.1038/80516 - DOI - PubMed

LinkOut - more resources