

Gazing at Social Interactions Between Foraging and Decision Theory
- PMID: 33859558
- PMCID: PMC8042312
- DOI: 10.3389/fnbot.2021.639999
Gazing at Social Interactions Between Foraging and Decision Theory
Abstract
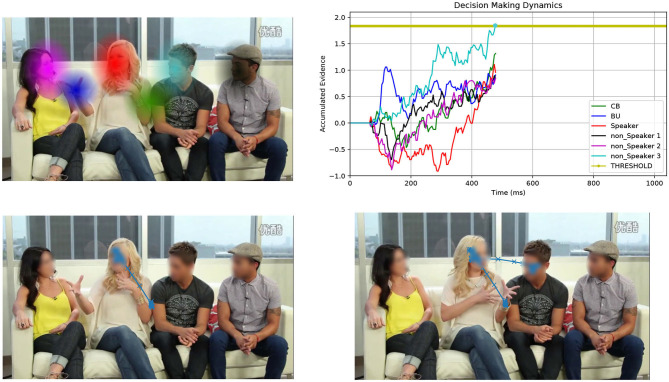
Finding the underlying principles of social attention in humans seems to be essential for the design of the interaction between natural and artificial agents. Here, we focus on the computational modeling of gaze dynamics as exhibited by humans when perceiving socially relevant multimodal information. The audio-visual landscape of social interactions is distilled into a number of multimodal patches that convey different social value, and we work under the general frame of foraging as a tradeoff between local patch exploitation and landscape exploration. We show that the spatio-temporal dynamics of gaze shifts can be parsimoniously described by Langevin-type stochastic differential equations triggering a decision equation over time. In particular, value-based patch choice and handling is reduced to a simple multi-alternative perceptual decision making that relies on a race-to-threshold between independent continuous-time perceptual evidence integrators, each integrator being associated with a patch.
Keywords: audio-visual attention; decision theory; drift-diffusion model; gaze models; multimodal perception; perceptual decisions; social interaction.
Copyright © 2021 D'Amelio and Boccignone.
Conflict of interest statement
The authors declare that the research was conducted in the absence of any commercial or financial relationships that could be construed as a potential conflict of interest. The handling Editor declared a past collaboration with one of the authors AD'A.
Figures
References
-
- Admoni H., Scassellati B. (2017). Social eye gaze in human-robot interaction: a review. J. Hum. Robot Interact. 6, 25–63. 10.5898/JHRI.6.1.Admoni - DOI
-
- Aloimonos J., Weiss I., Bandyopadhyay A. (1988). Active vision. Int. J. Comput. Vis. 1, 333–356. 10.1007/BF00133571 - DOI
-
- Bajcsy R., Campos M. (1992). Active and exploratory perception. CVGIP Image Understand. 56, 31–40. 10.1016/1049-9660(92)90083-F - DOI
-
- Ballard D. (1991). Animate vision. Artif. Intell. 48, 57–86. 10.1016/0004-3702(91)90080-4 - DOI
-
- Bartumeus F., Catalan J. (2009). Optimal search behavior and classic foraging theory. J. Phys. A Math. Theor. 42:434002. 10.1088/1751-8113/42/43/434002 - DOI
LinkOut - more resources
Full Text Sources
Other Literature Sources