. 2021 Mar 30:12:605811.
doi: 10.3389/fphys.2021.605811. eCollection 2021.

Exploring the Role of Epicardial Adipose Tissue in Coronary Artery Disease From the Difference of Gene Expression

Affiliations

Exploring the Role of Epicardial Adipose Tissue in Coronary Artery Disease From the Difference of Gene Expression

Qian-Chen Wang et al. Front Physiol. .

Abstract

Objectives: Epicardial adipose tissue (EAT) is closely adjacent to the coronary arteries and myocardium, its role as an endocrine organ to affect the pathophysiological processes of the coronary arteries and myocardium has been increasingly recognized. However, the specific gene expression profiles of EAT in coronary artery disease (CAD) has not been well characterized. Our aim was to investigate the role of EAT in CAD at the gene level.

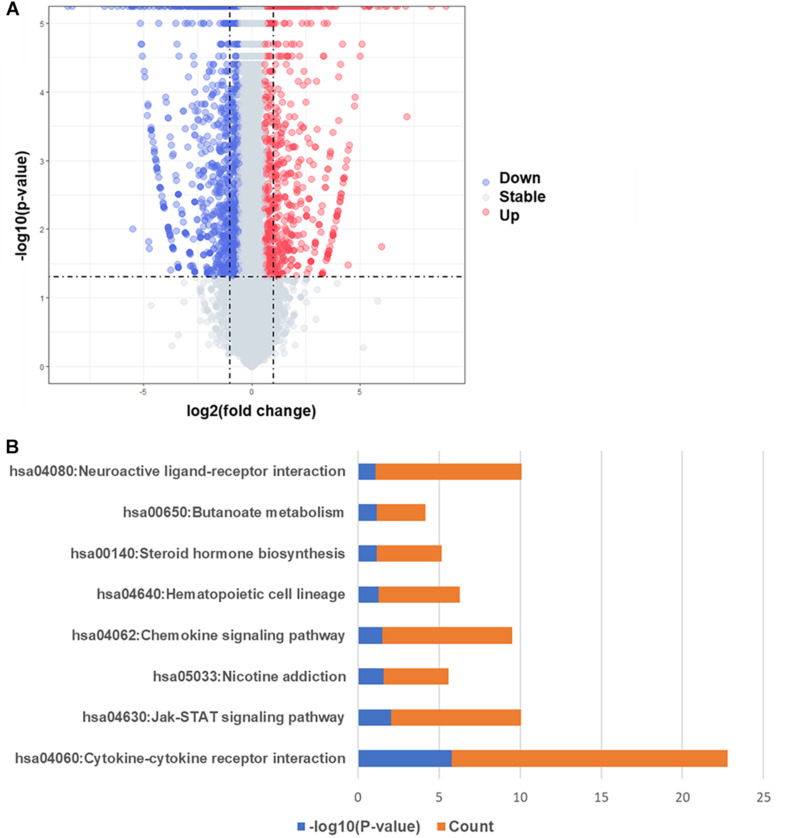
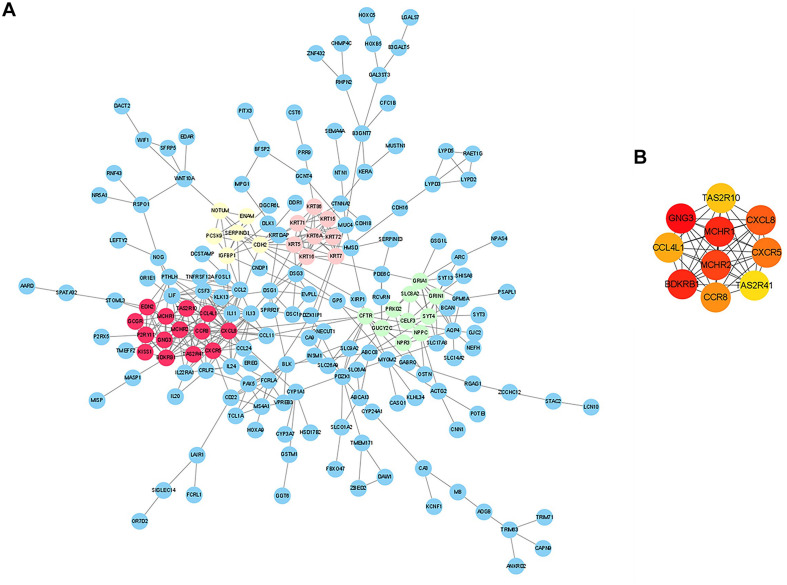
Methods: Here, we compared the histological and gene expression difference of EAT between CAD and non-CAD. We investigated the gene expression profiles in the EAT of patients with CAD through the high-throughput RNA sequencing. We performed bioinformatics analysis such as functional enrichment analysis and protein-protein interaction network construction to obtain and verify the hub differentially expressed genes (DEGs) in the EAT of CAD.

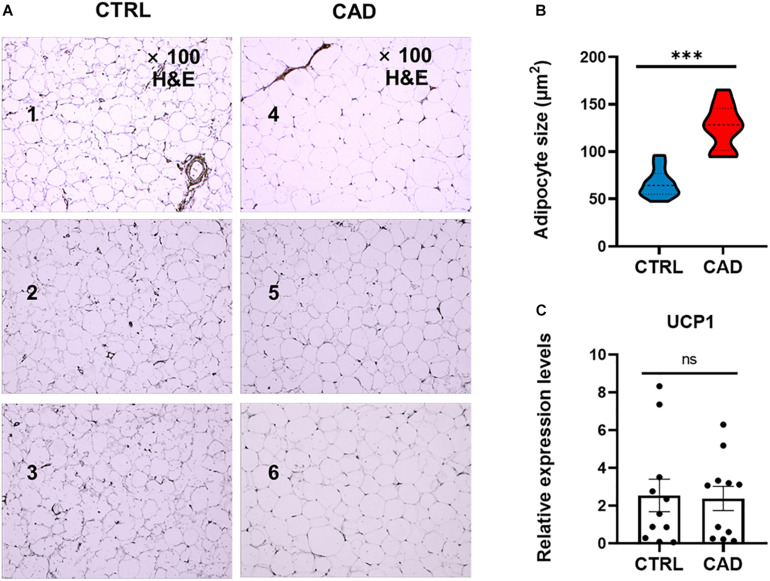
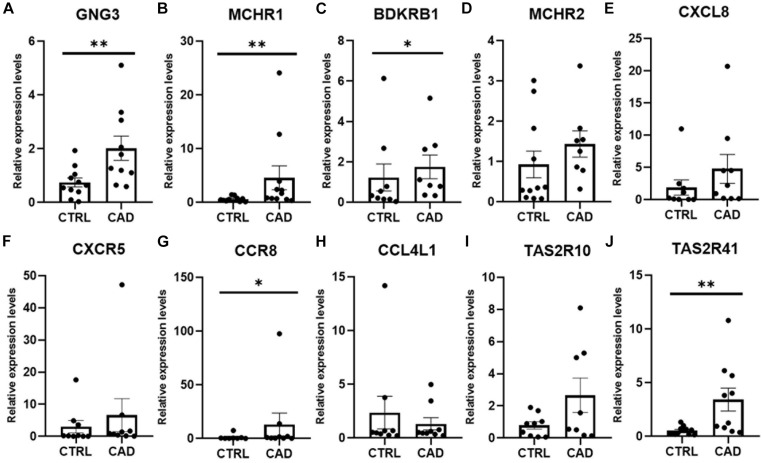
Results: Our results showed that the size of epicardial adipocytes in the CAD group was larger than in the control group. Our findings on the EAT gene expression profiles of CAD showed a total of 747 DEGs (fold change >2, p value <0.05). The enrichment analysis of DEGs showed that more pro-inflammatory and immunological genes and pathways were involved in CAD. Ten hub DEGs (GNG3, MCHR1, BDKRB1, MCHR2, CXCL8, CXCR5, CCR8, CCL4L1, TAS2R10, and TAS2R41) were identified.

Conclusion: Epicardial adipose tissue in CAD shows unique gene expression profiles and may act as key regulators in the CAD pathological process.

Keywords: bioinformatics analysis; coronary artery disease; epicardial adipose tissue; gene expression profiles; mRNA.


Conflict of interest statement

The authors declare that the research was conducted in the absence of any commercial or financial relationships that could be construed as a potential conflict of interest.

Figures

FIGURE 1
FIGURE 1
Comparison of EAT in histology. (A) H&E staining of epicardial adipose tissue (EAT) in the control and coronary artery disease (CAD) groups (100× magnification). Numbers 1–3 were EAT samples of three control subjects, while numbers 4–6 were EAT samples of three CAD patients. (B) The mean adipocyte size was larger in CAD group (***p < 0.001). (C) Expression levels of uncoupling protein 1 (UCP1) in the CTRL and CAD group (ns, p > 0.05).
FIGURE 2
FIGURE 2
Differentially expressed genes and KEGG pathway enrichment analysis. (A) Volcano map of differentially expressed genes, red spots represent up-regulated genes and blue spots represent down-regulated genes. (B) KEGG pathways significantly associated with the upregulated genes.
FIGURE 3
FIGURE 3
Analysis of protein-protein interaction (PPI) network of CAD-related differentially expressed genes (DEGs) in EAT. (A) Edges represented protein-protein associations which were meant to be specific and meaningful. The colored nodes (red, green, pink, and yellow) represented the top four modules in the PPI network. (B) Top 10 hub genes identified by CytoHubba in Cytoscape.
FIGURE 4
FIGURE 4
Real-time quantitative PCR (RT-qPCR) verification of 10 hub genes in EAT of CAD. (A) GNG3 expression was significantly increased in the CAD group. (B) MCHR1 expression was significantly higher in the CAD group. (C) BDKRB1 expression was greater in the CAD group. (D) MCHR2 was increased in the CAD group, although the difference was not statistically significant. (E) CXCL8 expression was not statistically different between the two groups. (F) CXCR5 expression was higher in the CAD group, although the difference was not statistically significant. (G) CCR8 expression was significantly higher in the CAD group. (H) CCL4L1 expression was not different in the two groups. (I) TAS2R10 expression was increased in the CAD group, although the difference was not statistically significant. (J) TAS2R41 expression was significantly increased in EAT of CAD. *p < 0.05, **p < 0.01. In each column, error bars show the mean and standard deviation per group.

References

    1. Alipoor E., Hosseinzadeh-Attar M. J., Rezaei M., Jazayeri S., Chapman M. (2020). White adipose tissue browning in critical illness: A review of the evidence, mechanisms and future perspectives. Obes. Rev. 21:e13085. - PubMed
    1. Balber T., Benčurová K., Kiefer F. W., Kulterer O. C., Klebermass E. M., Egger G., et al. (2019). In vitro Radiopharmaceutical Evidence for MCHR1 Binding Sites in Murine Brown Adipocytes. Front. Endocrinol. 10:324. 10.3389/fendo.2019.00324 - DOI - PMC - PubMed
    1. Bouchi R., Terashima M., Sasahara Y., Asakawa M., Fukuda T., Takeuchi T., et al. (2017). Luseogliflozin reduces epicardial fat accumulation in patients with type 2 diabetes: a pilot study. Cardiovasc. Diabetol. 16:32. 10.1186/s12933-017-0516-8 - DOI - PMC - PubMed
    1. Chechi K., Voisine P., Mathieu P., Laplante M., Bonnet S., Picard F., et al. (2017). Functional characterization of the Ucp1-associated oxidative phenotype of human epicardial adipose tissue. Sci. Rep. 7:15566. 10.1038/s41598-017-15501-7 - DOI - PMC - PubMed
    1. Chong C. R., Clarke K., Levelt E. (2017). Metabolic Remodeling in Diabetic Cardiomyopathy. Cardiovasc. Res. 113 422–430. 10.1093/cvr/cvx018 - DOI - PMC - PubMed

LinkOut - more resources