. 2021 Mar 20;11(11):5585-5604.
doi: 10.7150/thno.54477. eCollection 2021.

Targeting long noncoding RNA PMIF facilitates osteoprogenitor cells migrating to bone formation surface to promote bone formation during aging

Affiliations

Targeting long noncoding RNA PMIF facilitates osteoprogenitor cells migrating to bone formation surface to promote bone formation during aging

Dijie Li et al. Theranostics. .

Abstract

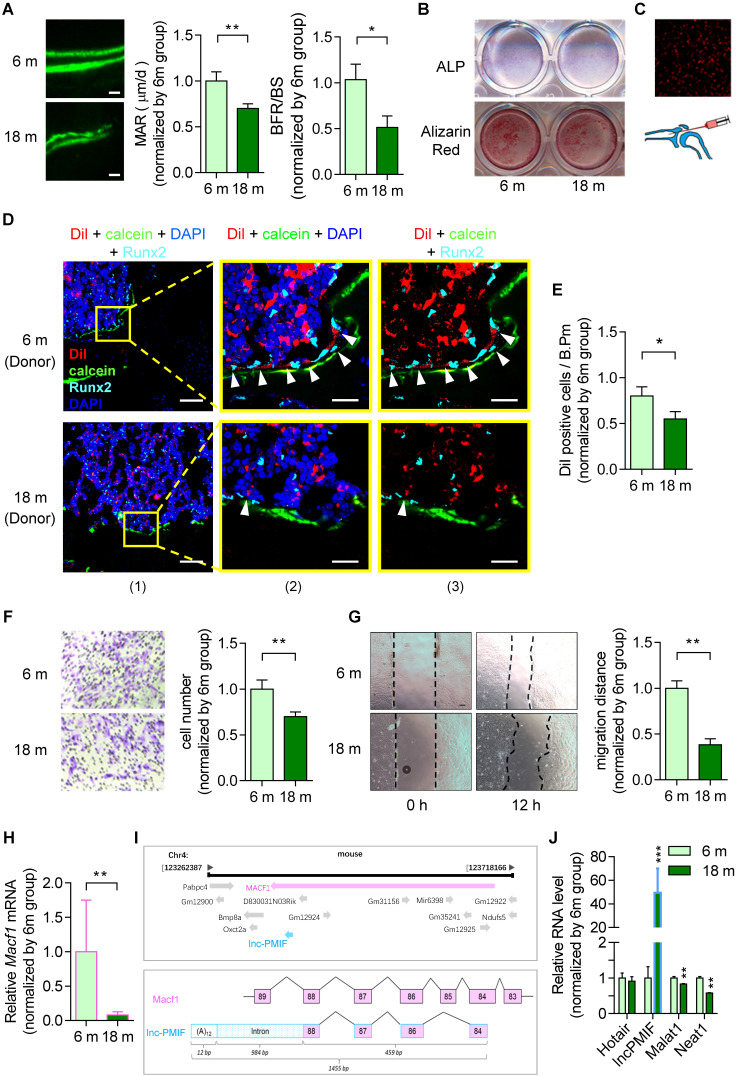
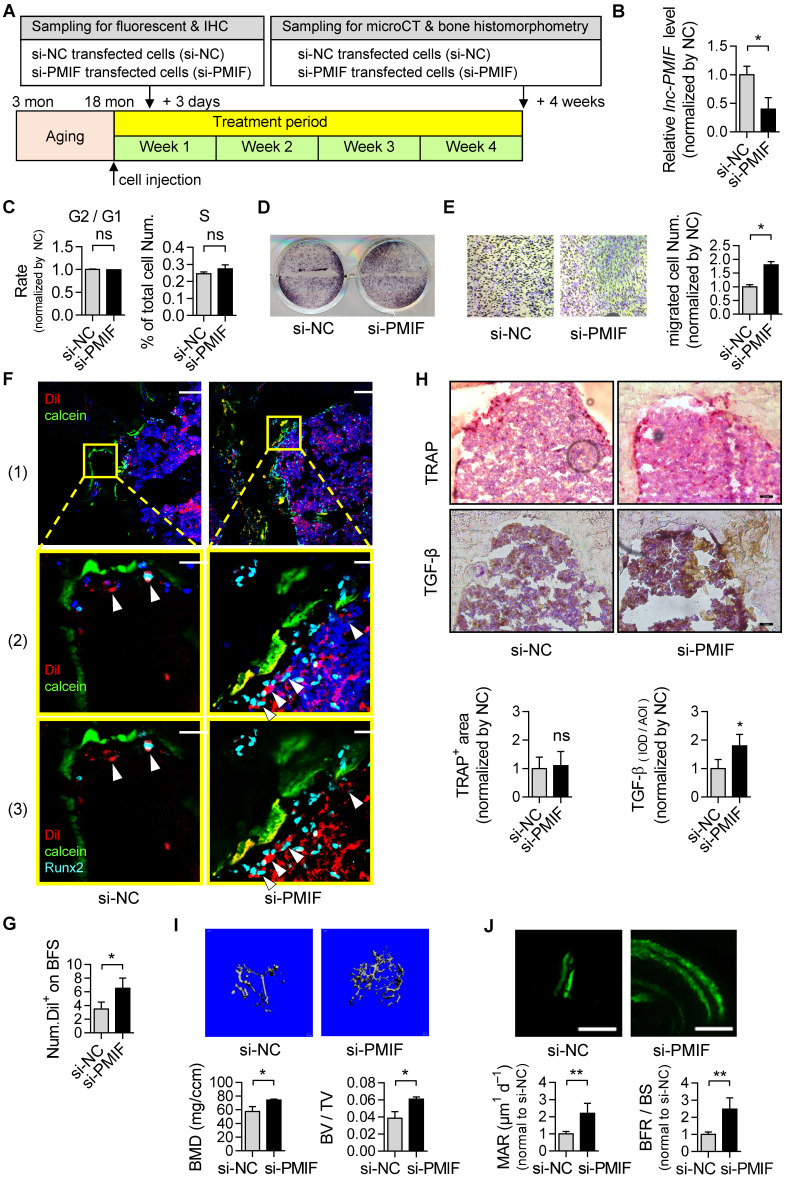
Rationale: The migration of mesenchymal osteoprogenitor cells (OPCs) to bone formation surface is the initial step of osteoblastogenesis before they undergo osteoblast differentiation and maturation for governing bone formation. However, whether the migration capacity of OPCs is compromised during aging and how it contributes to the aging-related bone formation reduction remain unexplored. In the present study, we identified a migration inhibitory factor (i.e., long noncoding RNA PMIF) and examined whether targeting lnc-PMIF could facilitate osteoprogenitor cells migrating to bone formation surface to promote bone formation during aging. Methods: Primary OPCs from young (6-momth-old) and aged (18-momth-old) C57BL/6 mice and stable lnc-PMIF knockdown/overexpression cell lines were used for in vitro and in vivo cell migration assay (i.e., wound healing assay, transwell assay and cell intratibial injection assay). RNA pulldown-MS/WB and RIP-qPCR were performed to identify the RNA binding proteins (RBPs) of lnc-PMIF. Truncations of lnc-PMIF and the identified RBP were engaged to determine the interaction motif between them by RNA pulldown-WB and EMSA. By cell-based therapy approach and by pharmacological approach, small interfering RNA (siRNA)-mediated lnc-PMIF knockdown were used in aged mice. The cell migration ability was evaluated by transwell assay and cell intratibial injection assay. The bone formation was evaluated by microCT analysis and bone morphometry analysis. Results: We reported that the decreased bone formation was accompanied by the reduced migration capacity of the bone marrow mesenchymal stem cells (BMSCs, the unique source of OPCs in bone marrow) in aged mice. We further identified that the long non-coding RNA PMIF (postulated migration inhibitory factor) (i.e., lnc-PMIF) was highly expressed in BMSCs from aged mice and responsible for the reduced migration capacity of aged OPCs to bone formation surface. Mechanistically, we found that lnc-PMIF could bind to human antigen R (HuR) for interrupting the HuR-β-actin mRNA interaction, therefore inhibit the expression of β-actin for suppressing the migration of aged OPCs. We also authenticated a functionally conserved human lncRNA ortholog of the murine lnc-PMIF. By cell-based therapy approach, we demonstrated that replenishing the aged BMSCs with small interfering RNA (siRNA)-mediated lnc-PMIF knockdown could promote bone formation in aged mice. By pharmacological approach, we showed that targeted delivery of lnc-PMIF siRNA approaching the OPCs around the bone formation surface could also promote bone formation in aged mice. Conclusion: Toward translational medicine, this study hints that targeting lnc-PMIF to facilitate aged OPCs migrating to bone formation surface could be a brand-new anabolic strategy for aging-related osteoporosis.

Keywords: aging; bone formation; cell migration; long non-coding RNA; osteoprogenitor cells.


Conflict of interest statement

Competing Interests: The authors have declared that no competing interest exists.

Figures

Figure 1
Figure 1
Decreased bone formation accompanied by reduced migration of OPCs to bone formation surface and elevated lnc-PMIF expression in OPCs in male mice during aging. (A) Dynamic bone histomorphometry of distal femoral metaphysis of young (6-month-old, 6 m) and aged (18-month-old, 18 m) mice. Top panel: the representative fluorescent images of new bone formation revealed by double calcein labeling. Bottom panel: the dynamic bone histomorphometric parameters (MAR and BFR/BS). (B) Representative images of ALP staining in BMSCs after 7 days of osteogenic induction (top) and Alizarin Red S staining in BMSCs after 14 days of osteogenic induction (bottom). Scale bar: 100 µm. (C) Schematic diagram for intratibial injection of Dil-labeled BMSCs. (D) Representative confocal images of tibia metaphysis showing the Dil-labeled cells (red) and Runx2-expressing cells (light blue) on and around the calcein-labeled bone formation surface (green) at 3 days after injection. Cell nucleus were stained by DAPI (dark blue). Scale bar: 100 µm (left panel) and 25 µm (middle and right panels). Arrow heads indicate the Dil-positive cells at the bone formation surface. (E) The average number of Dil-labeled cell approaching bone formation surface. n=3~4 mice per group. (F) Transwell migration assay of BMSCs in vitro. Left: Representative images of the migrated cells. Right: the number of migrated cells. (G) Wound healing assay of BMSCs in vitro. Left: Representative images of the miagrated cells. Right: the migration distance. (H) QPCR analysis of the expression of Macf1 in BMSCs isolated from the young (6 m) and aged mice (18 m), respectively. (I) Lnc-PMIF is a sense-overlapping transcript to the Macf1 gene. Schematic representation of the Macf1 and lnc-PMIF gene loci on mouse chromosome 4 (top). Exon composition of the lnc-PMIF transcript and organization of the overlapping exon with Macf1 (bottom). (J) QPCR analysis of the expression of Hotair, lncPMIF, Malat1 and Neat1 in BMSCs isolated from the 6 m and 18 m mice, respectively. Note: BMSCs were isolated from the young and aged mice, respectively. For in vitro assay the experiments were conducted in triplicates. For in vivo assay, n=6 mice per group unless specifically annotated. All data were expressed as mean ± SD. *P < 0.05, **P < 0.01 by Student's t-test.
Figure 2
Figure 2
Lnc-PMIF suppresses the migration of OPCs to bone formation surfaces. (A) Representative images of the migrated cells by Transwell migration assay on MC3T3-E1 cells in different groups in vitro. (B) The number of migrated cells by by Transwell migration assay on MC3T3-E1 cells in different groups in vitro. (C) Representative images of the migrated cells by Wound healing assay on MC3T3-E1 cells in different groups in vitro. (D) The migration distance by Wound healing assay on MC3T3-E1 cells in different groups in vitro. (E) Representative confocal images of tibia metaphysis showing the Dil-labeled cells (red) and Runx2-expressing cells (light blue) on and around the calcein-labeled bone formation surface (green) at 3 days after injection. Cell nucleus were stained by DAPI (dark blue). Scale bar: 100 µm (top panel) and 25 µm (middle and bottom panels). Arrow heads indicate the Dil-positive cells at the bone formation surface. (F) The average number of Dil-labeled cell approaching bone formation surface. Note: KD: MC3T3-E1 cells with stable lnc-PMIF knockdown, KD-NC: MC3T3-E1 cells with stable nonsense control RNA transfection, OE: MC3T3-E1 cells with stable lnc-PMIF overexpression, OE-NC: MC3T3-E1 cells with stable nonsense control RNA overexpression. For in vitro assay the experiments were conducted in triplicates. For in vivo assay, n=3~4 mice per group. All data were expressed as mean ± SD. **P < 0.01, ***P < 0.001 by Student's t-test.
Figure 3
Figure 3
Lnc-PMIF interacts with HuR to inhibit β-actin expression for suppressing OPC migration in vitro. (A) The image of SDS-PAGE with silver staining for visualizing the pull-down fractions with biotin-labeled lnc-PMIF (sense) or biotin-labeled control RNA (antisense). The green box indicates the band area cut for the subsequent Mass Spectrometry for identifying the protein partners candidates of lnc-PMIF. (B) Western blot analysis of the detection of HuR, LaminA/C (as the protein control from nucleus) and β-actin (as the protein control from cytoplasm) in the pull-down fractions with biotin-labeled lnc-PMIF (sense) or biotin-labeled control RNA (antisense). (C) QPCR analysis of the detection of lnc-PMIF and the mRNA of β-actin, Macf1, Dynein and MMP-2 bound to the immunoprecipitated HuR proteins or IgG control proteins. (D) QPCR analysis of the β-actin mRNA expression in KD, KD-NC, OE and OE-NC cells, respectively. (E) Western blot analysis of the HuR, β-actin and GAPDH protein expression in KD, KD-NC, OE and OE-NC cells, respectively. (F) Representative confocal images of the β-actin fluorescent immunostaining in KD and KD-NC cells, respectively. The cellular area of the box in different colors were magnified. Scale bar: 10 µm. (G) QPCR analysis of the β-actin mRNA expression in KD and KD-NC cells transfected with HuR siRNA or NC-siRNA, respectively. (H) Western blot analysis of the HuR, β-actin and GAPDH protein expression in KD and KD-NC cells transfected with HuR siRNA or NC-siRNA, respectively. (I) Transwell migration assay on KD and KD-NC cells transfected with HuR siRNA or NC-siRNA, respectively. Left: representative images of the migrated cells. Right: the number of migrated cells. Note: KD: MC3T3-E1 cells with stable lnc-PMIF knockdown, KD-NC: MC3T3-E1 cells with stable nonsense control RNA transfection, OE: MC3T3-E1 cells with stable lnc-PMIF overexpression, OE-NC: MC3T3-E1 cells with stable nonsense control RNA overexpression. (J) Wound healing assay on KD and KD-NC cells transfected with HuR siRNA or NC-siRNA, respectively. Left: representative images. Right: quantification analysis of migration distance. All in vitro experiments were conducted in triplicates. All data were expressed as mean ± SD. ns: not statistically significant, *P < 0.05, **P < 0.01, ***P < 0.001 by Student's t-test.
Figure 4
Figure 4
lnc-PMIF bind to the RRM3 of HuR for interrupting the HuR-β-actin interaction to inhibit β-actin expression for suppressing OPC migration. (A) The predicted secondary structure of lnc-PMIF. The red color indicates strong confidence for the prediction of each base. (B) RNA pull-down detection of the interaction between HuR and lnc-PMIF truncations. After the RNA pull-down experiment from MC3T3 cells by using antisense RNA, WT lnc-PMIF (sense, 1-1455 bp) and three truncated lnc-PMIFs (sense, 590-1455 bp, 860-1455 bp and 1100-1455 bp), respectively. HuR was detected by western blotting. (C) Schematic diagram showing the full length of WT HuR proteins and three truncated mutants (RRM1, RRM2 and RRM3). (D) RNA electrophoretic mobility shift assay (EMSA) of the interaction between lnc-PMIF and HuR truncations. The biotin-labeled lnc-PMIF probe was incubated with either WT HuR or truncated mutant B3 with or without unlabeled β-actin probe, respectively. The lnc-PMIF-HuR complex was detected by EMSA. (E) RNA EMSA of the competitive binding of HuR between β-actin mRNA and lnc-PMIF. The biotin-labeled β-actin probe was incubated with WT HuR in the absent or presence of various concentration of unlabeled lnc-PMIF probe, respectively. Left: The β-actin mRNA-HuR complex was detected by EMSA. Right: The quantitative curve of the complex detected. (F) QPCR analysis of the β-actin mRNA expression in OE-NC cells and OE cells with or without the overexpression of HuR RRM3, respectively. (G) Western blot analysis of the β-actin protein expression in OE-NC cells and OE cells with or without the overexpression of HuR RRM3, respectively. (H) Transwell migration assay on OE-NC cells and OE cells with or without the overexpression of HuR RRM3, respectively. Top: representative images of the migrated cells. Bottom: the number of migrated cells. (I) RNA-EMSA analysis of the interaction between lnc-PMIF and HuR-wildtype (WT) / HuR-RRM3 (RRM3) / HuR-RRM3-truncation (Leu251-II302) (Peptide52). (J) qPCR detection of actin after HuR-RRM3-Peptide52 transfected in lnc-PMIF overexpression MC3T3-E1 cells. Note:OE: MC3T3-E1 cells with stable lnc-PMIF overexpression, OE-NC: MC3T3-E1 cells with stable nonsense control RNA overexpression. All in vitro experiments were conducted in triplicates. All data were expressed as mean ± SD. ns: not statistically significant, *P < 0.05, **P < 0.01 by Student's t-test.
Figure 5
Figure 5
Silencing of lnc-PMIF in aged OPCs facilitates them migrating to bone formation surface for promoting bone formation in aged mice. (A) Schematic diagram of the experimental design. The aged BMSCs were harvested from aged mice and then transfected with lnc-PMIF siRNA (si-PMIF) or NC siRNA (si-NC), labeled with Dil and intratibially injected to the aged mice. (B) QPCR analysis of the lnc-PMIF expression in the aged BMSCs from different groups in vitro. (C) Flow cytometry analysis of the ratio of cells at G2 phase to the cells at G1 phase and the percentage of cells at S phase in the aged BMSCs from different groups during in vitro proliferation. (D) Representative images of ALP staining in in the aged BMSCs from different groups after 7 days of osteogenic induction in vitro. Scale bar: 100 µm. (E) Transwell migration assay on the aged BMSCs from different groups in vitro. Left: representative images of the migrated cells. Right: the number of migrated cells. (F) Representative confocal images of tibia metaphysis showing the Dil-labeled cells (red) and Runx2-expressing cells (light blue) on and around the calcein-labeled bone formation surface (green) in the mice from different groups at 3 days after injection. Cell nucleus were stained by DAPI (dark blue). Scale bar: 100 µm (top and middle) and 25 µm (bottom). Arrow heads indicate the Dil-positive cells at the bone formation surface. (G) The average number of Dil-labeled cell approaching bone formation surface. n=3~5 mice per group. (H) Immunohistochemical (IHC) staining of TRAP (top) and TGF-β (middle) at tibia metaphysis in the mice from different groups at 3 days after injection. Top, Middle: representative images, Bottom: quantification. Scale bar: 50 µm. (I) Micro-CT analysis of the proximal tibia metaphysis from the mice in different groups. Top panel: the representative micro-CT images showing the 3-D trabecular microarchitecture of proximal tibia metaphysis. Bottom panel: the micro-CT parameters (BMD and BV/TV). (J) Dynamic bone histomorphometry of the proximal tibia metaphysis from the mice in different groups. Top panel: the representative fluorescent images of new bone formation revealed by double calcein labeling. Bottom panel: the dynamic bone histomorphometric parameters (MAR and BFR/BS). Note: For in vitro assay, the experiments were conducted in triplicates. For in vivo assay, n=6 mice per group unless specifically annotated. All data were expressed as mean ± SD. *P < 0.05, **P < 0.01 by Student's t-test.
Figure 6
Figure 6
Targeted delivery of lnc-PMIF siRNA approaching OPCs around bone formation surface promotes bone formation in aged mice. (A) Schematic diagram of the experimental design. The aged male mice were treated with lnc-PMIF siRNA (si-PMIF) or NC siRNA (si-NC) encapsulated with (DSS6)-liposome, or (DSS6)-liposome alone (Vehicle) at a 2 weeks interval. (B) Representative micro-CT images showing the 3-D trabecular microarchitecture of the distal femur metaphysis from the mice with both genders in different groups. Upper panel: male mice. Lower panel: female mice. (C) The micro-CT parameters (BMD and BV/TV) in different groups. Upper panel: male mice. Lower panel: female mice. (D) Representative fluorescent images of calcein double labeling of the distal femur metaphysis from the mice with both genders in different groups. Upper panel: male mice. Lower panel: female mice. (E) The dynamic bone histomorphometric parameters (MAR and BFR/BS) in different groups. Upper panel: male mice. Lower panel: female mice. (F) TRAP staining at distal femur metaphysis from the above mice. Left: representative images. Right: quantification of TRAP-positive area. Scale bar: 100 µm. (G) IHC staining of TGF-β at distal femur metaphysis from the above mice. Left: representative images. Right: quantification of TGF-β positive area. Scale bar: 50 µm. Note: n=6 mice per group. All data were expressed as mean ± SD. *P < 0.05, **P < 0.01 by One-way ANOVA analysis followed by post-hoc test.

Similar articles

Cited by

References

    1. Manolagas SC. Birth and death of bone cells: Basic regulatory mechanisms and implications for the pathogenesis and treatment of osteoporosis. Endocr Rev. 2000;21:115–37. - PubMed
    1. Long FX. Building strong bones: molecular regulation of the osteoblast lineage. Nat Rev Mol Cell Biol. 2012;13:27–38. - PubMed
    1. Almeida M. Aging mechanisms in bone. Bonekey Rep. 2012;1:102. - PMC - PubMed
    1. Demontiero O, Vidal C, Duque G. Aging and bone loss: new insights for the clinician. Ther Adv Musculoskelet Dis. 2012;4:61–76. - PMC - PubMed
    1. Rosen CJ, Bouxsein ML. Mechanisms of disease: is osteoporosis the obesity of bone? Nat Clin Pract Rheumatol. 2006;2:35–43. - PubMed

Publication types