. 2021 Mar 23:2021:6657206.
doi: 10.1155/2021/6657206. eCollection 2021.

Ginkgo Biloba Extract EGB761 Ameliorates the Extracellular Matrix Accumulation and Mesenchymal Transformation of Renal Tubules in Diabetic Kidney Disease by Inhibiting Endoplasmic Reticulum Stress

Affiliations

Ginkgo Biloba Extract EGB761 Ameliorates the Extracellular Matrix Accumulation and Mesenchymal Transformation of Renal Tubules in Diabetic Kidney Disease by Inhibiting Endoplasmic Reticulum Stress

Jiarui Han et al. Biomed Res Int. .

Abstract

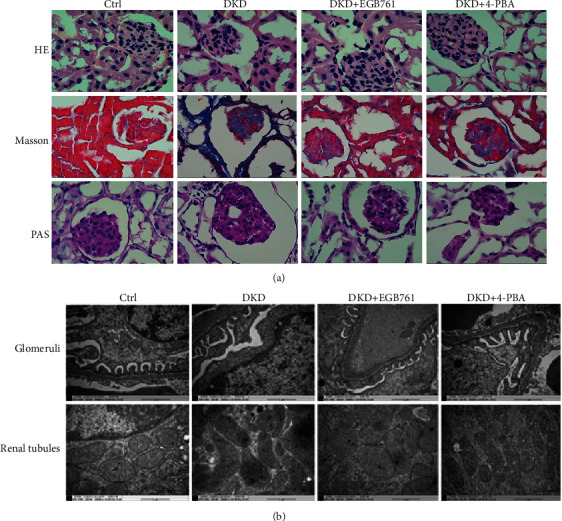
The study is aimed at investigating the effects of Ginkgo biloba extract EGB761 on renal tubular damage and endoplasmic reticulum stress (ERS) in diabetic kidney disease (DKD). A total of 50 C57BL/6 N mice were randomly divided into the normal group, DKD group, DKD+EGB761 group (36 mg/kg), and DKD+4-phenylbutyrate (4-PBA) group (1 g/kg). The DKD model was replicated by high-fat diet combined with intraperitoneal injection of streptozotocin (STZ). Renal tubular epithelial cells (HK-2) were divided into the control group, high-glucose group (30 mmol/L), EGB761 group (40 mg/L, 20 mg/L, 10 mg/L), TM group, and TM+4-PBA group. After 8 weeks of administration, expressions of serum creatinine (Scr), blood urea nitrogen (BUN), 24 h urinary protein (24 h Pro), fasting blood glucose (FBG), β 2-microglobulin (β 2-MG), and retinol binding protein 4 (RBP4) of mice were tested. The pathological changes of renal tissue were observed. The expressions of extracellular matrix (ECM) accumulation and epithelial-mesenchymal transition (EMT) markers α-smooth muscle actin (α-SMA), E-cadherin, fibronectin, and collagen IV, as well as the ERS markers GRP78 and ATF6, were tested by Western blot, qPCR, immunohistochemistry, or immunofluorescence. EGB761 could decrease the Scr, BUN, 24 h Pro, and FBG levels in the DKD group, alleviate renal pathological injury, decrease urine β 2-MG, RBP4 levels, and decrease the expression of α-SMA, collagen IV, fibronectin, and GRP78, as well as ATF6, while increase the expression of E-cadherin. These findings demonstrate that EGB761 can improve renal function, reduce tubular injury, and ameliorate ECM accumulation and EMT in DKD kidney tubules, and the mechanism may be related to the inhibition of ERS.


Conflict of interest statement

The author(s) declare(s) that they have no conflicts of interest.

Figures

Figure 1
Figure 1
EGB761 can improve renal pathological injury in DKD mice. (a) H&E staining, Masson's staining, and PAS staining of the mice renal tissue in each group. (b) Glomeruli and renal tubule structure in transmission electron microscope in each group. Ctrl: normal group; DKD: diabetic kidney disease group; DKD + EGB761: diabetic kidney disease group+EGB761 (36 mg/kg); DKD+4-PBA: diabetic kidney disease group+4-phenylbutyrate (50 g·L-1, 1 g·kg-1).
Figure 2
Figure 2
EGB761 reduced EMT in DKD. (a) The protein expression of α-SMA, E-cadherin, and bar graph representing the quantification of the α-SMA and E-cadherin bands in the renal tissue of each mice group. (b) The mRNA expression of α-SMA and E-cadherin in the renal tissue. (c) The protein expression of α-SMA, E-cadherin, and bar graph representing the quantification in HK-2 cells. (d) The mRNA expression of α-SMA and E-cadherin in HK-2 cells. (e) Immunofluorescent of α-SMA. (f) Immunofluorescent of E-cadherin. Ctrl: normal group or treated with PBS; DKD: diabetic kidney disease group; DKD + EGB761: diabetic kidney disease group+EGB761 (36 mg/kg); DKD+4-PBA: diabetic kidney disease group+4-phenylbutyrate (50 g·L-1, 1 g·kg-1); HG: high glucose; HG + HD: high glucose+EGB761 40 mg/L; HG + MD: high glucose+EGB761 20 mg/L; HG + LD: high glucose+EGB761 10 mg/L. Results were expressed as mean ± SD. P < 0.05, ∗∗P < 0.01 versus Ctrl. #P < 0.05, ##P < 0.01 versus DKD model group or HG.
Figure 3
Figure 3
EGB761 reduced ECM accumulation in DKD. (a) The protein expression of collagen IV, fibronectin, and bar graph representing the quantification in the renal tissue. (b) The mRNA expression of collagen IV and fibronectin in the renal tissue. (c) The protein expression of collagen IV, fibronectin, and bar graph representing the quantification in HK-2 cells. (d) The mRNA expression of collagen IV and fibronectin in HK-2 cells. (e) Immunofluorescent of collagen IV. (f) Immunofluorescent of fibronectin. Ctrl: normal group or treated with PBS; DKD: diabetic kidney disease group; DKD + EGB761: diabetic kidney disease group+EGB761 (36 mg/kg); DKD+ 4-PBA: diabetic kidney disease group+4-phenylbutyrate (50 g·L-1, 1 g·kg-1); HG: high glucose; HG + HD: high glucose+EGB761 40 mg/L; HG + MD: high glucose+EGB761 20 mg/L; HG + LD: high glucose+EGB761 10 mg/L. Results are expressed as mean ± SD. P < 0.05, ∗∗P < 0.01 versus Ctrl. #P < 0.05, ##P < 0.01 versus DKD model group or HG.
Figure 4
Figure 4
EGB761 inhibited ERS in DKD. (a) Immunohistochemical of GRP78, ATF6 in each mice group. (b) The protein expression of GRP78 and ATF6, as well as bar graph representing the quantification of the GRP78 and ATF6 bands in the renal tissue. (c) The mRNA expression of GRP78 and ATF6 in the renal tissue. (d) The protein expression of GRP78 and ATF6, as well as bar graph representing the quantification in HK-2 cells. (e) The mRNA expression of GRP78 and ATF6 in HK-2 cells. Ctrl: normal group or treated with PBS; DKD: diabetic kidney disease group; DKD + EGB761: diabetic kidney disease group+EGB761 (36 mg/kg); DKD+4-PBA: diabetic kidney disease group+4-phenylbutyrate (50 g·L-1, 1 g·kg-1); HG: high glucose; TM: tunicamycin; HG + MD: high glucose+EGB761 20 mg/L; TM + MD: tunicamycin+EGB761 20 mg/L. Results are expressed as mean ± SD. P < 0.05, ∗∗P < 0.01 versus Ctrl. #P < 0.05, ##P < 0.01 versus DKD model group or HG. ▲P < 0.05, ▲▲P < 0.01 versus TM.
Figure 5
Figure 5
EGB761 reduced the accumulation of ECM and the expression of EMT markers in HK-2 cells via the inhibition of ERS. (a) Western blot of α-SMA and E-cadherin. (b) Bar graph representing the quantification of α-SMA, and bar graph representing the quantification of α-SMA and E-cadherin. (b) The mRNA expression of α-SMA and E-cadherin. (c) Western blot of collagen IV, fibronectin, and bar graph representing the quantification of collagen IV and fibronectin. (d) The mRNA expression of collagen IV and fibronectin. Ctrl: control treated with PBS; TM: tunicamycin; TM+4-PBA: tunicamycin+4-PBA; TM + MD: tunicamycin+EGB761 20 mg/L. Results are expressed as mean ± SD. P < 0.05, ∗∗P < 0.01 versus Ctrl. #P < 0.05, ##P < 0.01 versus TM.

References

    1. Thomas M. C., Cooper M. E., Zimmet P. Changing epidemiology of type 2 diabetes mellitus and associated chronic kidney disease. Nature Reviews Nephrology. 2016;12(2):73–81. doi: 10.1038/nrneph.2015.173. - DOI - PubMed
    1. Gurley S. B., Ghosh S., Johnson S. A., et al. Inflammation and immunity pathways regulate genetic susceptibility to diabetic nephropathy. Diabetes. 2018;67(10):2096–2106. doi: 10.2337/db17-1323. - DOI - PMC - PubMed
    1. Umanath K., Lewis J. B. Update on diabetic nephropathy: core curriculum 2018. American Journal of Kidney Diseases. 2018;71(6):884–895. doi: 10.1053/j.ajkd.2017.10.026. - DOI - PubMed
    1. Bhattacharjee N., Barma S., Konwar N., Dewanjee S., Manna P. Mechanistic insight of diabetic nephropathy and its pharmacotherapeutic targets: an update. European Journal of Pharmacology. 2016;791:8–24. doi: 10.1016/j.ejphar.2016.08.022. - DOI - PubMed
    1. Humphreys B. D. Mechanisms of renal fibrosis. Annual Review of Physiology. 2018;80(1):309–326. doi: 10.1146/annurev-physiol-022516-034227. - DOI - PubMed

MeSH terms