

Characteristics of the gut microbiome profile in obese patients with colorectal cancer
- PMID: 33860101
- PMCID: PMC8035457
- DOI: 10.1002/jgh3.12529
Characteristics of the gut microbiome profile in obese patients with colorectal cancer
Abstract
Background and aim: Obesity affects the gut microbiome, which in turn increases the risk for colorectal cancer. Several studies have shown the mechanisms by which some bacteria may influence the development of colorectal cancer; however, gut microbiome characteristics in obese patients with colorectal cancer remain unclear. Therefore, this study evaluated their gut microbiome profile and its relationship with metabolic markers.
Methods: The study assessed fecal samples from 36 consecutive patients with colorectal cancer and 38 controls without colorectal cancer. To identify microbiotic variations between patients with colorectal cancer and controls, as well as between nonobese and obese individuals, 16S rRNA gene amplicon sequencing was performed.
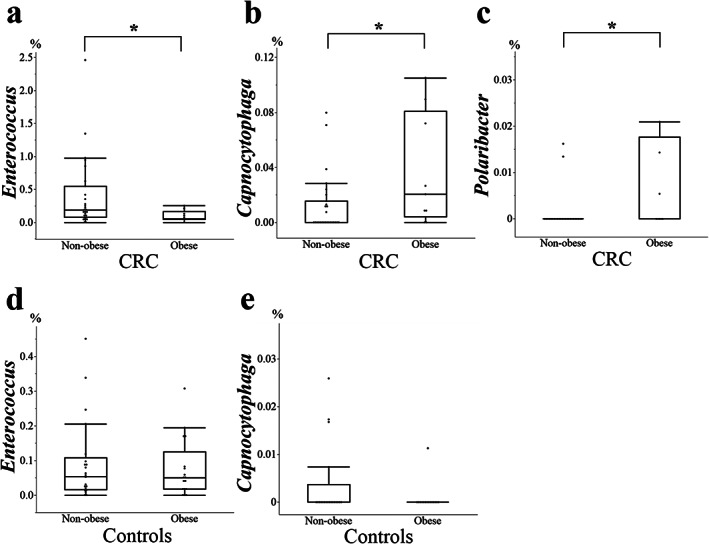
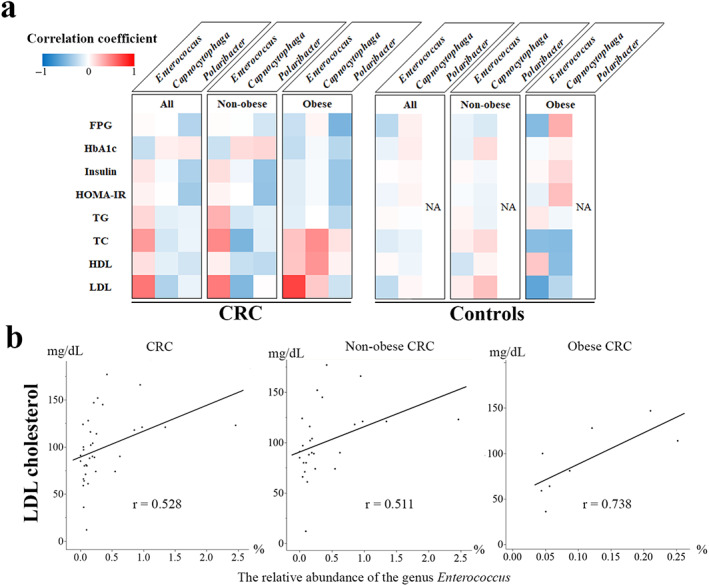
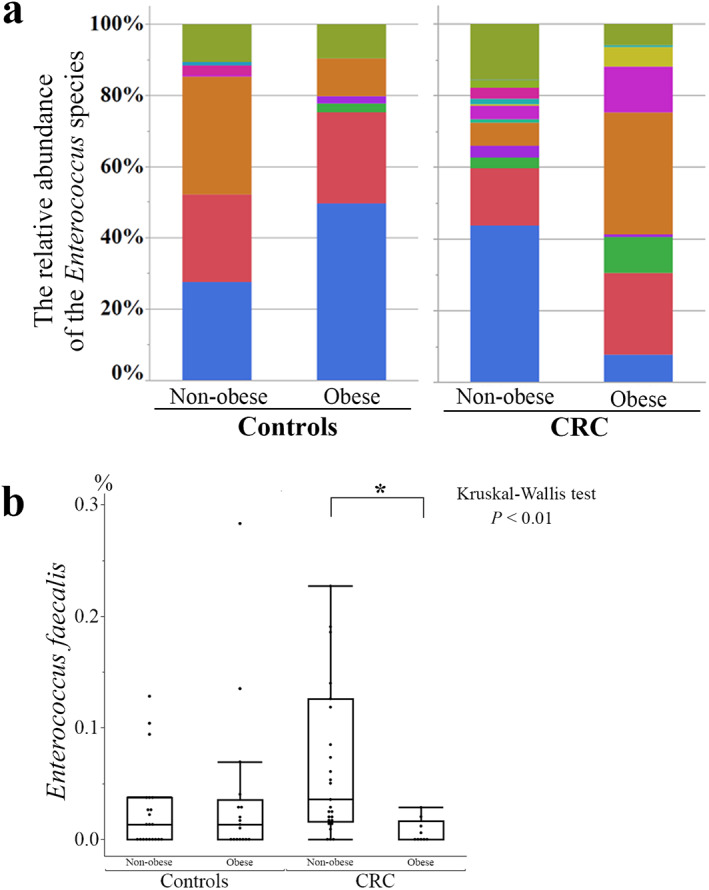
Results: Principal coordinate analysis showed significant differences in the overall structure of the microbiome among the study groups. The α-diversity, assessed by the Chao1 index or Shannon index, was higher in patients with colorectal cancer versus controls. The relative abundance of the genera Enterococcus, Capnocytophaga, and Polaribacter was significantly altered in obese patients with colorectal cancer, whose serum low-density lipoprotein concentrations were positively correlated with the abundance of the genus Enterococcus; among the most abundant species was Enterococcus faecalis, observed at lower levels in obese versus nonobese patients.
Conclusions: This study demonstrated several compositional alterations of the gut microbiome in patients with colorectal cancer and showed that a reduced presence of E. faecalis may be associated with obesity-related colorectal cancer development. The gut microbiome may provide novel insights into the potential mechanisms in obesity-related colorectal carcinogenesis.
Keywords: Capnocytophaga; colorectal neoplasms; enterococcus; gastrointestinal microbiome; obesity.
© 2021 The Authors. JGH Open: An open access journal of gastroenterology and hepatology published by Journal of Gastroenterology and Hepatology Foundation and John Wiley & Sons Australia, Ltd.
Figures
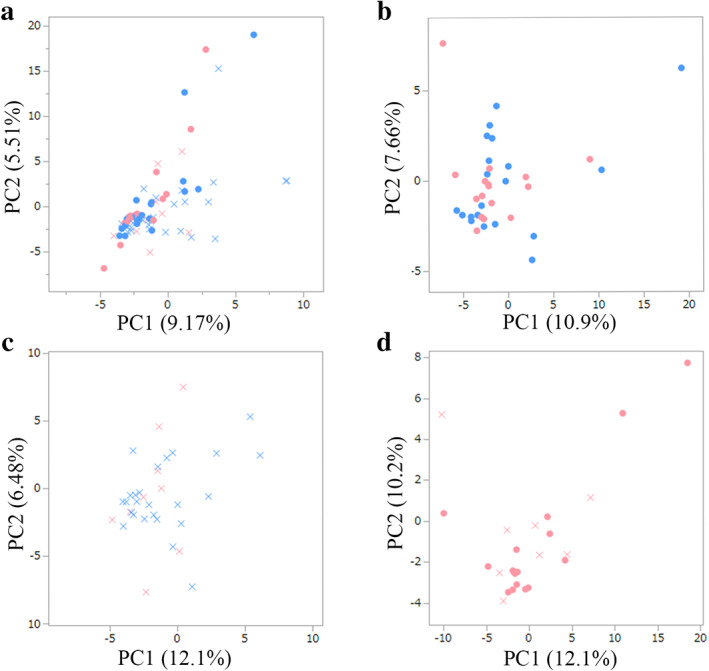
 , Non‐obese control;
  , obese control;
  , non‐obese CRC;
  , obese CRC.
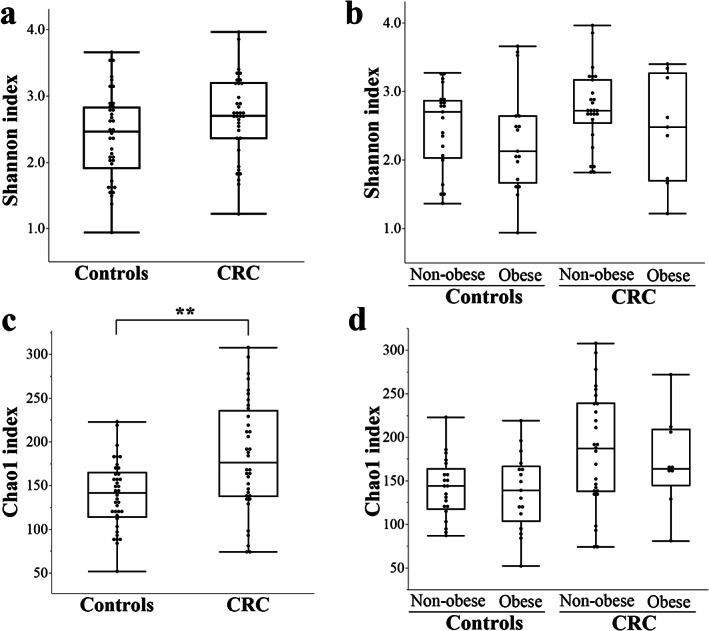
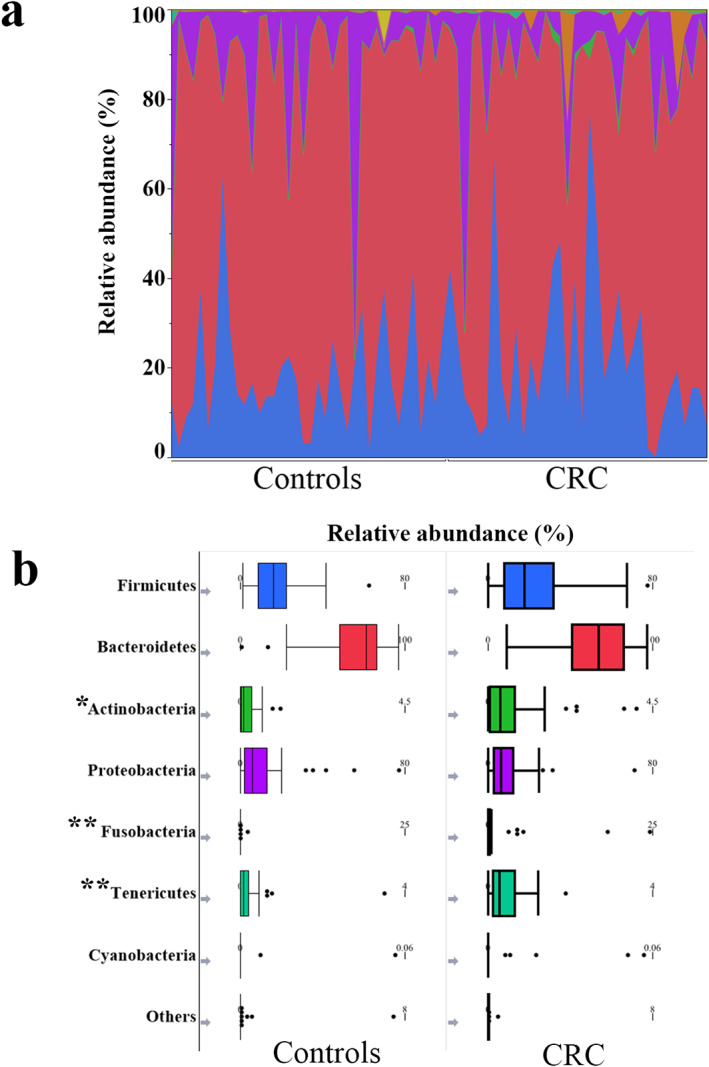
 , Firmicutes;
  , Bacteroidetes;
  , Actinobacteria;
  , Proteobacteria;
  , Fusobacteria;
  , Tenericutes;
  , Cyanobacteria;
  , others.
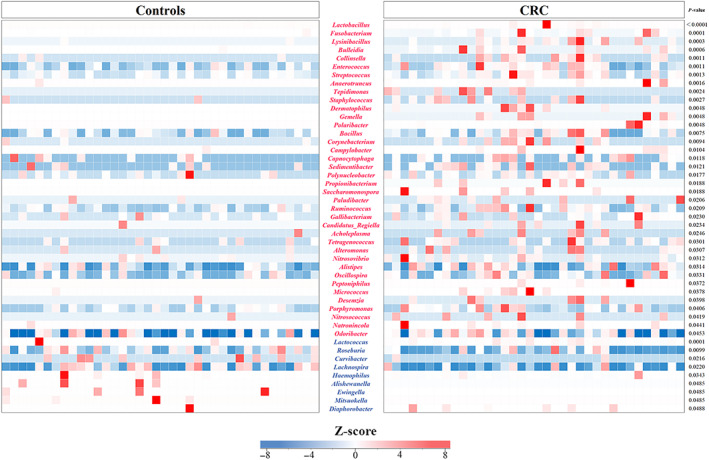
 , E. faecalis;
  , E. saccharolyticus;
  , E. sulfureus;
  , E. lactis;
  , E. casseliflavus;
  , E. hirae;
  , E. gallinarum;
  , E. avium;
  , E. hermanniensis;
  , E. columbae;
  , E. cecorum;
  , E. haemoperoxidus;
  , unclassified.
References
-
- Bray F, Ferlay J, Soerjomataram I, Siegel RL, Torre LA, Jemal A. Global cancer statistics 2018: GLOBOCAN estimates of incidence and mortality worldwide for 36 cancers in 185 countries. CA Cancer J. Clin. 2018; 68: 394–424. - PubMed
-
- Ferlay J, Colombet M, Soerjomataram I et al. Estimating the global cancer incidence and mortality in 2018: GLOBOCAN sources and methods. Int. J. Cancer. 2019; 144: 1941–53. - PubMed
-
- Sung H, Siegel RL, Torre LA et al. Global patterns in excess body weight and the associated cancer burden. CA Cancer J. Clin. 2019;69: 88–112. - PubMed
-
- Bardou M, Barkun AN, Martel M. Obesity and colorectal cancer. Gut. 2013; 62: 933–47. - PubMed
-
- Sato T, Takeda H, Sasaki Y, Kawata S. Increased homeostasis model assessment‐insulin resistance is a risk factor for colorectal adenoma in Japanese males. Tohoku J. Exp. Med. 2011; 223: 297–303. - PubMed
LinkOut - more resources
Full Text Sources
Other Literature Sources
