. 2020 Dec 19;5(4):634-649.
doi: 10.1002/hep4.1653. eCollection 2021 Apr.

Establishment of a Cell Culture Model Permissive for Infection by Hepatitis B and C Viruses

Affiliations

Establishment of a Cell Culture Model Permissive for Infection by Hepatitis B and C Viruses

Teruhime Otoguro et al. Hepatol Commun. .

Abstract

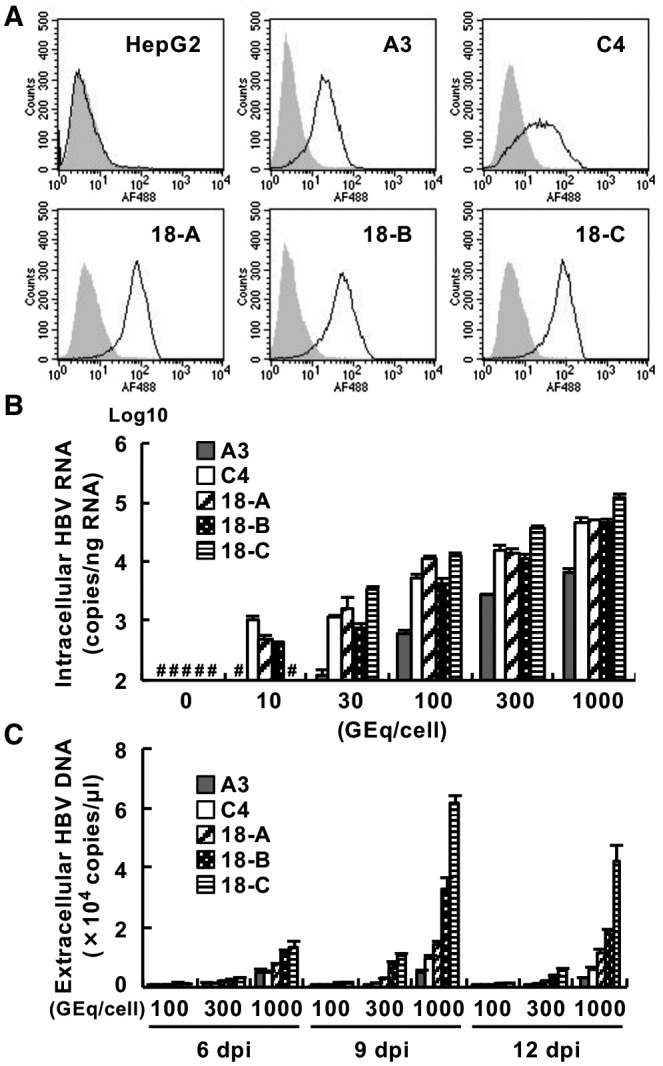
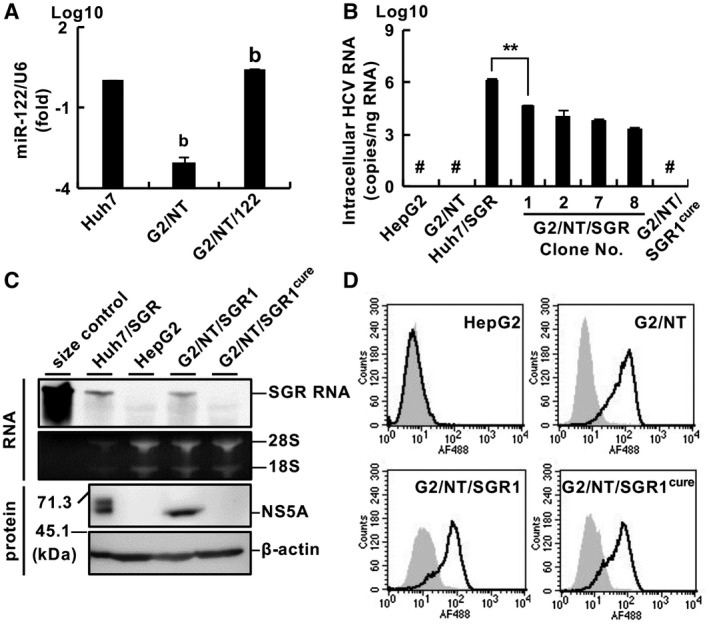
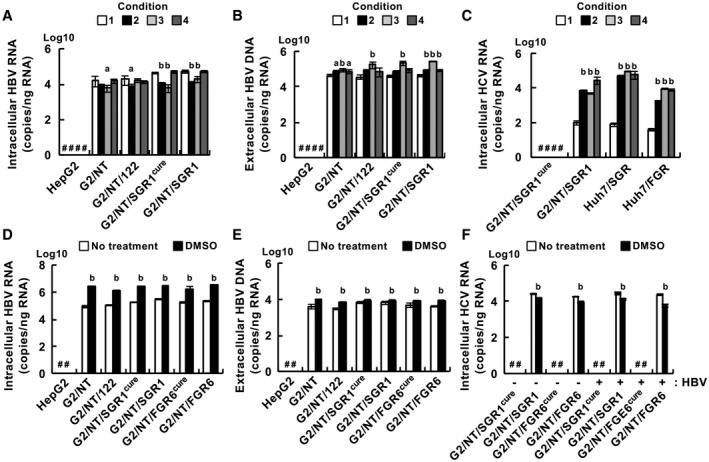
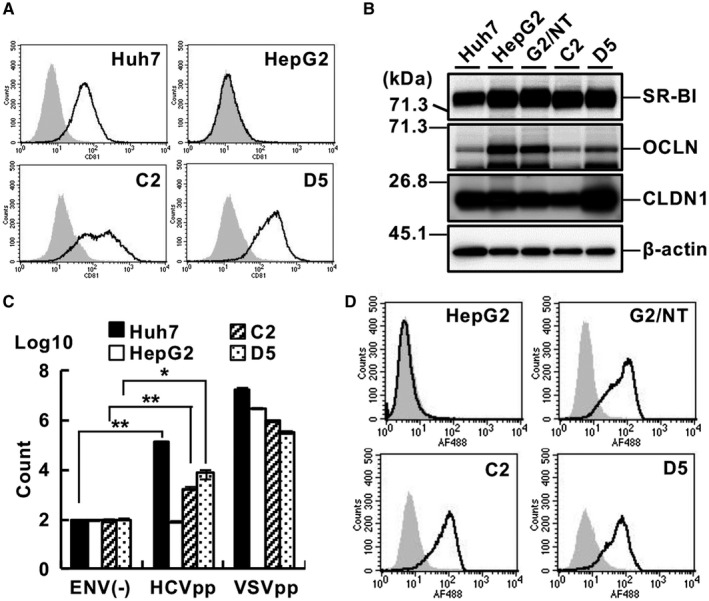
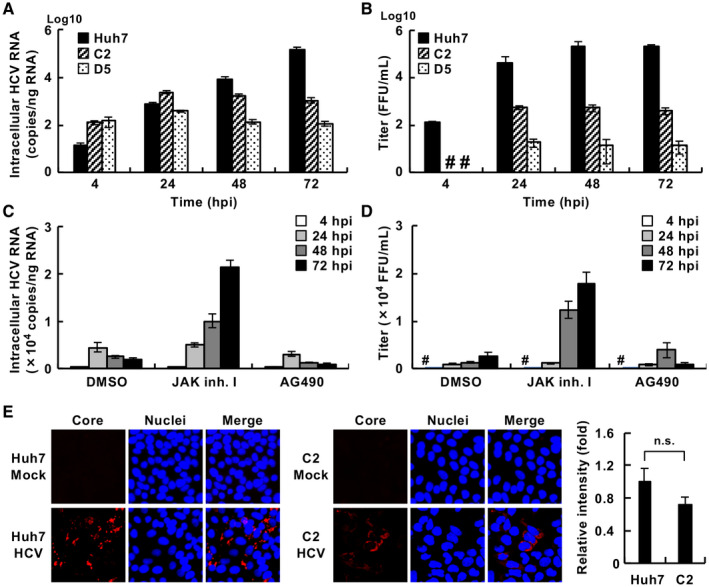
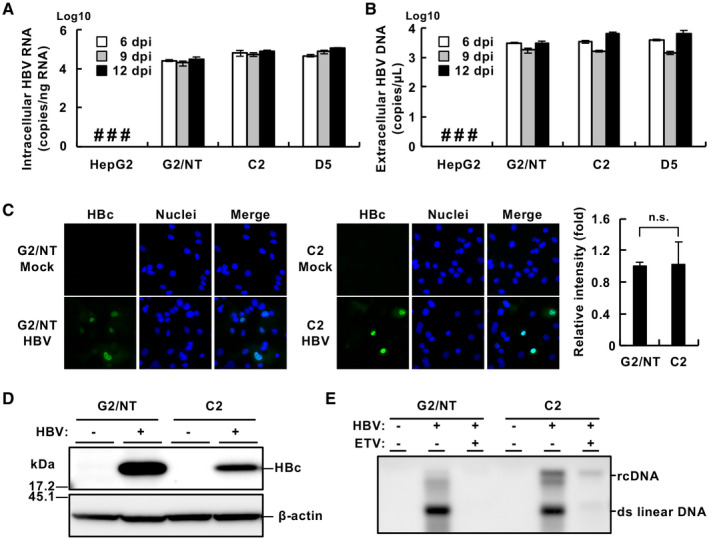
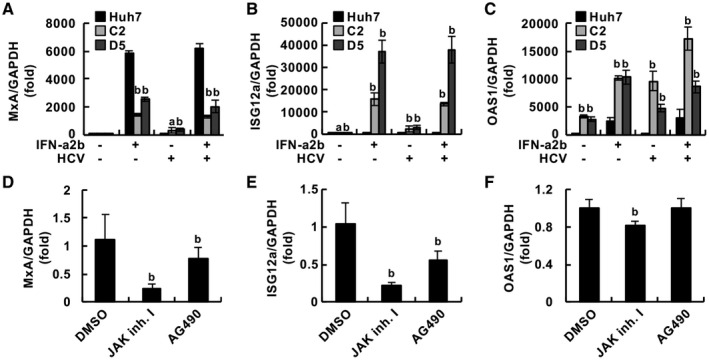
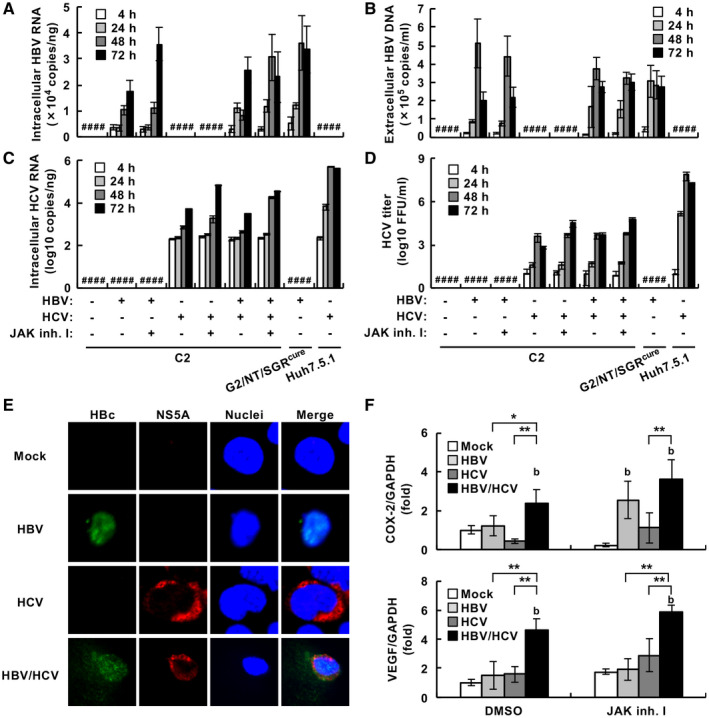
Compared with each monoinfection, coinfection with hepatitis B virus (HBV) and hepatitis C virus (HCV) is well known to increase the risks of developing liver cirrhosis and hepatocellular carcinoma. However, the mechanism by which HBV/HCV coinfection is established in hepatocytes is not well understood. Common cell culture models for coinfection are required to examine viral propagation. In this study, we aimed to establish a cell line permissive for both HBV and HCV infection. We first prepared a HepG2 cell line expressing sodium taurocholate cotransporting polypeptide, an HBV receptor, and then selected a cell line highly permissive for HBV infection, G2/NT18-B. After transduction with a lentivirus-encoding microRNA-122, the cell line harboring the highest level of replicon RNA was selected and then treated with anti-HCV compounds to eliminate the replicon RNA. The resulting cured cell line was transduced with a plasmid-encoding CD81. The cell line permissive for HCV infection was cloned and then designated the G2BC-C2 cell line, which exhibited permissiveness for HBV and HCV propagation. JAK inhibitor I potentiated the HCV superinfection of HBV-infected cells, and fluorescence-activated cell-sorting analysis indicated that HBV/HCV double-positive cells accounted for approximately 30% of the coinfected cells. Among several host genes tested, cyclooxygenase-2 showed synergistic induction by coinfection compared with each monoinfection. Conclusion: These data indicate that our in vitro HBV/HCV coinfection system provides an easy-to-use platform for the study of host and viral responses against coinfection and the development of antiviral agents targeting HBV and HCV.


Figures

Fig. 1
Fig. 1
Establishment of cell lines permissive for HBV infection. (A) Binding of the wild‐type form (black line) or N9K‐mutant form (gray histogram) of a preS1 lipopeptide to each cell line was analyzed by FACS analysis. (B) HepG2‐derived cell lines were infected with various amounts of HBV. The resulting cells were harvested at 6 dpi to measure the amount of intracellular HBV RNA by quantitative real‐time polymerase chain reaction (PCR). (C) Cells were infected with various amounts of HBV. The amounts of supernatant HBV DNA harvested at the indicated times were measured by quantitative PCR. #Not detected. Abbreviations: A3, HepG2/NTCPA3; C4, HepG2‐hNTCP‐C4; 18‐A, G2/NT18‐A; 18‐B, G2/NT18‐B; 18‐C, G2/NT18‐C.
Fig. 2
Fig. 2
Establishment of HepG2‐derived cell lines supporting HBV infection and HCV replication. (A) Ratio of the relative expression levels of miR‐122 and U6 small nuclear RNA was evaluated by quantitative real‐time PCR. Statistical significance was calculated by one‐way analysis of variance (ANOVA) followed by Dunnett’s post hoc test to compare values for other cell lines with that for Huh7 cells (b, P < 0.01). (B) Amount of intracellular HCV RNA was measured by quantitative real‐time PCR. Statistical significance was calculated by Student t test (**P < 0.01). (C) Upper half of the panel: Total RNA was subjected to northern blot analysis using an RNA probe specific for the NS3 gene. Ribosomal RNAs were stained with ethidium bromide. In vitro–transcribed SGR RNA was applied as a size control. Lower half of the panel: Cell lysates were subjected to western blot analysis. (D) Cells were incubated with the wild‐type form (black line) or N9K‐mutant form (gray histogram) of a preS1 lipopeptide and analyzed by flow cytometry. #Not detected. Abbreviation: G2/NT, G2/NT18‐B.
Fig. 3
Fig. 3
Effect of culture conditions on the replication of HBV and HCV. (A‐C) Cells were infected with HBV and then maintained for 6 days in various culture media, as shown in Supporting Fig. S4. The amounts of intracellular HBV RNA (A), extracellular HBV DNA (B), and intracellular HCV RNA (C) were measured by quantitative real‐time PCR or quantitative PCR. Statistical significance was calculated by one‐way ANOVA followed by Dunnett’s post hoc test to compare the results for other groups with those for the condition 1 group (a, P < 0.05; b, P < 0.01). (D,E) Cells were infected with HBV and then incubated for 6 days in condition 4 supplemented without (white bar) or with (black bar) 2% DMSO. The amounts of intracellular HBV RNA (D) and extracellular HBV DNA (E) were measured by quantitative real‐time RT‐PCR or quantitative PCR. (F) Cells infected with HBV (HBV+) or mock‐infected cells (HBV) were cultured for 6 days in the presence (black bar) or absence (white bar) of 2% DMSO. The amount of intracellular HCV RNA was measured by quantitative real‐time PCR. (D‐F) Statistical significance was calculated by one‐way ANOVA followed by Dunnett’s post hoc test to compare the DMSO groups with the non‐DMSO groups (b, P < 0.01). #Not detected.
Fig. 4
Fig. 4
Efficiency of HCV entry into HepG2‐derived cell lines. (A) Expression of CD81 on the cell surface was analyzed by FACS using an anti‐CD81 antibody (black line) or an isotype control IgG (gray histogram). (B) Cell lysates of each cell line were subjected to western blot analysis. (C) Cells of each line were inoculated with HCVpp, vesicular stomatitis virus pseudoparticles, or nonenveloped pseudoparticles. The cells were harvested at 24 hpi and subjected to a luciferase assay. Statistical significance was calculated by Student t test (*P < 0.05; **P < 0.01). (D) Cells of each line were incubated with the wild‐type form (black line) or N9K‐mutant form (gray histogram) of a preS1 lipopeptide and then analyzed by FACS. Abbreviations: C2, G2BC‐C2; D5, G2BC‐D5; ENV(‐), nonenveloped pseudoparticles; G2, HepG2; VSVpp, vesicular stomatitis virus pseudoparticles.
Fig. 5
Fig. 5
Permissiveness of the HepG2‐derived cell lines for HCV. (A,B) The indicated cells were incubated with the HCVcc JFH1 strain at a multiplicity of infection (moi) of 1 for 4 hours and then cultured in fresh medium until the indicated time points. The amounts of intracellular HCV RNA (A) and supernatant infectious particles (B) were measured by quantitative real‐time PCR and a focus‐forming assay, respectively. (C,D) G2BC‐C2 cells were incubated with HCVcc at an moi of 1 for 4 hours and then cultured in fresh medium containing 10 µM JAK inhibitor I or AG490. DMSO was used as a vehicle control. The amounts of intracellular HCV RNA (C) and supernatant infectious particles (D) were measured by quantitative real‐time PCR and a focus‐forming assay, respectively. (E) Cells were incubated with HCVcc or mock‐infected, immunostained with an anti‐HCV core Ab (red), and counterstained with DAPI (blue). The mean fluorescent intensity of HCV core signal was evaluated using ImageJ software (right graph). Statistical significance was calculated by Student t test (P > 0.05). #Not detected. Abbreviations: FFU, focus‐forming unit; n.s., not significant.
Fig. 6
Fig. 6
Infectivity of HBV in HepG2‐derived cell lines. Cells were infected with HBV (1,000 GEq/cell) according to the method described in the Supporting Materials and Methods. The resulting cells and culture supernatant were harvested at 6, 9, or 12 dpi. The amounts of intracellular HBV RNA (A) and extracellular HBV DNA (B) were measured by quantitative real‐time PCR or quantitative PCR. (C) Cells were fixed at 9 dpi, immunostained with an anti‐HBc Ab (green), and counterstained with DAPI (blue). The mean fluorescent intensity of HBc signal was evaluated using ImageJ software (right graph). Statistical significance was calculated by Student t test (P > 0.05). (D) The lysates of cells harvested at 9 dpi were subjected to western blot analysis. (E) Nucleocapsid‐associated HBV DNA prepared from cells harvested at 9 dpi was detected by southern blot analysis. The cells were incubated in the presence (+) or absence (‐) of 10 nM entecavir. #Not detected. Abbreviations: ETV, entecavir; n.s., not significant; rcDNA, relaxed circular DNA.
Fig. 7
Fig. 7
Innate immune response in cells infected with HCV. (A‐C) The indicated cells were infected with HCVcc at an moi of 1 or mock‐infected and then treated with 500 IU/mL IFN‐α2b or vehicle. The relative mRNA levels of MxA (A), ISG12a (B), and OAS1 (C) compared with the GAPDH mRNA level were measured by quantitative real‐time PCR. Each value was normalized to that of the control group (IFN‐α2b, ‐; HCV, ‐). Statistical significance was calculated by one‐way ANOVA followed by Dunnett’s post hoc test to compare the other groups with the control group (a, P < 0.05; b, P < 0.01). (D‐F) G2BC‐C2 cells were infected with HCVcc at an moi of 1 and then treated with or without 10 µM JAK inhibitor I or AG490. The relative mRNA levels of MxA (D), ISG12a (E), and OAS1 (F) compared with the GAPDH mRNA level were measured by quantitative real‐time PCR. Each value was normalized to that of the DMSO‐treated group. Statistical significance was calculated by one‐way ANOVA followed by Dunnett’s post hoc test to compare the other groups with the DMSO‐treated group (b, P < 0.01). Abbreviation: GAPDH, glyceraldehyde 3‐phosphate dehydrogenase.
Fig. 8
Fig. 8
Evaluation of HBV and HCV propagation in HCV‐superinfected and HBV‐infected G2BC‐C2 cells. (A‐D,F) The indicated cells were infected with HBV at 1,000 GEq/cell. A DMEM‐based medium (condition 4 in Fig. 3) was used in these experiments. The HBV‐infected cells were further incubated with HCV at an moi of 1 for 4 hours, washed, and incubated in the presence or absence of 10 µM JAK inhibitor I. The resulting cells and supernatants were harvested at 4, 24, 48, or 72 hours after HCV inoculation. The amounts of intracellular HBV RNA (A), extracellular HBV DNA (B), and intracellular HCV RNA (C) were measured by quantitative real‐time PCR or quantitative PCR. (D) The amount of extracellular infectious HCV particles was measured by a focus‐forming assay. (E) Cells were infected with HBV at 10,000 GEq/cell, incubated for 6 days, and then infected with HCV at an moi of 1 in the presence of 10 µM JAK inhibitor I. The resulting cells were fixed on day 3 following infection with HCV and then stained with anti‐HBc (green) and anti‐NS5A (red) antibodies. All cells were counterstained with DAPI (blue). (F) The relative mRNA levels of COX‐2 (upper graph) and VEGF (lower graph) were measured by quantitative real‐time PCR. Statistical significance was calculated by Student t test (*P < 0.05; **P < 0.01) or one‐way ANOVA followed by Dunnett’s post hoc test to compare the values of other groups with that of the mock‐infected group (b, P < 0.01). #Not detected.

Similar articles

Cited by

References

    1. Ward JW, Hinman AR. What is needed to eliminate hepatitis B virus and hepatitis C virus as global health threats. Gastroenterology 2019;156:297‐310. - PubMed
    1. Abdelaal R, Yanny B, El Kabany M. HBV/HCV coinfection in the era of HCV‐DAAs. Clin Liver Dis 2019;23:463‐472. - PubMed
    1. Kawagishi N, Suda G, Onozawa M, Kimura M, Maehara O, Ohara M, et al. Comparing the risk of hepatitis B virus reactivation between direct‐acting antiviral therapies and interferon‐based therapies for hepatitis C. J Viral Hepat 2017;24:1098‐1106. - PubMed
    1. Sagnelli E, Coppola N, Messina V, Di Caprio D, Marrocco C, Marotta A, et al. HBV superinfection in hepatitis C virus chronic carriers, viral interaction, and clinical course. Hepatology 2002;36:1285‐1291. - PubMed
    1. Rodriguez‐Inigo E, Bartolome J, Ortiz‐Movilla N, Platero C, Lopez‐Alcorocho JM, Pardo M, et al. Hepatitis C virus (HCV) and hepatitis B virus (HBV) can coinfect the same hepatocyte in the liver of patients with chronic HCV and occult HBV infection. J Virol 2005;79:15578‐15581. - PMC - PubMed

Publication types