

Comparing health-related quality of life in modified Rankin Scale grades: 15D results from 323 patients with brain arteriovenous malformation and population controls
- PMID: 33860377
- PMCID: PMC8195799
- DOI: 10.1007/s00701-021-04847-7
Comparing health-related quality of life in modified Rankin Scale grades: 15D results from 323 patients with brain arteriovenous malformation and population controls
Abstract
Background: We wanted to understand how patients with different modified Rankin Scale (mRS) grades differ regarding their health-related quality of life (HRQoL) and how this affects the interpretation and dichotomization of the grade.
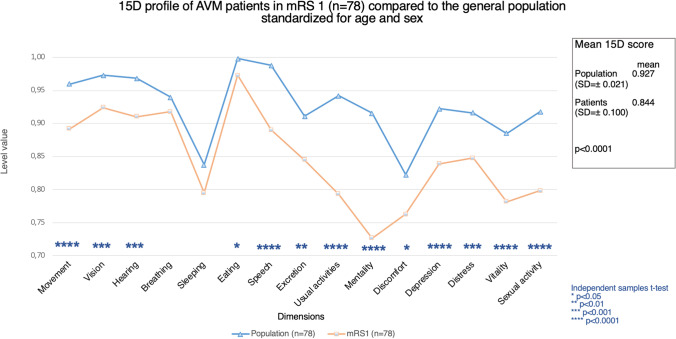
Methods: In 2016, all adult patients in our brain arteriovenous malformation (AVM) database (n = 432) were asked to fill in mailed letters including a questionnaire about self-sufficiency and lifestyle and the 15D HRQoL questionnaire. The follow-up mRS was defined in 2016 using the electronic patient registry and the questionnaire data. The 15D profiles of each mRS grade were compared to those of the general population and to each other, using ANCOVA with age and sex standardization.
Results: Patients in mRS 0 (mean 15D score = 0.954 ± 0.060) had significantly better HRQoL than the general population (mean = 0.927 ± 0.028), p < 0.0001, whereas patients in mRS 1-4 had worse HRQoL than the general population, p < 0.0001. Patients in mRS 1 (mean = 0.844 ± 0.100) and mRS 2 (mean = 0.838 ± 0.107) had a similar HRQoL. In the recently published AVM research, the most commonly used cut points for mRS dichotomization were between mRS 1 and 2 and between mRS 2 and 3.
Conclusions: Using 15D, we were able to find significant differences in the HRQoL between mRS 0 and mRS 1 AVM patients, against the recent findings on stroke patients using EQ-5D in their analyses. Although the dichotomization cut point is commonly set between mRS 1 and 2, patients in these grades had a similar HRQoL and a decreased ability to continue their premorbid lifestyle, in contrast to patients in mRS 0.
Keywords: Arteriovenous malformation; Cerebrovascular malformations; Modified Rankin Scale; Quality of life.
Conflict of interest statement
A. Pohjola, E. Oulasvirta, A. Hafez, P. Koroknay-Pál, H. Lehto, M. Niemelä, and A. Laakso report Finnish government funding for academic health care research (grant TYH 2017235). R. Roine and H. Sintonen report no financial disclosures. H. Sintonen is the developer of the 15D.
Figures


Similar articles
-
Long-term health-related quality of life in 262 patients with brain arteriovenous malformation.Neurology. 2019 Oct 1;93(14):e1374-e1384. doi: 10.1212/WNL.0000000000008196. Epub 2019 Sep 11. Neurology. 2019. PMID: 31511351
-
A treatment paradigm for high-grade brain arteriovenous malformations: volume-staged radiosurgical downgrading followed by microsurgical resection.J Neurosurg. 2015 Feb;122(2):419-32. doi: 10.3171/2014.10.JNS1424. Epub 2014 Nov 28. J Neurosurg. 2015. PMID: 25423274
-
Toward a comprehensive assessment of functional outcomes in pediatric patients with brain arteriovenous malformations: the Pediatric Quality of Life Inventory.J Neurosurg Pediatr. 2016 Nov;18(5):611-622. doi: 10.3171/2016.6.PEDS16103. Epub 2016 Aug 19. J Neurosurg Pediatr. 2016. PMID: 27540697
-
Responses to ARUBA: a systematic review and critical analysis for the design of future arteriovenous malformation trials.J Neurosurg. 2017 Feb;126(2):486-494. doi: 10.3171/2015.6.JNS15619. Epub 2016 Apr 29. J Neurosurg. 2017. PMID: 27128584
-
Health Utility Weighting of the Modified Rankin Scale: A Systematic Review and Meta-analysis.JAMA Netw Open. 2020 Apr 1;3(4):e203767. doi: 10.1001/jamanetworkopen.2020.3767. JAMA Netw Open. 2020. PMID: 32347948 Free PMC article.
Cited by
-
Long-term follow-up in patients with brain arteriovenous malformation based on the Quality of Life Scale and socioeconomic status.Neurosurg Rev. 2022 Oct;45(5):3281-3290. doi: 10.1007/s10143-022-01847-8. Epub 2022 Sep 9. Neurosurg Rev. 2022. PMID: 36083567
References
-
- Adriana Pérez BCT (2016) 63 - Conduct of stroke-related clinical trials. Stroke (Sixth Edition), vol 6. Elsevier. 10.1016/B978-0-323-29544-4.00063-3
Publication types
MeSH terms
LinkOut - more resources
Full Text Sources
Other Literature Sources
Medical
