

Nuclear Dishevelled targets gene regulatory regions and promotes tumor growth
- PMID: 33860601
- PMCID: PMC8183407
- DOI: 10.15252/embr.202050600
Nuclear Dishevelled targets gene regulatory regions and promotes tumor growth
Abstract
Dishevelled (DVL) critically regulates Wnt signaling and contributes to a wide spectrum of diseases and is important in normal and pathophysiological settings. However, how it mediates diverse cellular functions remains poorly understood. Recent discoveries have revealed that constitutive Wnt pathway activation contributes to breast cancer malignancy, but the mechanisms by which this occurs are unknown and very few studies have examined the nuclear role of DVL. Here, we have performed DVL3 ChIP-seq analyses and identify novel target genes bound by DVL3. We show that DVL3 depletion alters KMT2D binding to novel targets and changes their epigenetic marks and mRNA levels. We further demonstrate that DVL3 inhibition leads to decreased tumor growth in two different breast cancer models in vivo. Our data uncover new DVL3 functions through its regulation of multiple genes involved in developmental biology, antigen presentation, metabolism, chromatin remodeling, and tumorigenesis. Overall, our study provides unique insight into the function of nuclear DVL, which helps to define its role in mediating aberrant Wnt signaling.
Keywords: ChIP-seq; DVL; Wnt; breast cancer; epigenetics.
© 2021 The Authors.
Conflict of interest statement
The authors have no competing interests as defined by EMBO Reports, or other interests that might be perceived to influence the results and/or discussion reported in this paper.
Figures


- A
Venn diagram representing overlap of DVL3 ChIP‐seq peaks between MDA‐MB‐468 and MCF7 cells.
- B
MEME‐ChIP (Motif Analysis of Large Nucleotide Datasets) analysis of the DVL3 binding sites identified DVL3‐specific motifs in MDA‐MB‐468 cells: TGGAATGGAATGGAATGGAAT in 622 fragments with a P value = 3.1e‐4486, ATTCCATTCCATTC in 673 with a P value = 8.6e‐1868, and TTCCATTCCATTCCATTCCA in 605 fragments with a P value = 2.9e‐1614. The P value is the significance of the motif according to MEME, motif discovery program.
- C
MEME‐ChIP analysis of the DVL3‐binding sites identified DVL3‐specific motifs in MCF7 cells: CAGAAKVATTCTCAGAAACTYCTTTGTGA in 1394 fragments with a P value = 1.5e‐2815, GTGTGYRTTCAACTCACAGAGTTGAACSTT in 1143 fragments with a P value = 3.7e‐2478 and KGAAACACTCTTTTTGTAKAWTYTGCAAG in 1359 fragments with a P value = 9.4e‐2181. The P value is the significance of the motif according to MEME, motif discovery program.
- D, E
Pie graph showing enriched pathways of ChIP hits for MDA‐MB‐468 (D) and MCF7 (E) cell lines generated by Reactome pathway analysis.
- F, G
Bar graphs showing the −log10 P‐values for the Reactome terms of the most significant pathways enriched using binomial test in DVL3 ChIP‐seq for MDA‐MB‐468 (F) and MCF7 (G) cell lines.

Table of transcription factor motifs matching DVL3‐binding motif by TOMTOM analysis in MDA‐MB‐468 and MCF7 cell lines. The P‐value, e‐value, and q‐value were obtained with TOTOM software.
DVL3 co‐immunoprecipitates ZBTB7B and vice versa in MCF7. IgG heavy chain (Hc) and light chain (Lc) were blotted for as a control for equal antibody capture for immunoprecipitation and whole cell extracts (WCE) as a positive control.
An assembly of IgG (first row), DVL3 (second row), and ZBTB7B (third row) ChIP‐seq data in MCF7 for the RFX5‐GBAT2, GPD1‐COX14, MAST3, and HLA‐E genes, visualized by IGV.
Venn diagram showing the overlap between MCF7 DVL3 ChIP‐seq peaks and ZBTB7B ChIP‐seq.
ChIP experiments for Input, IgG, DVL3, and ZBTB7B were performed in MDA‐MB‐468 cells. Occupancy of DVL3 at three different genes (MAMDC2, DUX4, and SYNJ1) was analyzed by end‐point PCR.
Western blot for DVL3 expression in NTC and shDVL3 KD in MDA‐MB‐468 and MCF7 cell lines.

An assembly of IgG (first row) and DVL3 (second row) ChIP‐seq data in MDA‐MB‐468 for the ARAP1, RFX5‐GBAT2, WDR74, POU2F3, SNORD3D, and HLA‐A genes, visualized by IGV.
An assembly of IgG (first row) and DVL3 (second row) ChIP‐seq data in MCF7 for the ARAP1, RFX5‐GBAT2, ZNF672, SSC5D, HLA‐A, and HLA‐E genes, visualized by IGV.
ChIP‐qPCRs at ARAP1, RFX5‐GBAT2, WDR74, and HAUS5 promoters for IgG and DVL3 in MDA‐MB‐468 (NTC, shA DVL3, and shB DVL3).
ChIP‐qPCRs at RFX5‐GBAT2, COX14, HLA‐E, and PSMB8 promoters for IgG and DVL3 in MCF7 (NTC, shA DVL3, and shB DVL3).
RT–qPCR‐based analysis of expression changes of RFX5, GBAT2, WDR74, HCG15, POU2F3, SNORD3B, APOC1P1, HLA‐A, TAP1, PSMD8, PDG1, and JUNB genes in MDA‐MB‐468 (NTC, shA DVL3, and shB DVL3) cells.
RT–qPCR‐based analysis of expression changes of RFX5, GBAT2, PCAT6, ZNF672, SSC5D, APOC1P1, HLA‐A, HLA‐F, and TAP1 genes in MCF7 (NTC, shA DVL3, and shB DVL3) cells.

Expression of top DVL3 ChIP‐seq target genes upregulated in breast cancer patients with high DVL3 expression.
Expression of top DVL3 ChIP‐seq target genes upregulated in breast cancer patients with high KMT2D expression.
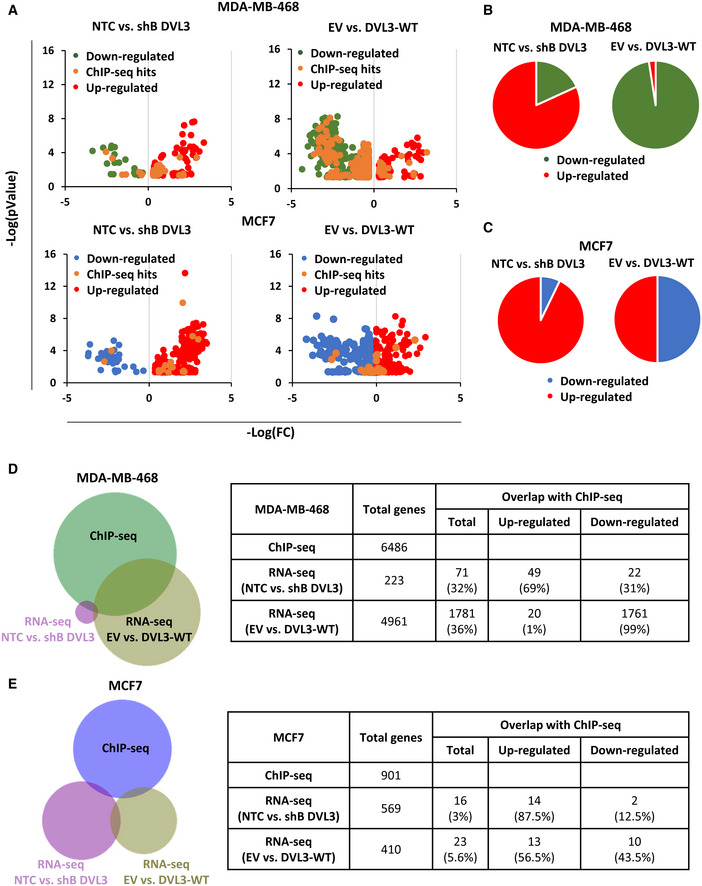
Volcano plot represents DVL3 transcriptional targets identified by RNA‐seq in MDA‐MB‐468 cells (NTC vs. shB DVL3 and EV vs. DVL3‐WT, upper panel) and in MCF7 cells (NTC vs. shB DVL3 and EV vs. DVL3‐WT, lower panel). In the upper panel, the green dots represent significant downregulated genes, the red dots represent significantly upregulated genes and the orange dots represent DVL3‐ChIP hits in MDA‐MB‐468 cells. In the lower panel, the blue dots represent significant downregulated genes, the red dots represent significantly upregulated genes, and the orange dots represent DVL3‐ChIP hits in MCF7 cells. Gene expression levels were quantified using Fisher’s Exact Test Signal Search in the DNASTAR ArrayStar software package.
Diagram showing the percentage of upregulated and downregulated genes in the RNA‐seq experiment comparing NTC vs. shB DVL3 (left panel) and EV vs. DVL3‐WT (right panel) in MDA‐MB‐468 cells.
Diagram showing the percentage of upregulated and downregulated genes in the RNA‐seq experiment comparing NTC vs. shB DVL3 (left panel) and EV vs. DVL3‐WT (right panel) in MCF7 cells.
Venn diagram showing overlapping between DVL3‐bound genes and DVL3 transcriptional targets in MDA‐MB‐468 cells. A total of 32% of differentially expressed genes identified by RNA‐seq comparing NTC and shB DVL3 were also DVL3 direct targets identified by ChIP‐seq. From these, 69% were upregulated and 31% down‐regulated. A total of 36% of differentially expressed genes identified by RNA‐seq comparing EV and DVL3‐WT were also DVL3 direct targets identified by ChIP‐seq. From these, 1% were upregulated and 99% down‐regulated.
Venn diagram showing overlapping between DVL3‐bound genes and DVL3 transcriptional targets in MCF7 cells. A total of 3% of differentially expressed genes identified by RNA‐seq comparing NTC and shB DVL3 were also DVL3 direct targets identified by ChIP‐seq. From these, 87.5% were upregulated and 12.5% down‐regulated. A total of 5.6% of differentially expressed genes identified by RNA‐seq comparing EV and DVL3‐WT were also DVL3 direct targets identified by ChIP‐seq. From these, 56.5% were upregulated and 43.5% down‐regulated.

An assembly of IgG (first row), DVL3 (second row), and H3K4me3 peak (third row) ChIP‐seq data in MDA‐MB‐468 for the ARAP1, RFX5‐GBAT2, APOC1P1, PSMB8, TAP1, and HLA‐A genes, visualized by IGV. The green rectangular block is the location of the statistically qualified peak of H3K4me3 in MDA‐MB‐468.
An assembly of IgG (first row), DVL3 (second row), and H3K4me3 (third row) ChIP‐seq data in MCF7 for the HAUS5, APOC1P1, ZNF672, HLA‐A, and HLA‐E genes, visualized by IGV.
ChIP‐qPCRs at ARAP1, RFX5‐GBAT2, KDM5B, APOC1P1, and PSMB8 promoters for IgG and H3K4me3 in MDA‐MB‐468 (NTC, shA DVL3, and shB DVL3).
ChIP‐qPCRs at RFX5‐GBAT2, PCAT6, APOC1P1, and HAUS5 promoters for IgG and H3K4me3 in MCF7 (NTC, shA DVL3, and shB DVL3).
Venn diagram showing the overlap between MDA‐MB‐468 DVL3 ChIP‐seq peaks and H3K4me3 ChIP‐seq
Venn diagram showing the overlap between MCF7 DVL3 ChIP‐seq peaks and H3K4me3 ChIP‐seq
Venn diagram showing the overlap between MCF7 DVL3 ChIP‐seq peaks and FAIRE‐seq.

An assembly of IgG (first row), DVL3 (second row), and KMT2D (third row) ChIP‐seq data in MCF7 for the HAUS5, WDR74, YWHAQ, CDNF/HSPA14, and PRDM10 genes, visualized by IGV. The bar below the DVL3 peak is the location of the statistically qualified peak of KMT2D in MCF7.
Venn diagram showing the overlap between MCF7 DVL3 ChIP‐seq peaks and KMT2D ChIP‐seq.
ChIP‐qPCRs at ARAP1, RFX5‐GBAT2, and PSMB8 promoters for IgG and KMT2D in MDA‐MB‐468 (NTC, shA DVL3, and shB DVL3).
An assembly of IgG (first row), DVL3 (second row), H3K27ac (third row), and H4K8ac peak (fourth row) ChIP‐seq data in MDA‐MB‐468 for the PRDM10, TRIM26, BTN2A1, PNRC2, and MR1 genes, visualized by IGV. The green rectangular bars are the locations of the statistically qualified peak of H3K27ac or H4K8ac in MDA‐MB‐468.
An assembly of IgG (first row), DVL3 (second row), H3K27ac (third row), and H4K8ac peak (fourth row) ChIP‐seq data in MCF7 for the WDR74, YWHAQ, CDNF/HSPA14, BTN2A1, and MR1 genes, visualized by IGV. The turquoise and purple rectangular bars are the locations of the statistically qualified peak of H3K27ac or H4K8ac in MCF7, respectively.
Venn diagram showing the overlap between MDA‐MB‐468 DVL3 ChIP‐seq peaks and H3K27ac ChIP‐seq.
Venn diagram showing the overlap between MCF7 DVL3 ChIP‐seq peaks and H3K27ac ChIP‐seq.
Venn diagram showing the overlap between MDA‐MB‐468 DVL3 ChIP‐seq peaks and H4K8ac ChIP‐seq
Venn diagram showing the overlap between MCF7 DVL3 ChIP‐seq peaks and H4K8ac ChIP‐seq.
Venn diagram showing the overlap between MDA‐MB‐468 DVL3 ChIP‐seq peaks and super‐enhancer targets in basal breast carcinoma (BRCA)
Venn diagram showing the overlap between MCF7 DVL3 ChIP‐seq peaks and super‐enhancer targets in luminal breast carcinoma.

Pearson correlation of DVL3 expression with ARAP1, BRD2, RFX5, CLASP1, HLA‐E, PRDM10, ZNF672, and HNRNPUL2.
Pearson correlation of KMT2D expression with ARAP1, BRD2, RFX5, CLASP1, HLA‐E, PRDM10, ZNF672, and HNRNPUL2.


DVL3 co‐immunoprecipitates KMT2D in MDA‐MB‐468 cells (upper panel) and MCF7 cells (lower panel). IgG heavy chain (Hc) was blotted for as a control for equal antibody capture for immunoprecipitation and whole cell extracts (WCE) as a positive control.
MDA‐MB‐468 histone extracts from NTC, shA DVL3, and shB DVL3 subjected to immunoblot analysis for H3K4me3 and H3.
An assembly of IgG (first row), DVL3 (second row) ChIP‐seq in MDA‐MB‐468 cells, IgG (third row), and DVL3 (fourth row) ChIP‐seq data in MCF7 for the KMT2D gene, visualized by IGV. Each column is 20,000 bp wide. The fifth row shows the location and orientation of the KMT2D gene.
RT–qPCR‐based analysis of expression changes of DVL3 in MDA‐MB‐468 (NTC, shA DVL3, and shB DVL3) cells.
RT–qPCR‐based analysis of expression changes of KMT2D in MDA‐MB‐468 (NTC, shA DVL3, and shB DVL3) cells.
RT–qPCR‐based analysis of expression changes of DVL3 in MCF7 (NTC, shA DVL3, and shB DVL3) cells.
RT–qPCR‐based analysis of expression changes of KMT2D in MCF7 (NTC, shA DVL3, and shB DVL3) cells.
Immunofluorescence of KMT2D localization in MDA‐MB‐468 cells. The cells were probed with KMT2D antibody (red). The nucleus was stained with DAPI (blue), and the actin filaments (green) were stained with Phalloidin. Merge of KMT2D (red) and nuclear staining (blue) is shown as KMT2D/DAPI, merge of KMT2D (red) and actin (green) is shown as KMT2D/ACTIN, and, merge of KMT2D (red), nuclear staining (blue) and actin (green) is shown as MERGE for NTC, shA DVL3, and shB DVL3 cells. Scale bar: 10 µm
Sequential ChIP (ChIP‐reChIP) to examine occupancy of DVL3 and KMT2D at RFX5, HAUS5, COX14, APOC1P1, WDR74, JUNB, and HLA‐A promoters analyzed by end‐point PCR.
Sequential ChIP (ChIP‐reChIP) to examine occupancy of DVL3 and H3K4me3 at RFX5, APOC1P1, JUNB, and, HLA‐A promoters analyzed by end‐point PCR.

Quantification of spheroids’ area in MDA‐MB‐468 cell line (NTC vs. shA DVL3). The data are presented as the mean ± SD, n = 3 showing statistical difference after 32 h *P < 0.05.
Quantification of the spheroids’ area in the MCF7 cell line (NTC, shA DVL3, and shB DVL3). The data are presented as the mean ± SD, n = 3 showing statistical difference after 100 h *P < 0.05.
IVIS images showing representative tumors generated by injecting luciferase‐expressing MDA‐MB‐468 cells (NTC, shA DVL3, or shB DVL3) in the mammary fat pad of SCID mice. Color scale (luminescent signal intensity): blue, least intense signal; red, most intense signal.
Quantification of luminescence changes in tumors generated by injecting luciferase‐expressing MDA‐MB‐468 cells (NTC, shA DVL3, or shB DVL3) in the mammary fat pad of SCID mice, Average luminescence was used to measure volume of tumor; n ≥ 9.
Tumor pictures of tumors resulting from the injections of MDA‐MB‐468 (NTC, shA DVL3, or shB DVL3) in the mammary fat pad of SCID mice. Scale shown in cm.
Final weight of tumors resulting from the injections of MDA‐MB‐468 (NTC, shA DVL3, or shB DVL3) in the mammary fat pad of SCID mice. One‐way ANOVA was used for statistical comparison, n ≥ 9.
IVIS images showing representative tumors generated by injecting luciferase‐expressing MCF7 cells (NTC, shA DVL3) in the mammary fat pad of SCID mice. Color scale (luminescent signal intensity): blue, least intense signal; red, most intense signal.
Quantification of luminescence changes in tumors generated by injecting luciferase‐expressing MCF7 cells (NTC, shA DVL3) in the mammary fat pad of SCID mice. Average luminescence was used to measure volume of tumor. n = 7.

Immunofluorescence of HA‐tagged DVL3 localization in MDA‐MB‐468 cells. The cells were probed with an HA antibody (red). The nucleus was stained with DAPI (blue), and the actin filaments (green) were stained with Phalloidin. Merge of actin (green) and nuclear staining (blue) is shown as ACTIN/DAPI, merge of DVL3 (red) and nuclear staining (blue) is shown as HA/DAPI, merge of DVL3 (red) and actin (green) is shown as HA/ACTIN, and merge of DVL3 (red), nuclear staining (blue) and actin (green) is shown as MERGE for empty vector (EV), HA‐DVL3‐WT and HA‐DVL3‐NESm transient transfected cells. Scale bar: 10 µm.
RT–qPCR‐based analysis of expression changes of DVL3 in stable MDA‐MB‐468 (EV, HA‐DVL3‐NESm) cells.
RT–qPCR‐based analysis of expression changes of KMT2D in stable MDA‐MB‐468 (EV, HA‐DVL3‐NESm) cells.
RT–qPCR‐based analysis of expression changes of ARAP1, RFX5, GBAT2, WDR74, SNORD3D, HAUS5, TAP1, HLA‐A, PDG1, and MR1 in stable MDA‐MB‐468 (EV, HA‐DVL3‐NESm) cells.
Images and quantification of spheroid areas in stable MDA‐MB‐468 cell line (EV, HA‐DVL3‐WT, and HA‐DVL3‐NESm). The data are presented as the mean ± SD, n = 8 showing statistical difference after 32 h for HA‐DVL3‐WT respect to EV and 48 h for HA‐DVL3‐NESm respect to EV *P < 0.05. Independent t‐tests were performed per time point for statistical comparison. Scale bar: 300 µm.
Proposed model of the role of DVL3, colocalizing with transcription factors such as ZBTB7B and chromatin‐modifying enzymes as KMT2D in transcriptional regulatory region and regulate transcription.
References
-
- Allis CD, Berger SL, Cote J, Dent S, Jenuwien T, Kouzarides T, Pillus L, Reinberg D, Shi Y, Shiekhattar R et al (2007) New nomenclature for chromatin‐modifying enzymes. Cell 131: 633–636 - PubMed
Publication types
MeSH terms
Substances
Grants and funding
LinkOut - more resources
Full Text Sources
Other Literature Sources
Medical
Miscellaneous
