

Polysulfates Block SARS-CoV-2 Uptake through Electrostatic Interactions*
- PMID: 33860605
- PMCID: PMC8250366
- DOI: 10.1002/anie.202102717
Polysulfates Block SARS-CoV-2 Uptake through Electrostatic Interactions*
Abstract
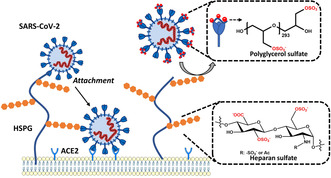
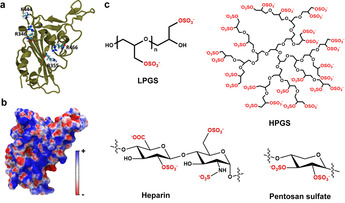
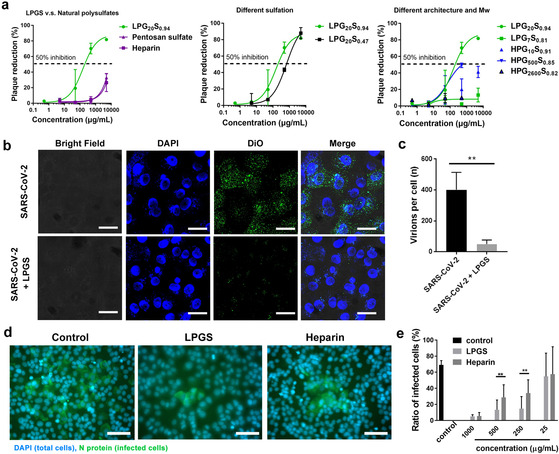
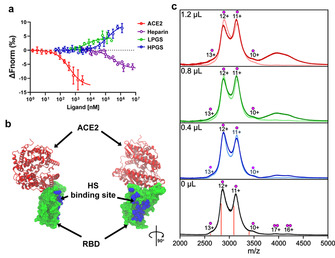
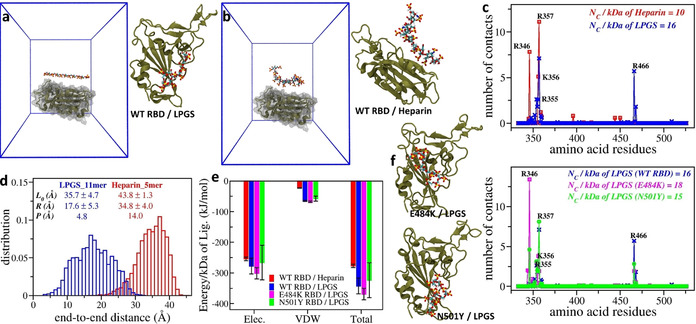
Here we report that negatively charged polysulfates can bind to the spike protein of SARS-CoV-2 via electrostatic interactions. Using a plaque reduction assay, we compare inhibition of SARS-CoV-2 by heparin, pentosan sulfate, linear polyglycerol sulfate (LPGS) and hyperbranched polyglycerol sulfate (HPGS). Highly sulfated LPGS is the optimal inhibitor, with an IC50 of 67 μg mL-1 (approx. 1.6 μm). This synthetic polysulfate exhibits more than 60-fold higher virus inhibitory activity than heparin (IC50 : 4084 μg mL-1 ), along with much lower anticoagulant activity. Furthermore, in molecular dynamics simulations, we verified that LPGS can bind more strongly to the spike protein than heparin, and that LPGS can interact even more with the spike protein of the new N501Y and E484K variants. Our study demonstrates that the entry of SARS-CoV-2 into host cells can be blocked via electrostatic interactions, therefore LPGS can serve as a blueprint for the design of novel viral inhibitors of SARS-CoV-2.
Keywords: SARS-CoV-2; electrostatic interactions; inhibition; polysulfates; virus binding.
© 2021 The Authors. Angewandte Chemie International Edition published by Wiley-VCH GmbH.
Conflict of interest statement
The authors declare no conflict of interest.
Figures
Similar articles
-
Effective Inhibition of SARS-CoV-2 Entry by Heparin and Enoxaparin Derivatives.J Virol. 2021 Jan 13;95(3):e01987-20. doi: 10.1128/JVI.01987-20. Print 2021 Jan 13. J Virol. 2021. PMID: 33173010 Free PMC article.
-
The binding of heparin to spike glycoprotein inhibits SARS-CoV-2 infection by three mechanisms.J Biol Chem. 2022 Feb;298(2):101507. doi: 10.1016/j.jbc.2021.101507. Epub 2021 Dec 18. J Biol Chem. 2022. PMID: 34929169 Free PMC article.
-
Withanone from Withania somnifera Attenuates SARS-CoV-2 RBD and Host ACE2 Interactions to Rescue Spike Protein Induced Pathologies in Humanized Zebrafish Model.Drug Des Devel Ther. 2021 Mar 11;15:1111-1133. doi: 10.2147/DDDT.S292805. eCollection 2021. Drug Des Devel Ther. 2021. PMID: 33737804 Free PMC article.
-
Heparin-binding Peptides as Novel Therapies to Stop SARS-CoV-2 Cellular Entry and Infection.Mol Pharmacol. 2020 Nov;98(5):612-619. doi: 10.1124/molpharm.120.000098. Epub 2020 Sep 10. Mol Pharmacol. 2020. PMID: 32913137 Free PMC article. Review.
-
Inhibition of S-protein RBD and hACE2 Interaction for Control of SARSCoV- 2 Infection (COVID-19).Mini Rev Med Chem. 2021;21(6):689-703. doi: 10.2174/1389557520666201117111259. Mini Rev Med Chem. 2021. PMID: 33208074 Review.
Cited by
-
Short-Range Cooperative Slow-down of Water Solvation Dynamics Around SO4 2--Mg2+ Ion Pairs.ACS Phys Chem Au. 2022 Nov 23;2(6):506-514. doi: 10.1021/acsphyschemau.2c00034. Epub 2022 Oct 8. ACS Phys Chem Au. 2022. PMID: 36465835 Free PMC article.
-
Mutational dynamics across VOCs in International travellers and Community transmission underscores importance of Spike-ACE2 interaction.Microbiol Res. 2022 Sep;262:127099. doi: 10.1016/j.micres.2022.127099. Epub 2022 Jun 25. Microbiol Res. 2022. PMID: 35779308 Free PMC article.
-
Mucus-Inspired Dynamic Hydrogels: Synthesis and Future Perspectives.J Am Chem Soc. 2022 Nov 9;144(44):20137-20152. doi: 10.1021/jacs.1c13547. Epub 2022 Sep 8. J Am Chem Soc. 2022. PMID: 36074739 Free PMC article. Review.
-
Self-assembled nanosheets of biocompatible polymers as universal cell-membrane mimic to block viral infection.Bioact Mater. 2025 Jul 3;52:857-865. doi: 10.1016/j.bioactmat.2025.06.035. eCollection 2025 Oct. Bioact Mater. 2025. PMID: 40688067 Free PMC article.
-
Interaction of Polyanionic and Polycationic Brushes with Globular Proteins and Protein-like Nanocolloids.Biomimetics (Basel). 2023 Dec 9;8(8):597. doi: 10.3390/biomimetics8080597. Biomimetics (Basel). 2023. PMID: 38132536 Free PMC article. Review.
References
-
- Koehler M., Delguste M., Sieben C., Gillet L., Alsteens D., Annu. Rev. Virol. 2020, 7, 143–165. - PubMed
-
- Tree J. A., Turnbull J. E., Buttigieg K. R., Elmore M. J., Coombes N., Hogwood J., Mycroft-West C. J., Lima M. A., Skidmore M. A., Karlsson R., Chen Y.-H., Yang Z., Spalluto C. M., Staples K. J., Yates E. A., Gray E., Singh D., Wilkinson T., Page C. P., Carroll M. W., Br. J. Pharmacol. 2021, 178, 626–635. - PMC - PubMed
Publication types
MeSH terms
Substances
Grants and funding
LinkOut - more resources
Full Text Sources
Other Literature Sources
Medical
Miscellaneous
