. 2021 May;32(5):668-681.
doi: 10.1177/0956797620975781. Epub 2021 Apr 16.

Aging Increases Prosocial Motivation for Effort

Affiliations

Aging Increases Prosocial Motivation for Effort

Patricia L Lockwood et al. Psychol Sci. 2021 May.

Abstract

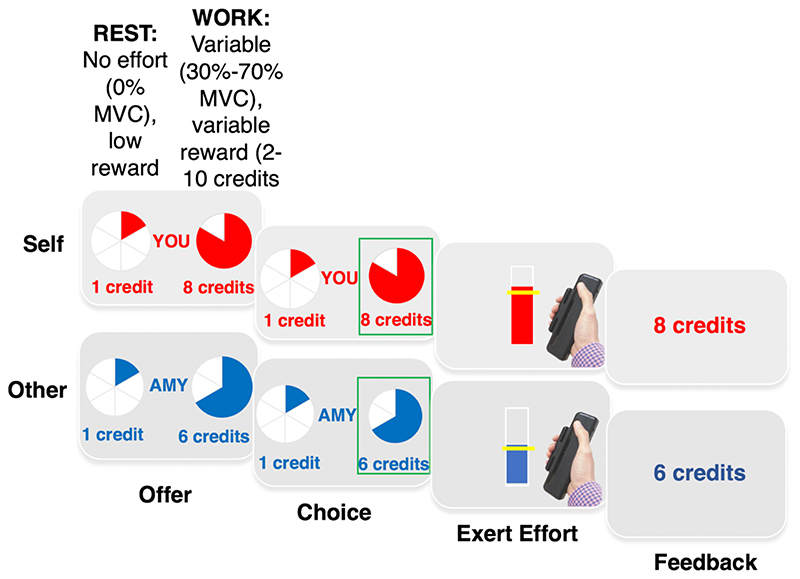
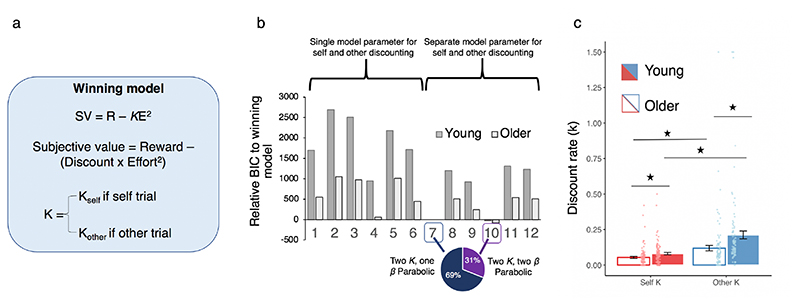
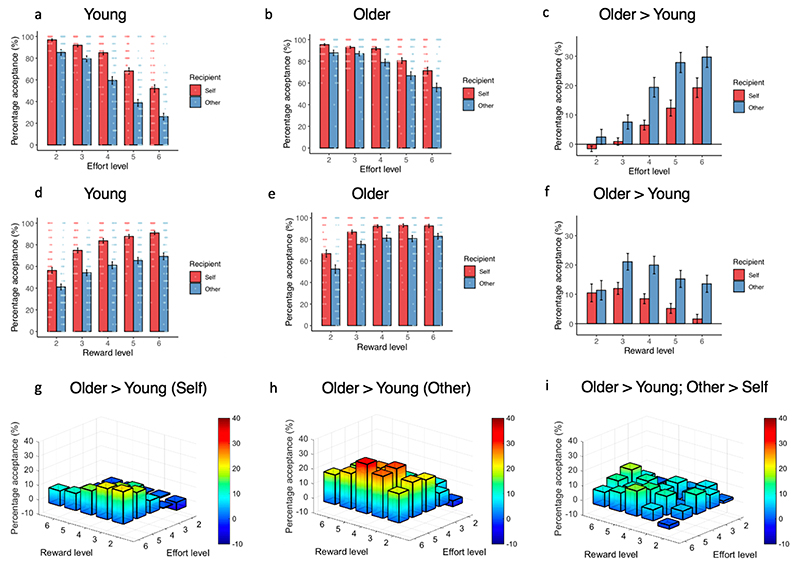
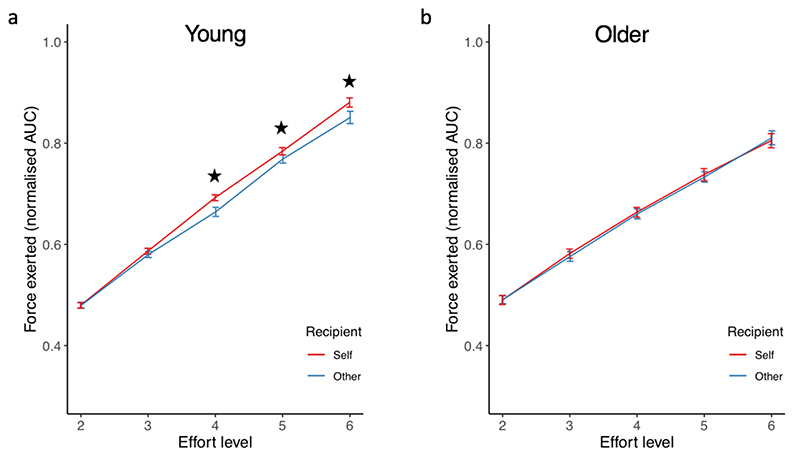
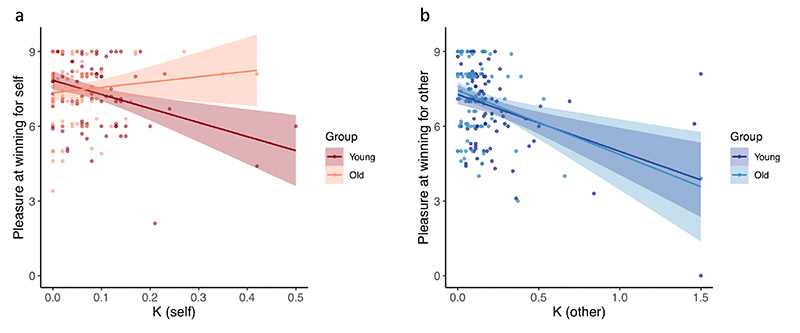
Social cohesion relies on prosociality in increasingly aging populations. Helping other people requires effort, yet how willing people are to exert effort to benefit themselves and others, and whether such behaviors shift across the life span, is poorly understood. Using computational modeling, we tested the willingness of 95 younger adults (18-36 years old) and 92 older adults (55-84 years old) to put physical effort into self- and other-benefiting acts. Participants chose whether to work and exert force (30%-70% of maximum grip strength) for rewards (2-10 credits) accrued for themselves or, prosocially, for another. Younger adults were somewhat selfish, choosing to work more at higher effort levels for themselves, and exerted less force in prosocial work. Strikingly, compared with younger adults, older people were more willing to put in effort for others and exerted equal force for themselves and others. Increased prosociality in older people has important implications for human behavior and societal structure.

Keywords: aging; computational modeling; effort; motivation; open data; prosocial behavior; reward.


Conflict of interest statement

Declaration of interests

The authors have no competing interests

Figures

Figure 1
Figure 1. Prosocial motivation measure.
Participants were assigned to ‘Player 1’ at the beginning of the testing session and told that they would be making decisions that impacted on another player, who they knew was also in the testing session but they would not meet face to face (see methods). Maximum voluntary contraction (MVC) was measured by asking participants to squeeze as strongly as they could on a hand held dynamometer at the beginning of the experiment. On each trial they were presented with a ‘rest’ option where they would have to put in no effort (0% MVC) but would receive a low reward of 1 credit vs. a ‘work’ option which was always more effort (30%-70% MVC) but also more reward (2-10 credits). After making their selection they then had to exert the required force to the correct degree to receive the reward. Visual feedback of the amount of force was displayed on the screen. They were informed that they would have to reach the required force level for at least 1 second out of a 3 second window over the yellow line. Participants then saw the outcome which corresponded to the offer they chose, unless they were unsuccessful where 0 credits would be displayed. Crucially, on ‘self’ trials participants made the choice, exerted the effort and received the reward, but on ‘other’ trials participants made the choice, exerted the effort and the other participant received the outcome. Participants completed 150 trials, 75 for themselves and 75 choosing for the other person.
Figure 2
Figure 2. Older adults discount rewards by effort less than younger adults, particularly for others.
(a) The discount rate (k) parameters were estimated by a parabolic model with separate parameters for self and other trials that had the best fit to participants choice behaviour. This model stated that the subjective value (SV) of a chosen offer was based on the level of reward on offer (R), subtracted from the estimated discount function for each participant (K), multiplied by the effort on offer (E), squared. (b) Full model comparison of parabolic, linear and hyperbolic discounting functions with either single (models 1–6) or separate discount (K) parameters (models 7–12) for self and other and/or single or separate noise (β) parameters for self and other. A parabolic model with separate parameters for self and other discounting, but a single noise parameter, best explained behaviour in the majority of subjects in both groups (model 7), which was determined by this model having the lowest summed BIC score, in combination with explaining behaviour in the highest proportion of participants. The pie chart shows the proportion of participants that the winning model explains behaviour for (blue) compared with the same model with separate noise parameters (purple). Graph displays relative BIC to model 7. (c) Comparison of the discount parameters from this winning model showed that older adults devalued rewards by effort less steeply particularly when someone else would benefit, compared to younger adults (recipient x group interaction, (b = -0.039 [-0.067 – - 0.011], z = -2.739, p = 0.006)). Note all results remained significant when excluding any outliers >3SDs from the mean k value. Asterisks denote significant difference at p<.01. Error bars show +/-SEM.
Figure 3
Figure 3. Acceptance rates for choices of ‘working’: Effort and reward varies by age group.
(a) Percentage chosen to work in young adults for different levels of effort. (b) Percentage chosen to work in older adults. (c) Difference in percentage acceptance between young and older adults across effort levels. (d) Percentage chosen to work in young adults for different reward levels. (e) Percentage chosen to work in older adults for different reward levels. (f) Differences in percentage chosen to work in younger adults compared to older adults for different reward levels. (g) 3D plot of choices to work across different effort and reward levels in young compared to older adults for the self condition. (h) 3D plot of choices to work across different effort and reward levels in young compared to older adults for the ‘other’ condition. (i) 3D plot of choices to work across different effort and reward levels in older adults, compared to younger adults, plotted for choices to help other compared to self. Error bars show +/- SEM.
Figure 4
Figure 4. Young adults but not older adults show superficial prosociality.
Panels show the mean area under the curve (AUC) during the 3s force period across effort levels normalised to participants maximum level of force exerted across trials. (a) Replication of Lockwood et al., (Lockwood et al., 2017) showing over-energisation of force at higher effort levels for self compared to other (b) Older adults showed no difference in amount of force exerted for self and other at any of the effort levels. Overall there was a significant group x recipient x force interaction that reflected these group differences in energisation (X2 (4) = 25.956, p<.001). Post-hoc comparisons showed a group x recipient interaction was significant at effort levels 4,5 and 6 (all ps<.012). Error bars show +/- SEM. For plot displaying all data points see Supplementary Materials Figure S1.
Figure 5
Figure 5. Correlations are stronger between individual differences in discounting and subjective feelings of positivity for helping oneself in younger compared to older adults.
We examined correlations between discount parameters (k) for self and other and self-reported subjective positivity at helping self and other. Participants rated on a 10-point scale from ‘not at all positive’ to ‘very positive’ how positive they felt when winning credits for self and when winning credits for other at the end of the experiment. (a) In younger adults, both self k and other k correlated with self and other positivity ratings (all ps=0.001). (b) In older adults only ratings for others correlated (p=.002) and not self (p=.277). The correlations between self k and positivity were significantly stronger in younger compared to older adults (Fishers r to Z value = 3.06, p=.002). All results remained significant when excluding any outliers > 3SDs from the mean. Therefore, older adults’ motivation to put in effort to help themselves is not correlated with how positive it makes them feel.

References

    1. Andreoni J. The Economic Journal. 401. Vol. 700. JSTOR; 1990. Impure Altruism and Donations to Public Goods: A Theory of Warm-Glow Giving; pp. 464–477. - DOI
    1. Ang Y-S, Lockwood P, Apps MAJ, Muhammed K, Husain M. Distinct Subtypes of Apathy Revealed by the Apathy Motivation Index. PLOS ONE. 2017;72(1):e0169938. doi: 10.1371/journal.pone.0169938. - DOI - PMC - PubMed
    1. Bates D, Mächler M, Bolker B, Walker S. Fitting Linear Mixed-Effects Models Using lme4. Journal of Statistical Software. 2015;7(7) 2015 https://www.jstatsoft.org/v067/i01.
    1. Beadle JN, Sheehan AH, Dahlben B, Gutchess AH. Aging, Empathy, and Prosociality. The Journals of Gerontology Series B, Psychological Sciences and Social Sciences. 2013:1–10. doi: 10.1093/geronb/gbt091. - DOI - PMC - PubMed
    1. Cameron CD, Hutcherson CA, Ferguson AM, Scheffer JA, Hadjiandreou E, Inzlicht M. Empathy is hard work: People choose to avoid empathy because of its cognitive costs. Journal of Experimental Psychology General. 2019;748(6):962–976. doi: 10.1037/xge0000595. - DOI - PubMed

Publication types

LinkOut - more resources