

Quantitative CT radiomics-based models for prediction of haematoma expansion and poor functional outcome in primary intracerebral haemorrhage
- PMID: 33860831
- PMCID: PMC8452575
- DOI: 10.1007/s00330-021-07826-9
Quantitative CT radiomics-based models for prediction of haematoma expansion and poor functional outcome in primary intracerebral haemorrhage
Abstract
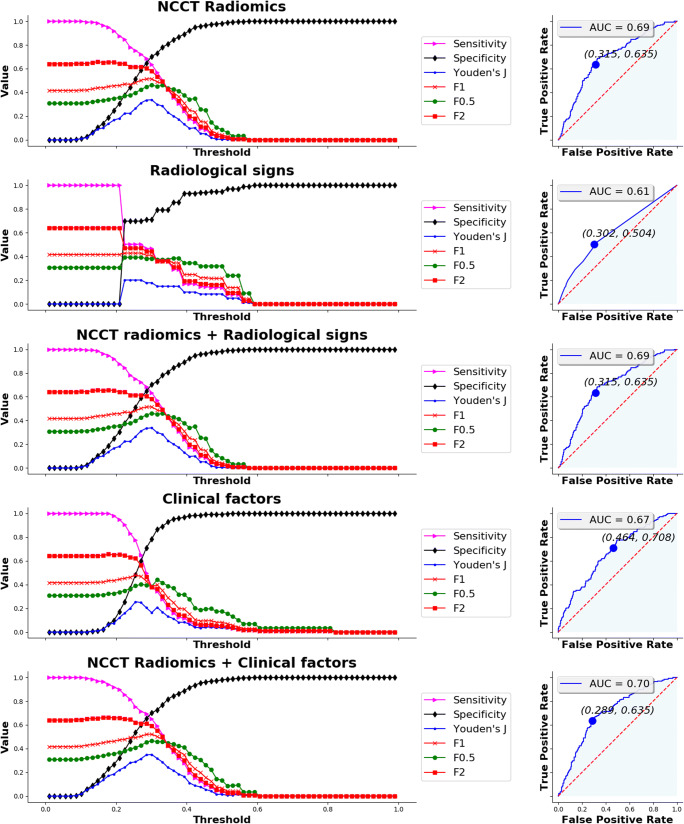
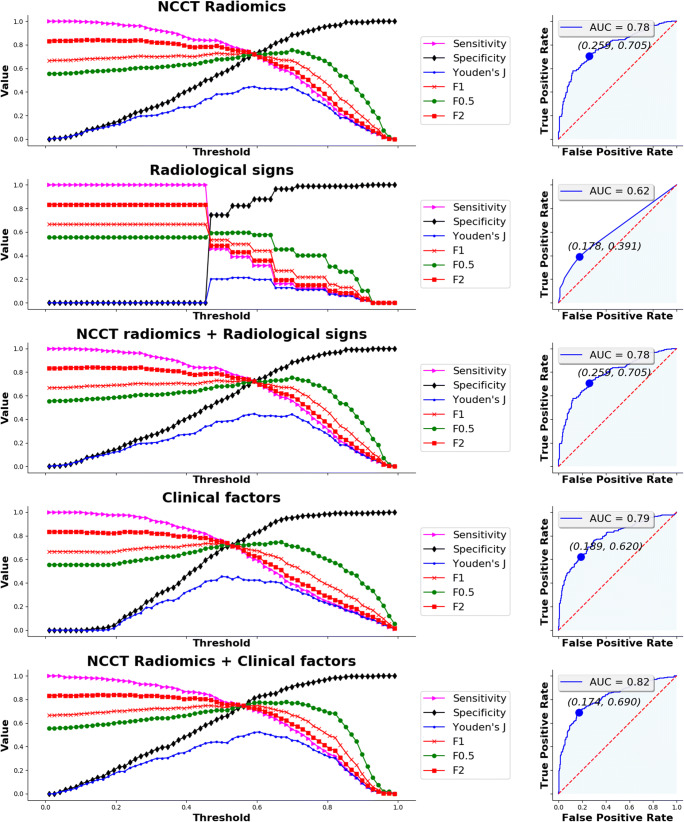
Objectives: To test radiomics-based features extracted from noncontrast CT of patients with spontaneous intracerebral haemorrhage for prediction of haematoma expansion and poor functional outcome and compare them with radiological signs and clinical factors.
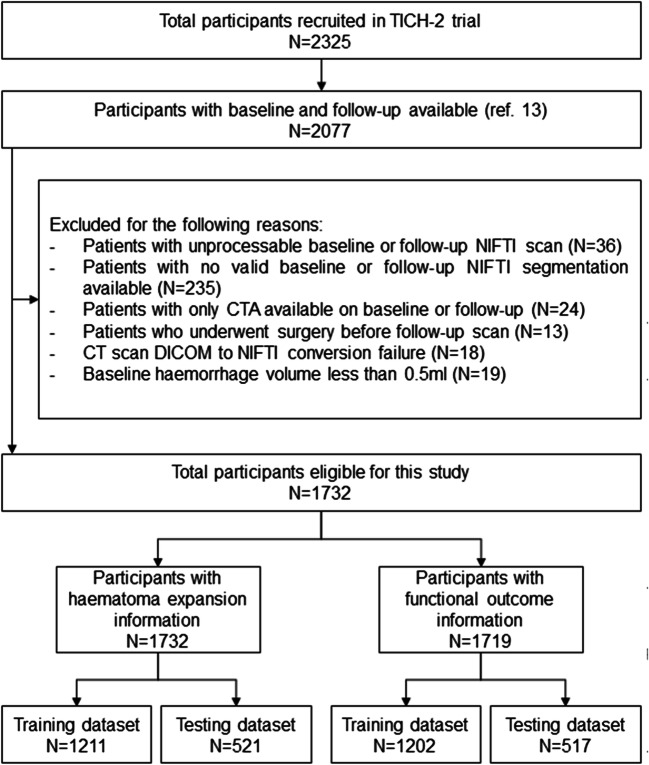
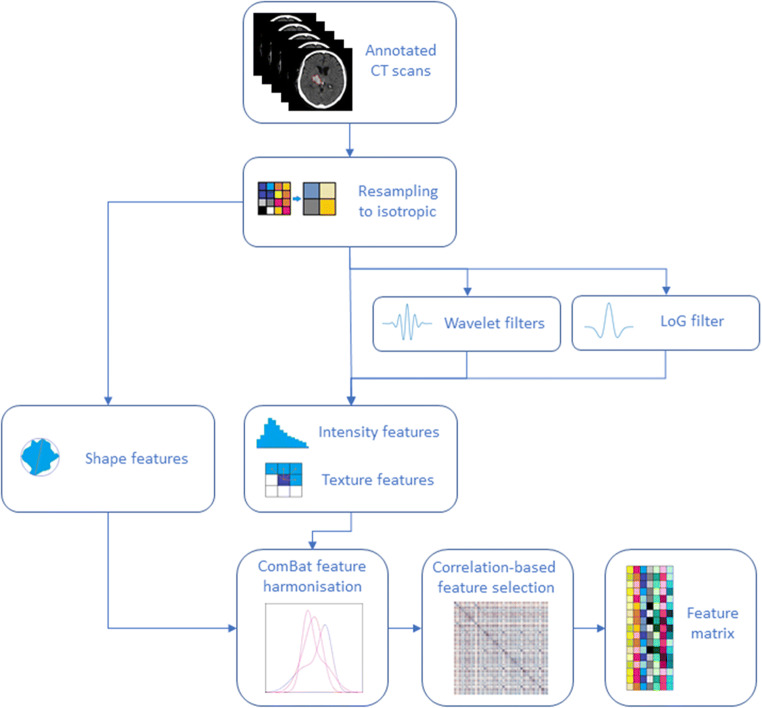
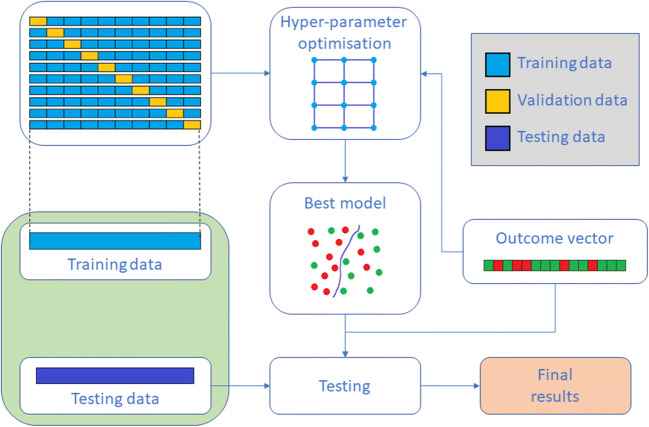
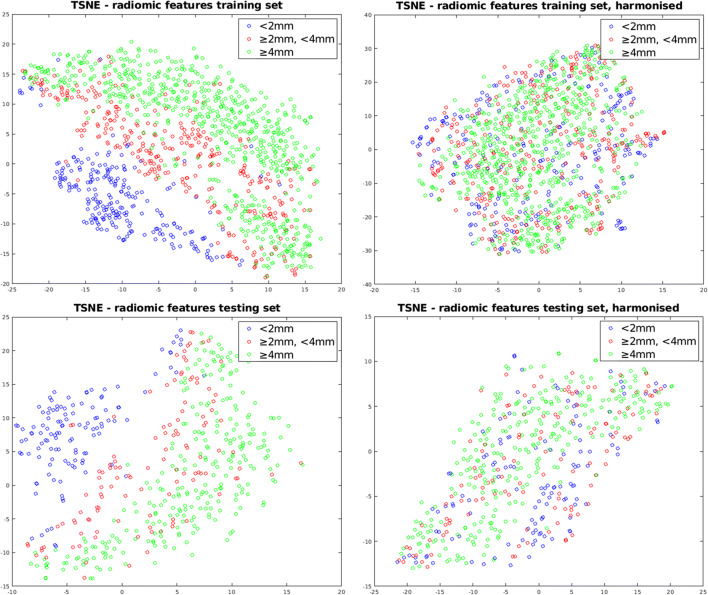
Materials and methods: Seven hundred fifty-four radiomics-based features were extracted from 1732 scans derived from the TICH-2 multicentre clinical trial. Features were harmonised and a correlation-based feature selection was applied. Different elastic-net parameterisations were tested to assess the predictive performance of the selected radiomics-based features using grid optimisation. For comparison, the same procedure was run using radiological signs and clinical factors separately. Models trained with radiomics-based features combined with radiological signs or clinical factors were tested. Predictive performance was evaluated using the area under the receiver operating characteristic curve (AUC) score.
Results: The optimal radiomics-based model showed an AUC of 0.693 for haematoma expansion and an AUC of 0.783 for poor functional outcome. Models with radiological signs alone yielded substantial reductions in sensitivity. Combining radiomics-based features and radiological signs did not provide any improvement over radiomics-based features alone. Models with clinical factors had similar performance compared to using radiomics-based features, albeit with low sensitivity for haematoma expansion. Performance of radiomics-based features was boosted by incorporating clinical factors, with time from onset to scan and age being the most important contributors for haematoma expansion and poor functional outcome prediction, respectively.
Conclusion: Radiomics-based features perform better than radiological signs and similarly to clinical factors on the prediction of haematoma expansion and poor functional outcome. Moreover, combining radiomics-based features with clinical factors improves their performance.
Key points: • Linear models based on CT radiomics-based features perform better than radiological signs on the prediction of haematoma expansion and poor functional outcome in the context of intracerebral haemorrhage. • Linear models based on CT radiomics-based features perform similarly to clinical factors known to be good predictors. However, combining these clinical factors with radiomics-based features increases their predictive performance.
Keywords: Cerebral parenchymal hemorrhage; Linear models; Predictive medicine; Radiomics.
© 2021. The Author(s).
Conflict of interest statement
The authors of this manuscript declare no relationships with any companies whose products or services may be related to the subject matter of the article.
Figures
References
MeSH terms
Grants and funding
LinkOut - more resources
Full Text Sources
Other Literature Sources
Medical
